In this study, we defined home care physicians as physicians who visit patients at home or in nursing homes and provide home care medicine. One FTE physician is defined as one full-time physician’s contribution to home care medicine; it does not include time not spent providing home care medicine, such as seeing out- or in-patients. Time spent providing home care medicine by part-time physicians was converted to FTE, using the proportion of the part-time physician’s average weekly or monthly time spent providing home care medicine to a full-time physician’s weekly or monthly working time at individual institutions.
Figure 1 (here)

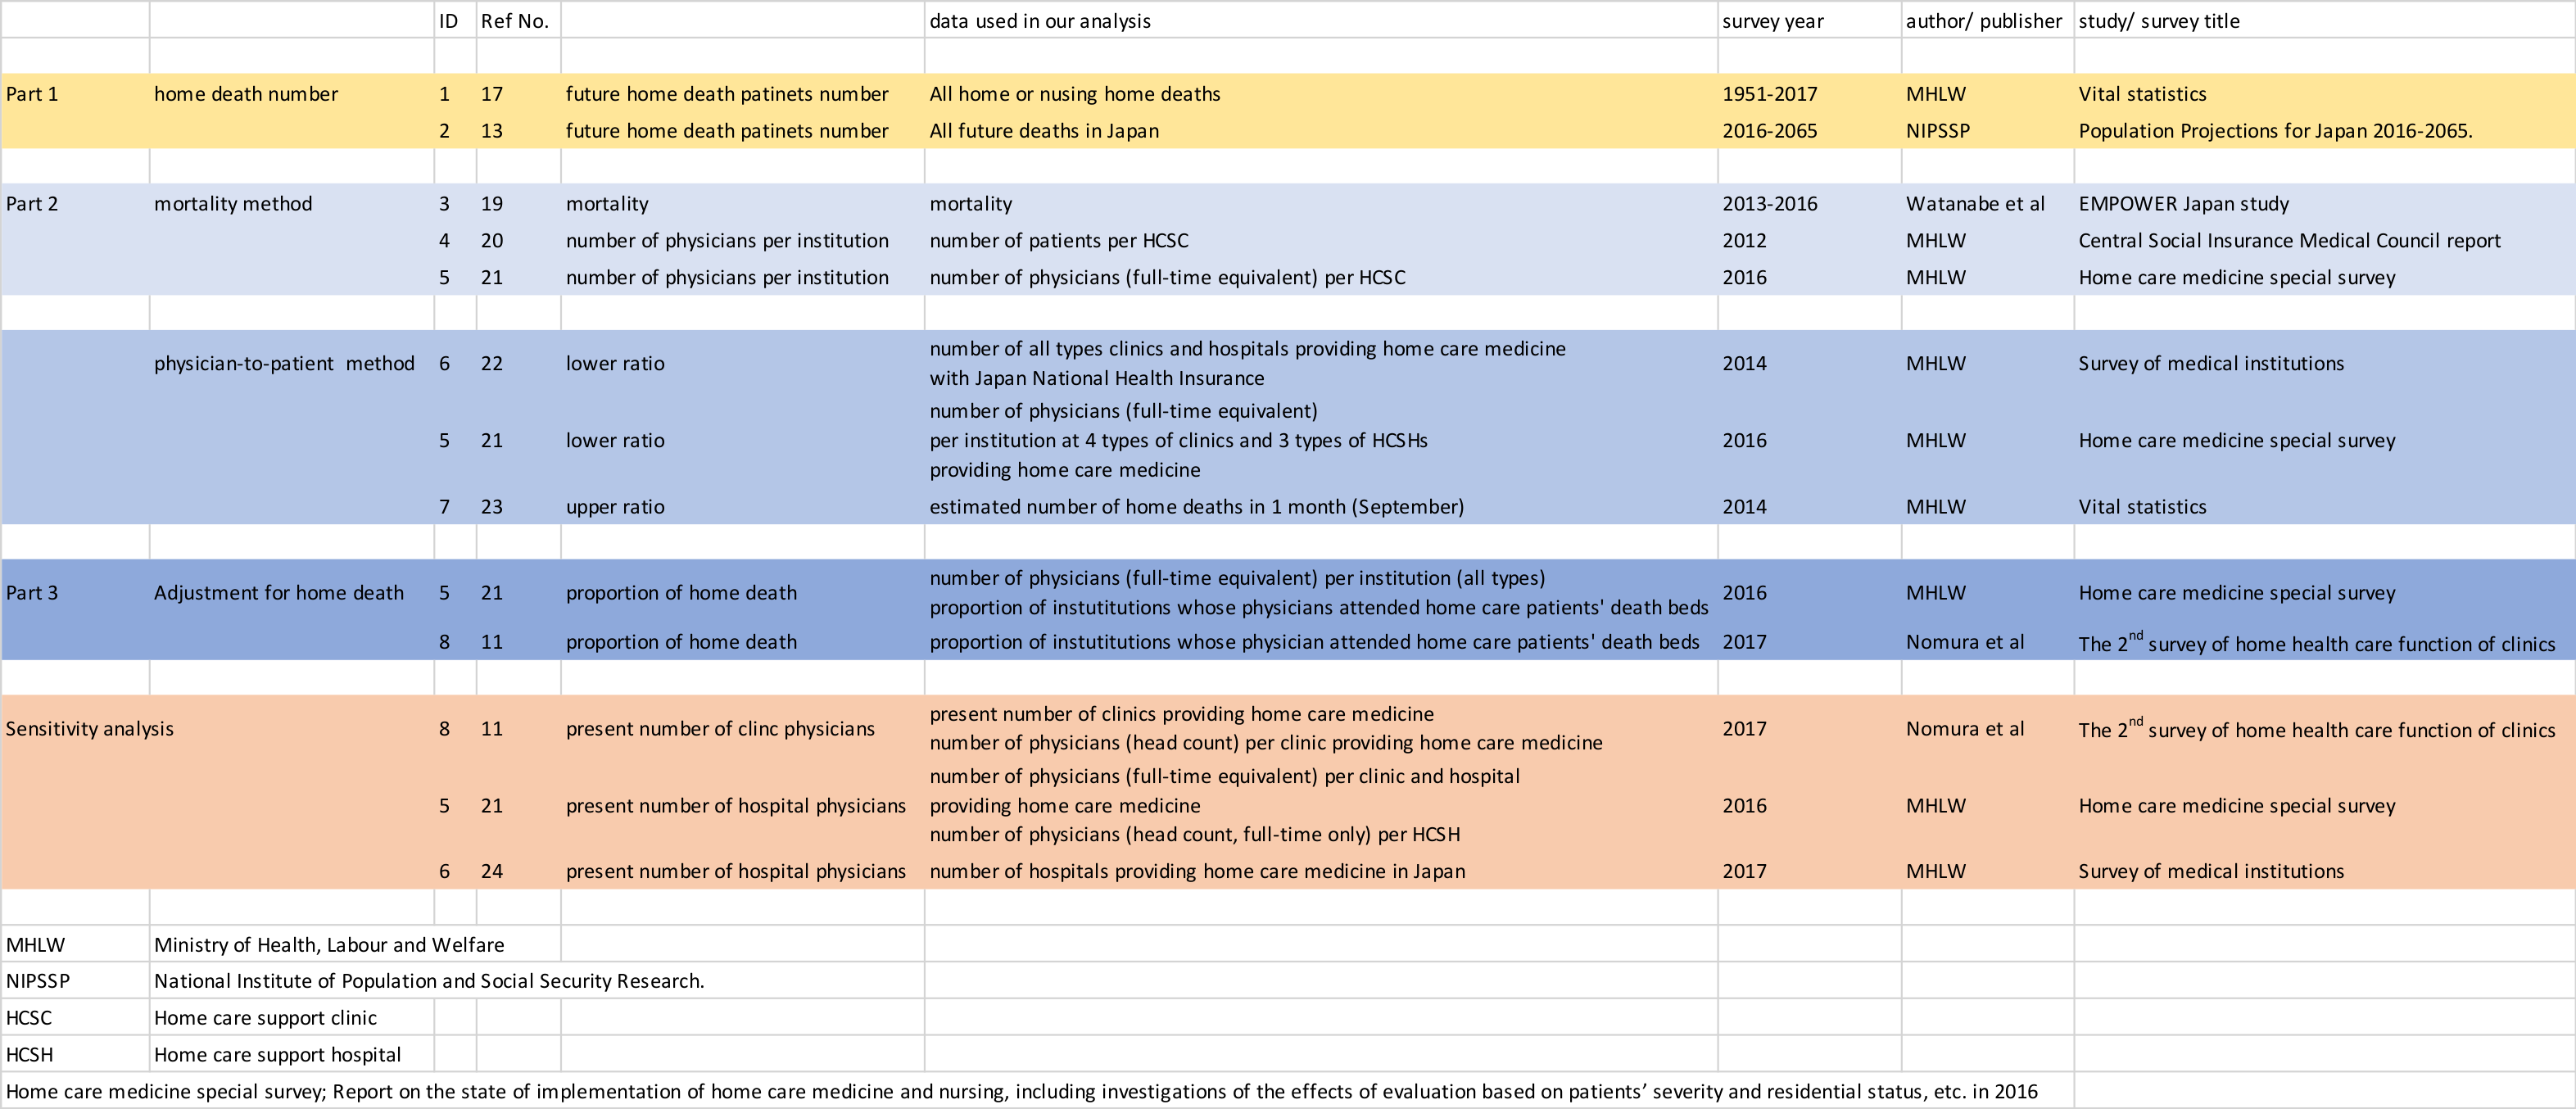
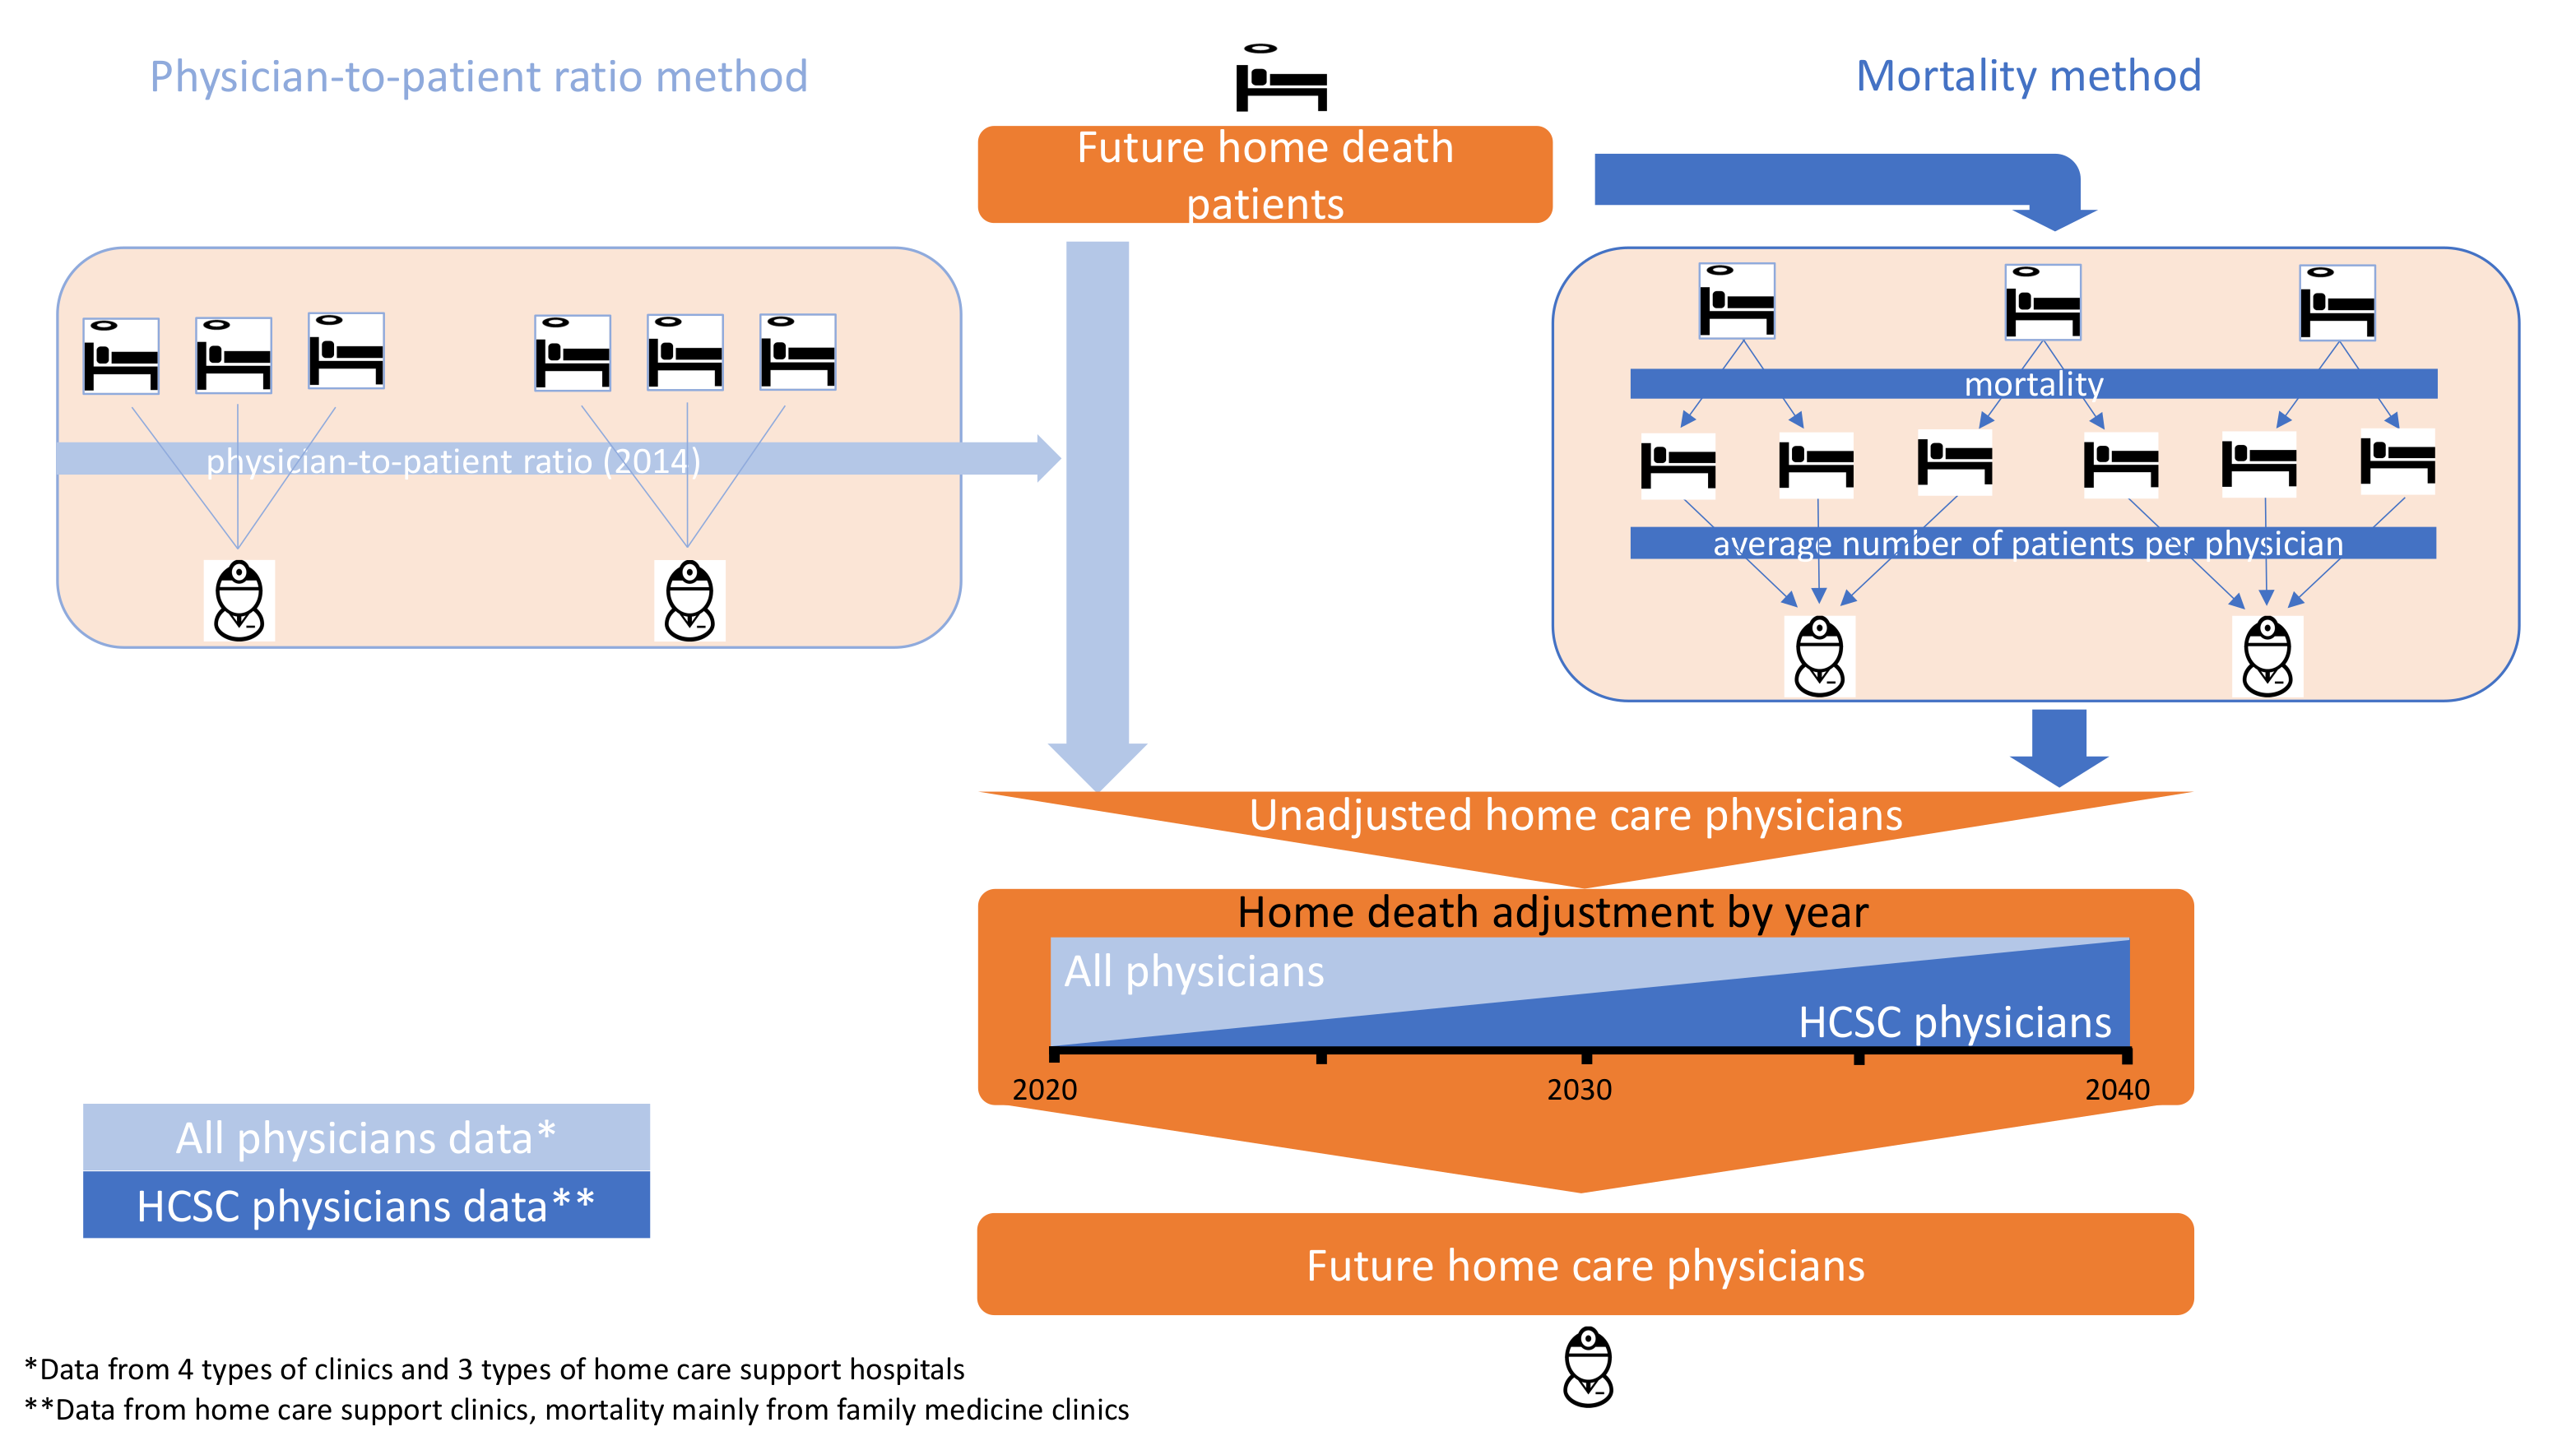
We employed two methods of analysis after calculating the annual number of home care patient deaths in order to estimate FTE physicians. The first is the mortality method, in which annual mortality among home care patients is used to estimate the total annual number of home care patients, enabling us to project the annual number of home care physicians by dividing by the average number of patients per physician. The second is the physician-to-patient ratio method, which applies the ratio of home care physicians and home or nursing home deaths (Additional file 1). In the mortality method, baseline home care physician data was from physicians who visit patients at home or in nursing homes, mainly at home care support clinics (HCSCs). However, in the physician-to-patient ratio method, data was from physicians who visit patients at home or nursing in homes, including many types of clinics and hospitals. (Additional file 2).
The process for estimating future need for home care physicians is summarized in Figure 1. Part 1 projects annual home and nursing home deaths based on estimated statistics from several official sources. Part 2 estimates the annual number of home care physicians who will provide end of life care in person using the figure derived in Part 1, by the following two methods:
Mortality method, Formula 1: Dividing mortality into projected annual home and nursing home deaths gives the projected number of annual home or nursing home patients, which is then divided by the average number of patients per physician.
Physician-to-patient ratio method, Formula 2: Using national survey data, the ratio of home care physicians to home or nursing home death patients is calculated and applied to projected annual home or nursing home deaths.
Finally, in Part 3, future home physicians divided by adjusted future proportion of home care physicians providing terminal care at home gives total future home care physicians.
Part 1
We first calculated estimates of home and nursing home deaths. In 2017, the National Institute of Population and Social Security Research (IPSS) provided a prediction of future total deaths [13]. Annual IPSS reports consider current and past age, sex, birth, death, and immigration data, providing high, low, and mid-range projections of future deaths.
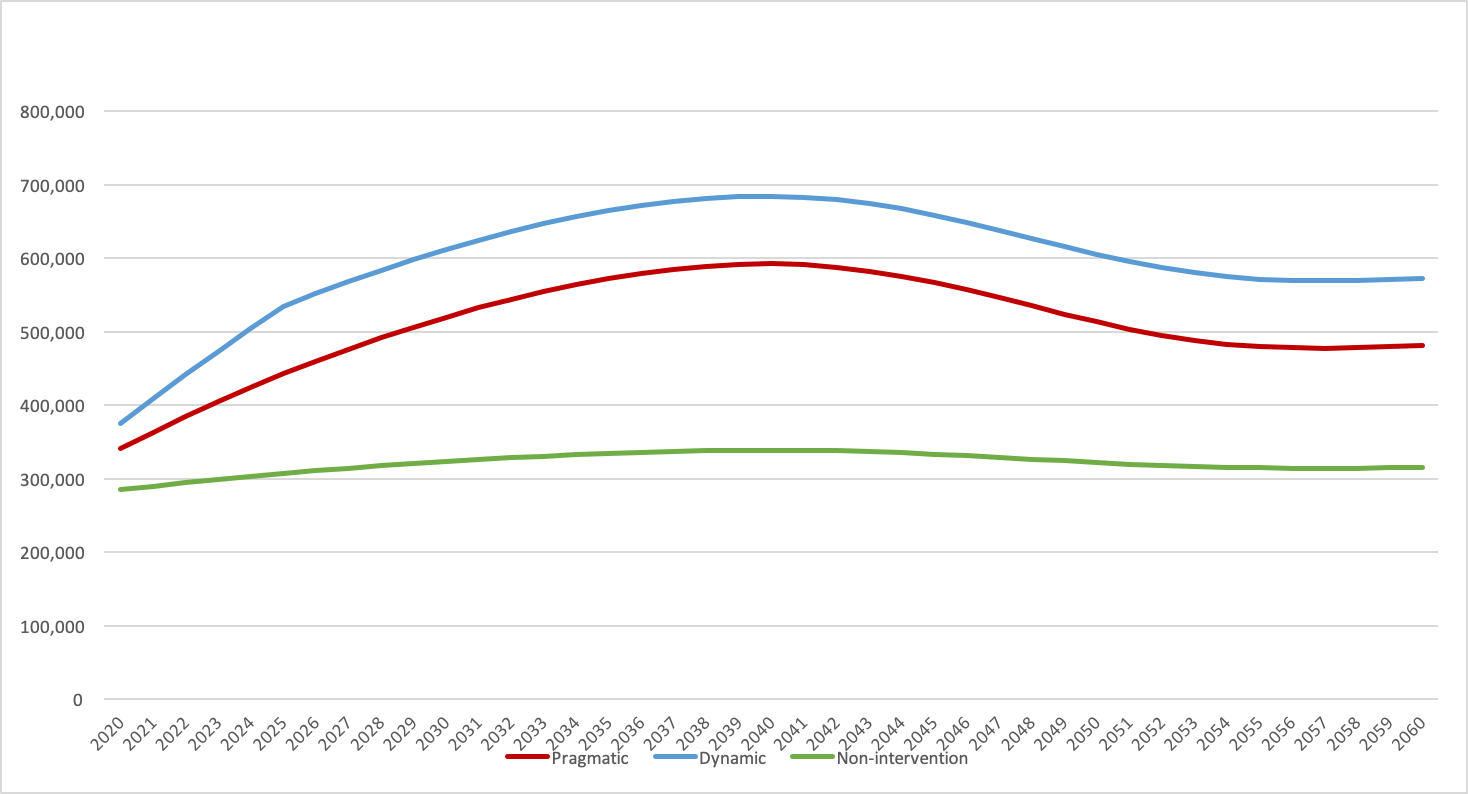
We calculated future home or nursing home deaths, subtracting deaths on hospitals beds including clinics and geriatric health service facilities (GHSFs), and others including accidental deaths. Importantly, the Regional Healthcare Vision aims to facilitate home medical care rather than increasing hospital beds, thus reducing hospital deaths. Hence, we applied three models in our projections. The first assumed total hospital deaths as constant after 2017, given that the Japanese government basically opposes additional hospital beds (pragmatic government model). The second assumed a constant proportion of deaths in hospitals, implying unchanged health policy with increases following current trends (non-intervention model). The third model assumed a 1.1% annual decrease in hospital deaths from 2018 to 2025, following the government’s reduction target from 1.31 million to 1.19 million beds by 2025 [14, 15]. This follows reports that available hospital beds correlate with hospital deaths [16]. However, hospital deaths are assumed to be constant after 2025 because of the growing elderly population (dynamic government model).
Government vital statistics in 2017 showed nursing home and GHSF deaths represent 7.5% and 2.5% of all deaths, respectively [17]. The Japan Cabinet study and Fukui et al reported that at most 8.6% and 12% of elderly Japanese prefer nursing homes or GHSFs, respectively [7, 18]. To estimate the minimum number of home deaths, we set the combined proportion of nursing home and GHSF deaths at 12% of all future deaths, and other causes of death at a constant 2.05% using the 2017 vital statistics [17].
After projecting home and nursing home deaths, two methods were used. We must note that the MHLW counts only clinics and hospitals which can provide home care and the number of times it is provided, and not exact numbers of home care physicians and home or nursing home patients.
Part 2
Mortality approach
The first method began by predicting future annual total home and nursing home patients by dividing deaths by mortality: 0.36 [0.32-0.40]/year. Mortality data were derived from a prospective Japanese multi-center home care cohort study [19]. Next, to predict the future number of FTE home care physicians, the estimated total number of patients receiving home and nursing home care was divided by the average yearly number of home care patients per physician (79.3) (Figure 1, Formula 1). This was calculated as follows. The MHLW reported the average number of home care patients per HCSC (65.8) [20]. In addition, we calculated the FTE physician-HCSC institution ratio (0.83) from a MHLW survey of home health care [21]. Finally, home and nursing home care patient numbers were divided by average patients per home care physician. Nursing homes were included because many home care physicians also provide care in nursing homes. Thus, serving in a nursing home also qualifies as home care medicine in Japan. Moreover, most Japanese home care medicine is supported by clinics. Therefore, our study also included future home care physicians at clinics.
Physician-to-patient ratio approach
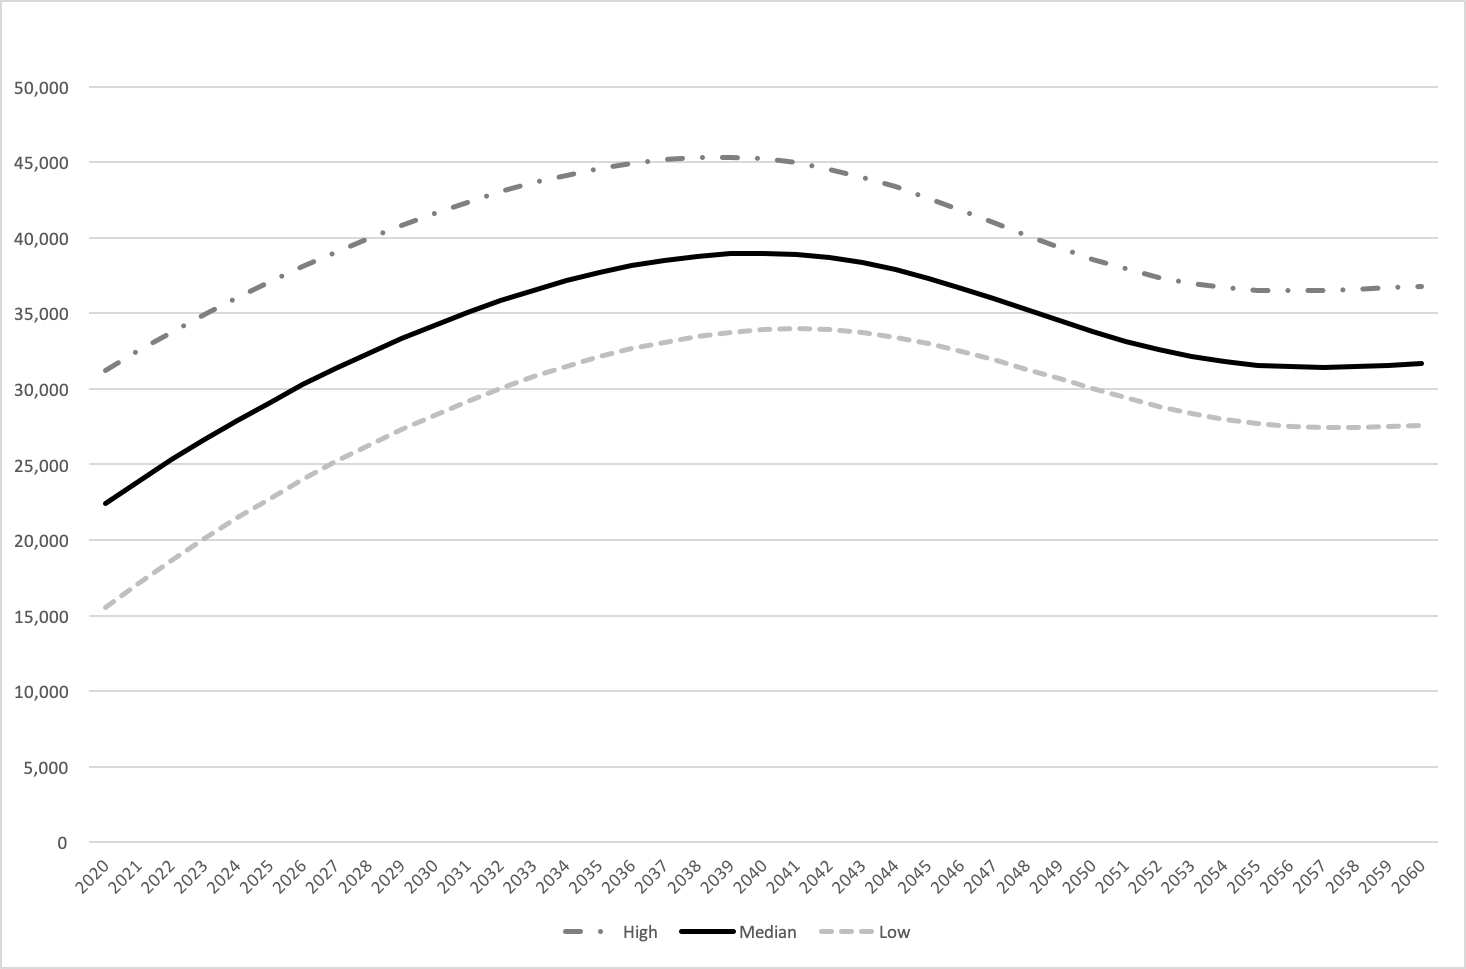
The second method uses the ratio of home deaths to FTE physicians shown in Figure 1, Formula 2. The MHLW does not monitor exact annual numbers of home or nursing home care patients and physicians, but in 2014, it conducted its triennial survey of all medical institutions in Japan, gathering data from one month (September) [22]. We estimated both numbers based on the 2014 survey, which showed hospitals and clinics taking part in home care and numbers of patients who died under a physician’s care without incident (8,996). We estimated the number of home care physicians using the home health care survey, which provided the average number of physicians for each type of clinic and hospital [21].Thus, we assume the precise number of monthly home care physicians (3,758) and consider it equal to the annual number of home care physicians. The number 3,758 was calculated as follows. The MHLW institution survey showed that the numbers of clinics and hospitals whose physicians attended at patients’ deathbeds were 4,312 and 476, respectively[22]. Although the deathbed numbers included both patients’ homes and nursing homes, the survey excluded nursing homes with adjacent institutions providing care. Further, nursing home death accounted for less than one-third (27.8%) of home and nursing home deaths in 2014 [17], and the numbers of physicians were surveyed for a 1-month period. Considering the relatively low ratio of deaths occurring at nursing homes, the short term of the study, and the fact that very few physicians from clinics or hospitals are likely to work exclusively at nursing homes, we regarded the numbers of physicians as those who attended patients’ deathbeds at home. Next, the ratios of FTE physicians to clinics and hospitals were calculated to be 0.75 and 1.1, respectively, from the MHLW home care medicine survey, although hospital data were from home care support hospitals (HCSH) only. This is because our literature search did not uncover any surveys or data for the other types of hospitals providing home care medicine, including the MHLW survey [21]. We regarded all hospitals providing home care medicine as HSCHs. Finally, these ratios were applied to the clinic and hospital numbers. However, considering the ratio of home deaths to total deaths in September from the 2014 vital statistics, we estimate that 12,487 people died at home during this month[23]; thus, the medical institutions survey might underestimate the number of home deaths because the figures were not reported by medical staff [22]. Hence, we regard 5,216 which is 3,758 times 12,487/8,996 as the highest number of home care physicians in 2014, with the annual number of home deaths being 162,599 [17]. Finally, our estimation uses a FTE physician-to-patient ratio between 0.023 and 0.032, which was applied to projected future home and nursing home deaths.
Part 3Adjustment for proportion of home death
After calculating the minimum future number of home care physicians, we considered the creation of training systems for home care physicians by adjusting for the proportion of patients whom physicians visited at the time of death at home, instead of in hospital.
Surprisingly, the state of Japanese home care medicine is such that physicians attended at their patients’ deathbeds (home death) at only 52.7% of institutions that provide home care medicine [11]. We calculated that the proportion of FTE physicians who attended at their patients’ deathbeds (home death proportion) was 55.0% in both Nomura et al and the MHLW survey[11, 21].Therefore, the minimum number of home care physicians should be about 1.82 times (1/0.55) the number who actually attend at deathbeds. This estimation can be confirmed in the national study [22], which reported that in 2014, 7,998 home care institutions took care of patients until death, but also showed there were at least 20,597 clinics and physicians regularly providing home care during a one-month period. Furthermore, Nomura et al implied that, with time, home care medicine will develop and improve, correlating with the increase in the proportion of home death patients whom physicians attend at their deathbeds [11]. Hence, we assumed that the home death proportion would gradually increase from 55.0% to 62.3% by 2040, a method which is unique to this study. This number (62.3%) is calculated as follows. There are four types of clinics providing home care in Japan: enhanced single center HCSCs, enhanced multi-center HCSCs, ordinary HCSCs, and other clinics [21]. Nomura et al and the MHLW report the proportion of home death at the three types of HCSCs (77.8%, 88.3%, and 59.3%; 68.9%, 57.5%, and 48.3%) and the number of each type of institution that participated in the studies (54, 240, and 563; and 10, 61, and 309), and the MHLW study reported the FTE physician-to-clinic ratio for home care medicine for each of the three types of HCSCs (2.4, 1.2, and 0.7) [11, 21]. We multiplied the number of each of the three types of HCSC physicians and each study’s home death proportion and averaged the results. Next, the averaged result was divided by the total number of HCSC physicians. Finally, we averaged the two proportions.
The formula is as follows:
