Of the selected mothers, 1265 responded to the questionnaire, giving a response rate of 97.3%. Participation from individual wards ranged between 76.5% - 100%. Of the non-respondents, four did not consent for participation (0.3%) and another 31 mothers (2.4%) who consented, had left the hospital before the interview was initiated.
The inter-rater reliability was satisfactory for all the data collectors as all had obtained an Intra class correlation coefficient between 0.96-0.99.
Socio demographic and pregnancy related details of the participants
Age ranged from 16 to 46 years, while most mothers belonged to the 20-35 years age group (n=1074, 84.9%). More than three fourths have obtained an educational qualification above year 11 (n=1029, 81.3%). A clear majority of the study sample (n=958, 75.7%) was unemployed. Average monthly income showed a wide variation, ranging from Rs.3,000.00 (17 USD) to Rs.350,000.00 (2000 USD). Close to half of the study sample were primi mothers (n=525, 41.5%) (Table 1).
Table 1: Distribution of the study participants by socio demographic characteristics
|
Socio-demographic characteristic
|
N=1265
|
|
N
|
%
|
|
Age in years
|
<20
|
73
|
5.8
|
|
|
20-35
|
1074
|
84.9
|
|
|
>35
|
118
|
9.3
|
|
Ethnicity
|
Sinhala
|
909
|
71.9
|
|
|
Muslim
|
184
|
14.5
|
|
|
Tamil
|
172
|
13.6
|
|
Religion
|
Buddhist
|
841
|
66.5
|
|
|
Catholic
|
112
|
8.9
|
|
|
Islam
|
192
|
15.2
|
|
|
Hindu
|
120
|
9.5
|
|
Highest level of education
|
|
|
|
|
No schooling
|
5
|
0.4
|
|
|
Year 1-5
|
23
|
1.8
|
|
|
Year 6-11
|
208
|
16.4
|
|
|
Passed year 11exam
|
518
|
40.9
|
|
|
Passed year 13 exam
|
409
|
32.3
|
|
|
Graduate
|
102
|
8.1
|
|
Occupation
|
Unemployed
|
958
|
75.7
|
|
|
Unskilled manual
|
19
|
1.5
|
|
|
Skilled manual
|
82
|
6.5
|
|
|
Sales and services
|
54
|
4.3
|
|
|
Clerical
|
54
|
4.3
|
|
|
Professional
|
98
|
7.7
|
|
Husbands’ level of education
|
|
|
|
|
No schooling
|
5
|
0.4
|
|
|
Year 1-5
|
17
|
1.3
|
|
|
Year 6-11
|
167
|
13.2
|
|
|
Passed year 11 exam
|
561
|
44.3
|
|
|
Passed year 13 exam
|
419
|
33.1
|
|
|
Graduate
|
94
|
7.4
|
|
|
Othera
|
2
|
0.2
|
|
Husbands’ Occupation
|
Unemployed
|
5
|
0.4
|
|
Unskilled manual
|
119
|
9.4
|
|
|
Skilled manual
|
531
|
42
|
|
|
Sales and services
|
407
|
32.2
|
|
|
Clerical
|
114
|
9
|
|
|
Professional
|
87
|
6.9
|
|
|
Othera
|
2
|
0.2
|
|
Income
|
No income
|
2
|
0.2
|
|
|
<30,000.00
|
252
|
19.9
|
|
|
30,000-39,999
|
344
|
27.2
|
|
|
40,000-49,999
|
231
|
18.3
|
|
|
=>50,000
|
436
|
34.5
|
|
Parity (Current)
|
P1
|
525
|
41.5
|
|
|
P2-P4
|
723
|
57.2
|
|
|
=>P5
|
17
|
1.3
|
| |
|
|
|
|
|
a-These participants did not have a husband
Mothers’ account on services received by them
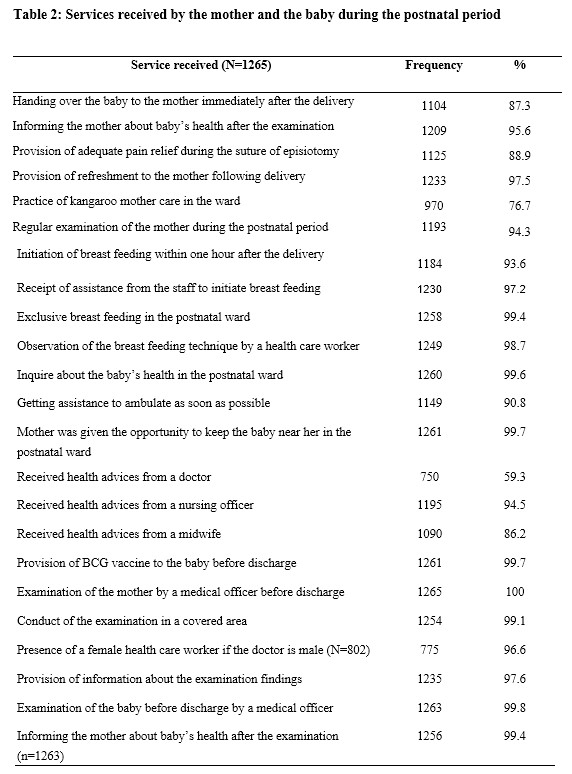
Services recommended in the national guidelines to be delivered during the postnatal period following a NVD were received by most of the participants. Majority have initiated breast feeding within one hour after delivery (n=1184, 93.6%) as recommended, and 99.4% mothers have exclusively breast fed while in the postnatal ward. The technique of breast feeding has been assessed by a health care worker for majority of mothers (n=1249, 98.7%) and corrected where necessary. Least frequently received service was the opportunity to practice kangaroo mother care (KMC) (n=970, 76.7%).
Inquiry was made into the services provided to the mother and the newborn at discharge. All the mothers and 99.8% (n=1263) of the babies have been examined by a medical officer at discharge, and over 95% of the examinees were informed about their examination findings (1235 participants were informed about their examination findings and 1256 were given information following examination of the baby). Privacy has been ensured during 99% of the examinations by covering the examination area (n=1254).
All mothers have received health advices regarding the postnatal period. The main sources of information were nursing officers and midwives (n=1195, 94.5% and n=190, 86.2% respectively). Medical officers have provided health advices to only 750 mothers in the study sample (59.3%) (Table 2).
Table 2: Services received by the mother and the baby during the postnatal period
|
Service received (N=1265)
|
Frequency
|
%
|
|
Handing over the baby to the mother immediately after the delivery
|
1104
|
87.3
|
|
Informing the mother about baby’s health after the examination
|
1209
|
95.6
|
|
Provision of adequate pain relief during the suture of episiotomy
|
1125
|
88.9
|
|
Provision of refreshment to the mother following delivery
|
1233
|
97.5
|
|
Practice of kangaroo mother care in the ward
|
970
|
76.7
|
|
Regular examination of the mother during the postnatal period
|
1193
|
94.3
|
|
Initiation of breast feeding within one hour after the delivery
|
1184
|
93.6
|
|
Receipt of assistance from the staff to initiate breast feeding
|
1230
|
97.2
|
|
Exclusive breast feeding in the postnatal ward
|
1258
|
99.4
|
|
Observation of the breast feeding technique by a health care worker
|
1249
|
98.7
|
|
Inquire about the baby’s health in the postnatal ward
|
1260
|
99.6
|
|
Getting assistance to ambulate as soon as possible
|
1149
|
90.8
|
|
Mother was given the opportunity to keep the baby near her in the postnatal ward
|
1261
|
99.7
|
|
Received health advices from a doctor
|
750
|
59.3
|
|
Received health advices from a nursing officer
|
1195
|
94.5
|
|
Received health advices from a midwife
|
1090
|
86.2
|
|
Provision of BCG vaccine to the baby before discharge
|
1261
|
99.7
|
|
Examination of the mother by a medical officer before discharge
|
1265
|
100
|
|
Conduct of the examination in a covered area
|
1254
|
99.1
|
|
Presence of a female health care worker if the doctor is male (N=802)
|
775
|
96.6
|
|
Provision of information about the examination findings
|
1235
|
97.6
|
|
Examination of the baby before discharge by a medical officer
|
1263
|
99.8
|
|
Informing the mother about baby’s health after the examination (n=1263)
|
1256
|
99.4
|
Client perceived quality of institutional postnatal care (CQIPNC)
The total obtainable score of CQIPNC ranged from 23 to 115. The obtainable scores for technical care and information domain, interpersonal care domain and ward facilities and cleanliness domain ranged between 9-45, 7-35, and 7-35 respectively.
The total score obtained for the CQIPNC questionnaire in the study ranged from 48 to 115. The median score obtained by the participants for the questionnaire was 108, which was 93.9% of the total obtainable score (IQR- 96-114). Technical care and information domain had a median score of 43 (IQR=38-45). Interpersonal care domain and ward facilities and cleanliness domain had median scores of 33 (IQR=30-35) and 32 (IQR=28-35) respectively (Table 3).
Table 3: Median values for each domain of the CPQIPNC questionnaire (N=1265)
|
Domain
(Number of items)
|
Range
|
Median
|
Median as a percentage of the maximum score (%)
|
IQR
|
|
Technical care and Information (9)
|
16-45
|
43
|
95.5
|
38-45
|
|
Interpersonal care (7)
|
16-35
|
33
|
94.3
|
30-35
|
|
Ward facilities and cleanliness (7)
|
16-35
|
32
|
91.4
|
28-35
|
|
Total score
|
48-115
|
108
|
93.9
|
96-114
|
Over 90% of the mothers have rated care as ‘good’ or ‘very good’ for all the items included in interpersonal care domain and the technical care and information domain. The ratings reduced somewhat for the items in the ward facilities and cleanliness domain. Only 81.1% have rated the cleanliness of the toilets in the ward as ‘good’ or ‘very good’. The ‘good’ or ‘very good’ ratings percentages for the space and the facilities available were 88.0% and 88.8% respectively (Table 4).
Table 4: Percentage of mothers either satisfied or extremely satisfied with each item in the CPQIPNC questionnaire (N=1265)
|
|
Domain and Item
|
Number
|
Percentage (%)
|
|
|
Interpersonal care
|
|
|
|
1
|
Friendliness shown by the HCWs
|
1210
|
95.7
|
|
2
|
Patience
|
1166
|
92.2
|
|
3
|
Promptness of the attention
|
1194
|
94.4
|
|
4
|
Availability of pain relief during the postpartum period
|
1233
|
97.4
|
|
5
|
Respect for privacy
|
1249
|
98.8
|
|
6
|
Willingness to discuss about your concerns
|
1155
|
91.3
|
|
7
|
Way health care workers treated your family members
|
1203
|
95.1
|
|
|
|
|
|
|
|
Technical care and Information
|
|
|
|
8
|
Help given for the initiation of breast feeding
|
1224
|
96.8
|
|
8
|
Help received to take care of your baby
|
1191
|
94.2
|
|
10
|
Help received to take care of yourself
|
1163
|
91.9
|
|
11
|
Information on taking care of the baby
|
1200
|
94.8
|
|
12
|
Information on proper method of breast feeding
|
1237
|
97.8
|
|
13
|
Information to identify danger signals
|
1163
|
91.9
|
|
14
|
HCWs’ skills to identify and manage health issues of your baby
|
1225
|
96.9
|
|
15
|
HCWs’ skills to identify and manage health issues in relation to you
|
1219
|
96.4
|
|
16
|
Information received to clarify your issues
|
1169
|
92.4
|
|
|
|
|
|
|
|
Ward facilities and Cleanliness
|
|
|
|
17
|
Cleanliness of the ward
|
1222
|
96.6
|
|
18
|
Cleanliness of the toilets & washrooms
|
1032
|
81.1
|
|
19
|
Space in the postnatal ward
|
1114
|
88.0
|
|
20
|
Adequacy of facilities in the ward
|
1124
|
88.8
|
|
21
|
Adequacy of delivery beds in the labour room
|
1235
|
97.7
|
|
22
|
Adequacy of numbers of HCWs
|
1232
|
97.4
|
|
23
|
Ability to get some rest
|
1130
|
89.3
|
HCW-Health Care Worker
Determinants of client perceived quality of care
For this analysis, the scores obtained for the CPQIPNC were categorized into high perceived quality and low perceived quality, based on the median value obtained for the questionnaire. Thus scores below 108 were categorized as low perceived quality (n=632), and scores equal to or above 108 were categorized as high perceived quality (n=633). The bivariate analysis depicted that participant characteristics such as the age between 20-35 years (OR=1.6, p=0.06), husband’s occupation (OR=1.2, p=0.08), average monthly income (OR=0.8, p=0.13), the type of institution used by the mother (OR=1.4, p=0.004); services such as initiation of breast feeding within one hour (2.2, p=0.001), informing the mother after examination of the baby (OR=1.9, p=0.02), provision of adequate pain relief during episiotomy suture (OR=2.2, P<0.001), giving assistance to practice KMC in the labour room and the ward (OR=1.4, p=0.02), receiving health advices from doctors (OR=2.6, p<0.001) and midwives (OR=3.2, p<0.001), regular examination of the mother (OR=2.0, p=0.009), getting assistance to initiate breast feeding (OR=1.9,p=0.12) were significantly associated with high perceptions of quality of care.
Among these variables, only 20-35 age category (aOR=1.8, p=0.024), teaching and specialized hospitals category (1.6, p<0.001), and services such as initiation of breast feeding within one hour of delivery (2.1, p=0.009), pain relief during suturing of the episiotomy (2.2, p<0.001), Ability to practice KMC (1.4, p=0.035), Receiving health advices by the doctors (2.1, p<0.001) and PHMs (2.1, p<0.001) were identified as significant correlates via the multivariate analysis (Table 5).
The final model explains between 10.7% (Cox & Snell R square) to 14.3% (Negelkerke R Square) of the variation in the client perceived quality. The Omnibus test was statistically significant with a p value of less than 0.001. Hosmer and Lameshow test was not significant, indicating that the model was a good fit to the data. The final model of the binary logistic regression correctly classified 52.5% of client perceptions.
Table 5: Results of the logistic regression on factors associated with a positive maternal perception of quality of care received in the institutional postnatal period
|
V1ariable
|
Frequency
|
Crude OR (p value)
|
aOR (p value)
|
|
Socio-demographic variables
|
|
|
|
Age
|
|
|
|
|
>35 years
|
73
|
1.2 (0.53)
|
1.3 (0.45)
|
|
20-35 years
|
1074
|
1.6 (0.06)
|
1.8 (0.024)
|
|
<20 years
|
118
|
1
|
1
|
|
Husbands’ Occupation
|
|
|
|
|
Other occupations
|
608
|
1.2 (0.08)
|
1.2 (0.08)
|
|
Unemployed or manual worker
|
657
|
1
|
1
|
|
Income
|
|
|
|
|
≥ 40,000 Rupees
|
667
|
0.8 (0.69)
|
0.8 (0.16)
|
|
<40,000 Rupees
|
598
|
1
|
1
|
|
Institutional characteristics
|
|
|
|
|
Teaching/ Specialized hospitals
|
994
|
1.6 (<0.01)
|
1.4 (<0.01)
|
|
Base hospitals
|
271
|
1
|
1
|
|
Service provided to the mother and the newborn
|
|
|
Initiation of breast feeding immediately after the delivery
|
|
Yes
|
1184
|
2.2 (<0.01))
|
2.1 (<0.01)
|
|
No
|
81
|
1
|
1
|
|
Provision of adequate pain relief for suture of episiotomy (1264)
|
|
|
|
Yes
|
1125
|
2.2 (<0.01)
|
2.2 (<0.01)
|
|
No
|
295
|
1
|
1
|
|
Practicing Kangaroo Mother Care at ward
|
|
|
|
Yes
|
970
|
1.4 (0.02)
|
1.4 (0.04)
|
|
No
|
295
|
1
|
1
|
|
Receipt of health advices from the doctors
|
|
|
|
Yes
|
750
|
2.6 (<0.01)
|
2.1 (<0.01)
|
|
No
|
515
|
1
|
1
|
|
Receipt of health advices by the Midwives
|
|
|
|
Yes
|
1090
|
3.2 (<0.01)
|
2.1 (<0.01)
|
|
No
|
175
|
1
|
1
|
|
Regular examination of the mother in the postnatal period*
|
|
Yes
|
1193
|
2.0 (<0.01)
|
-
|
|
No
|
72
|
1
|
1
|
|
Informing about the baby’s health after examination*
|
|
Yes
|
1209
|
1.9 (0.02)
|
-
|
|
No
|
56
|
1
|
1
|
|
Help received from the health staff for breast feeding*(1255)
|
|
|
Yes
|
1230
|
1.9 (0.12)
|
-
|
|
No
|
25
|
1
|
1
|
| |
|
|
|
|
|
|
* These variables were removed in the multivariate analysis prior to the final model