Disruption of SCN11A
Nav1.9 KO mice were genotyped by PCR using genomic DNA from ear marginal tissue. Primer pair 1 and primer pair 2 was used to specifically distinguish WT and Nav1.9-/- genotypes. The resulting products of WT, Nav1.9+/- and Nav1.9-/- were analyzed by agarose gel electrophoresis (Fig. 2A). The deletion of 347 bp, starting in exon 3 and ending in exon 5 of the coding sequence of SCN11A mRNA, induced a truncated form of Nav1.9 with 96 amino acid residues, and led to the reading frame shift mutation followed by a premature translational-termination codon (Fig. 2B). The mutation resulted in dysfunction of the protein with no membrane-spanning domain. No significant phenotypic difference was found in Nav1.9-/- mice from WT littermates in their size, weight, coat color, locomotor activity, eating or drinking behavior, fertility and life span. Besides, necropsy and histology between Nav1.9-/- and WT mice were considered indistinguishable, apart from a poor protein expression of Nav1.9 in the cochlea of Nav1.9-/- mice (Fig. 2C).
Nav1.9 is expressed in the inner ear and auditory pathway of wild-type mice
The expression of Nav1.1 and Nav1.9 mRNA from modiolus was examined using qPCR in WT mice from P0-P60 (5 mice in each time point). During cochlea development, the expression of Nav1.9 showed no significant difference at P7, P14, P28 and P60 (Fig. 3A, one-way ANOVA, F=1.673, p=0.18). However, the relative expression levels of Nav1.1 mRNA at P14 and P60 were significantly higher than that at P0 (Fig. 3A, one-way ANOVA with Tamhane’s post-hoc test, *p=0.028, **p=0.004).
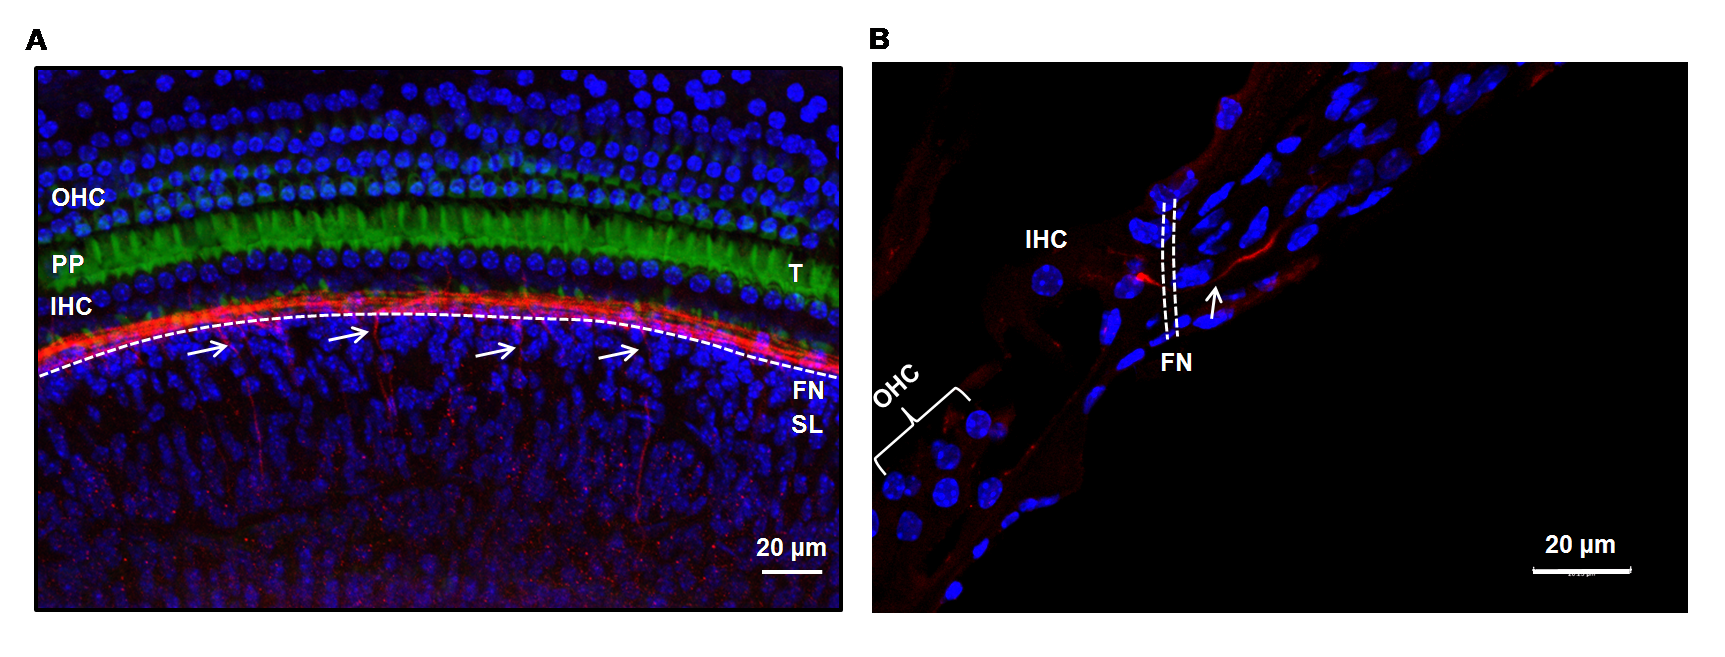
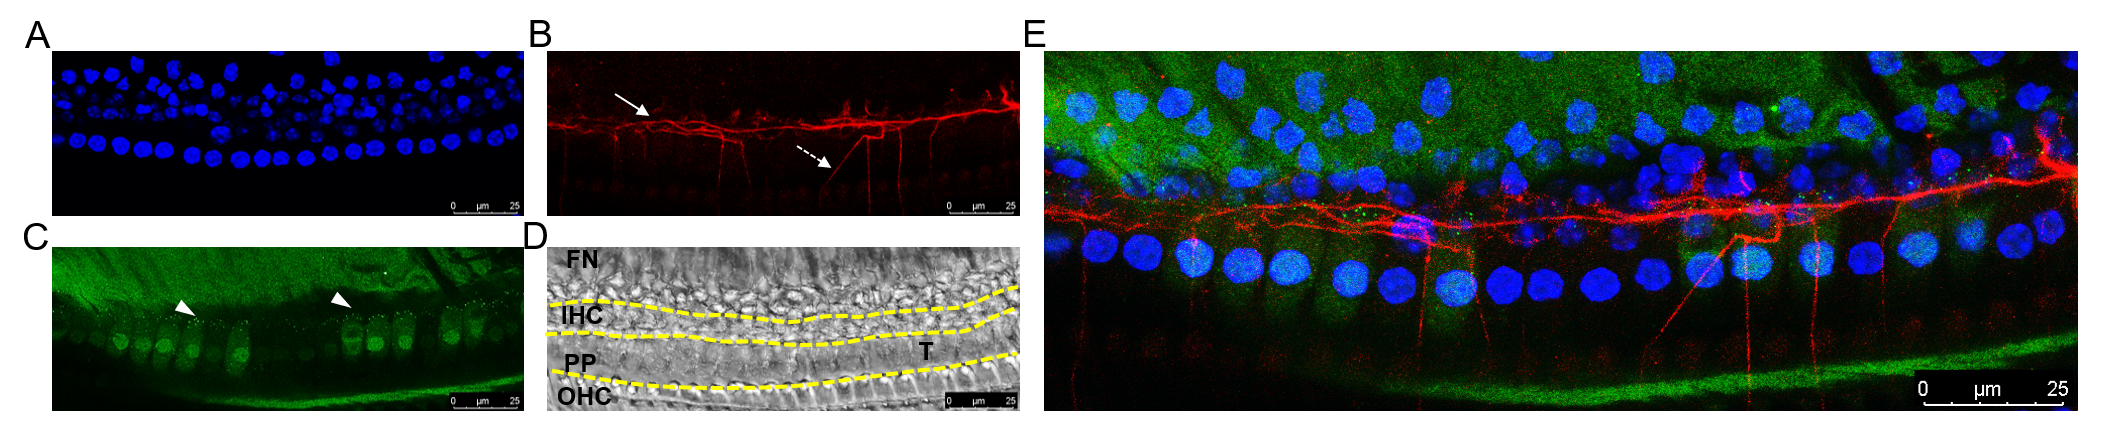
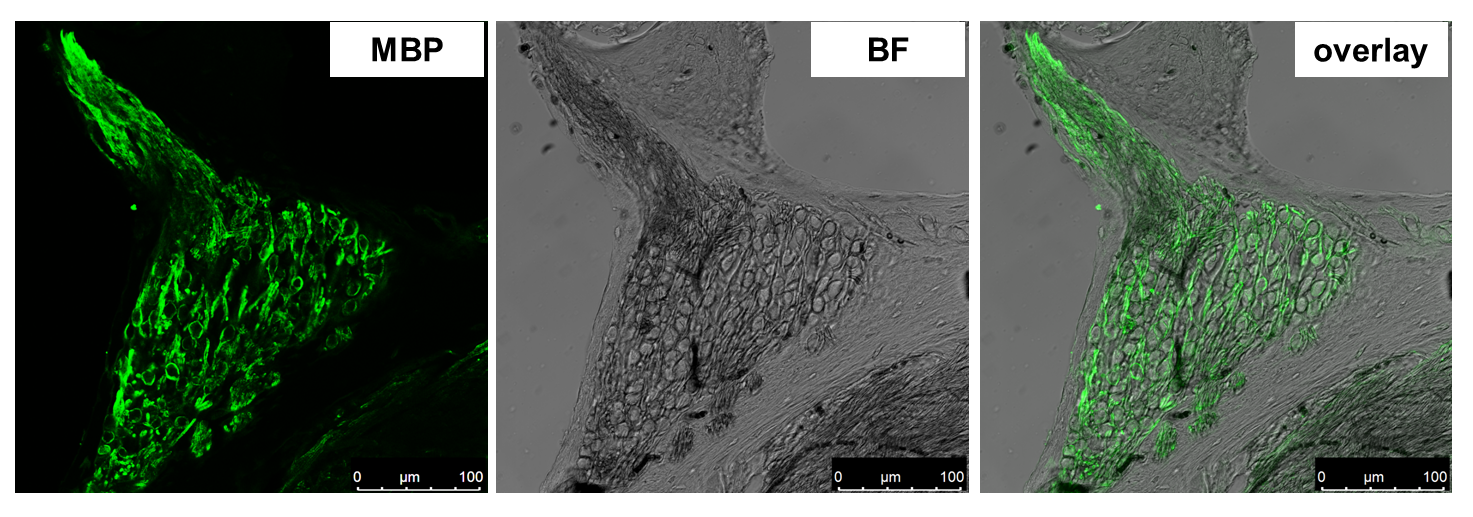
The localization of Nav1.9 in the cochlea was primary afferent and efferent endings in the organ of Corti, SGN somata and cochlear nucleus (Fig. 3B). It was found that, in mouse cochlea, Nav1.9 immunoreactivity was located in inner spiral fibers beneath the inner hair cells (IHCs), radial fibers innervating IHCs, tunnel crossing fibers and outer radial fibers (Fig. 3C c1 c3 and c4), according to the diagram of the cochlea’s afferent innervations pattern from Ballenger’S OTORHINOLARYNGOLOGY 18 (Fig. 3C c2). Nav1.9 immunoreactivity was present in a small number of neurons, which couldn’t be stained by anti-MBP antibody, a marker labeling myelin sheath (Fig. 3D and Fig. S3). Some neurons within the cochlear nucleus exhibited expression of Nav1.9 on cell membranes at a relatively low density (Fig. 3E), which was consistent with data from previous studies [19].
Nav1.9-/- mice are deaf progressively at 16 kHz
ABR was used to assess hearing thresholds in 2-month-old mice. The averaged ABR thresholds of Nav1.9+/+ mice,Nav1.9+/- mice and Nav1.9-/- mice showed no significant difference with each other at 2 kHz (Fig. 4A, one-way ANOVA, F=2.954, p=0.085) and 8 kHz (Fig. 4A, one-way ANOVA, F=0.576, p=0.571), respectively (Tab. 2). In addition, Nav1.9-/- mice (n=7) showed a remarkably higher average ABR threshold than Nav1.9+/- (n=4) and WT mice (n=6) by 36.8 dB SPL ( **p=0.002) and 38.3 dB SPL (**p=0.001) at 12 kHz (Fig. 4A, one-way ANOVA with Bonferroni’s post-hoc test), respectively. The average ABR threshold of Nav1.9-/- mice was up to 78.9 ± 10.5 dB SPL, which is significantly higher than Nav1.9+/- (58.8±14.9 dB SPL) (*p = 0.01) and WT mice (41.7 ±6.6 dB SPL) (***p=0.000) at 16 kHz, while the average ABR threshold of Nav1.9+/- was higher than WT mice (*p=0.032) (Fig. 4A, one-way ANOVA with Bonferroni’s post-hoc test) as well. In all mice tested, threshold elevation correlated with reduced amplitudes of all ABR waves at 16 kHz were found in Nav1.9-/- mice (Fig. 4B).
Table 2
ABR thresholds in Nav1.9+/+, +/-, -/- mice at 2 months of age

To examine the onset time of hearing loss, ABR thresholds at the P21, P30, and P60 were measured at 8 and 16 kHz, respectively. At 8 kHz, the average ABR thresholds of WT mice was 38.7 ± 5.5 (n =15) at P21 and 39.0 ± 8.1 dB SPL (n = 10) at P60. The ABR thresholds of Nav1.9-/- mice was 39.3 ± 5.3 dB SPL (n=7) at P21 and 36.7 ± 6.6 dB SPL (n=9) at P60. There was no significant difference between the WT and KO mice (Fig. 4C, t=-0.248, p=0.807 at P21; t=0.087, p=0.932 at P30; t=0.683, p=0.504 at P60 with independent samples t test); At 16 kHz, the ABR threshold of WT mice was 30.0 ± 8.5 dB SPL (n=15) at P21, which was significantly lower than their Nav1.9-/- littermates of 44.3 ± 8.9 dB SPL (n=7) (U=14.5, Z=-2.751, **p=0.006 with Mann-Whitney U test). Besides, the Nav1.9-/- mice showed a significant ABR threshold elevation compared with their WT littermates at P30 (72.9 ± 17.5 dB SPL (n=12) vs 40.0 ± 9.1 dB SPL (n=4), U=4.5, Z=-2.406, *p=0.016 with Mann-Whitney U test Fig. 4D), and at P60 (78.9 ± 10.5 dB SPL (n=9) vs 41.7 ± 6.6 dB SPL (n=9), U=0.000, Z=-3.608, ***p=0.000 with Mann-Whitney U test Fig. 4D). The ABR threshold shifts of Nav1.9-/- mice in comparison with WT littermates, were 14.3 dB SPL at P21, 32.9 dB SPL at P30, and 37.2 dB SPL at P60, respectively, exhibiting progressive hearing loss (Tab. 3).
Table 3
ABR thresholds in Nac1.9+/+, -/- mice at different age

CAP and CM recordings
In order to identify the lesion region of hearing loss affected by Nav1.9, the CAP was recorded from the round window of cochlea. The average threshold of CAP of Nav1.9-/- mice was 80.0±10.0 dB (n = 5) which was significantly higher than the WT mice (45.0±11.5 dB SPL, n=4) (U=0.000, Z=-2.491, *p=0.013 with Mann-Whitney U test, Fig. 5A). The average amplitude in P1 wave of Nav1.9-/- mice at 80 dB SPL was 4.6±3.9 μV (n=5) which was significantly lower than that form the WT mice (22.1±15.6 μV, n=5), (t=2.434, *p=0.041, independent samples t test, Fig. 5B). In addition, the average latencies of P1 waves from WT and Nav1.9-/- mice were 2.1±0.4 ms (n=7) and 2.4±0.4 ms (n=5), respectively, with no statistical difference (t=-1.244, p=0.242 with independent samples t test) (Fig. 5C). The representative CAP waveforms of WT and Nav1.9-/- were shown in Fig. 5D and Fig. 5E.
The CM responses at 4 kHz were recorded in the WT and KO mice followed the frequency and waveform of the sound stimuli. We recorded normal CMs from Nav1.9-/- mice (Fig. 6A, 6B, 6C). Difference in the CMs growth functions between WT and Nav1.9-/- mice was not significant. In all, these results led us to conclude that the hearing impairment observed in Nav1.9-/- mice qualifies as auditory neuropathy.
Ribbon synapse counting
The quantitative changes in ribbon presynaptic RIBEYE were stained using antibodies against CtBP2. The average number of CtBP2 puncta in WT mice (n=7) was 7.3 ± 2.4 per IHC, which was statistically higher than that in Nav1.9-/- mice with 4.2 ± 1.6 per IHC (n=5) (U=4.5, Z=-2.122, *p=0.034, Mann-Whitney U test, Fig. 7A, 7B, 7C). This data indicates that Nav1.9 KO induced auditory deficits by a mechanism including cochlear synaptopathy.
SGN counting
The number of spiral ganglion neurons (SGNs) was counted. The average number of the SGNs in the basal turn of cochlea of Nav1.9-/- mice (n=4) was 37.0±3.1, which is significantly lower than that of WT mice (n=5) with 51.0±5.8 (U=0.000, Z=-2.46, *p=0.014, Mann-Whitney U test, Fig. 7D, 7E, 7F). However, the number of SGNs in both apical (t=0.518, p=0.622 with independent samples t test) and middle turn (t=0.703, p=0.823 with independent samples t test) showed no statistical difference between the two groups. The average numbers of SGN were 45.8 ± 4.7 in apex and 53.8±8.2 in middle for Nav1.9-/- mice; 48.3 ± 9.3 in apex and 54.6 ± 11.2 in middle for WT mice, which was in accordance with impaired temporal neural code at high frequency, such as 16 kHz.
Nav1.9 knockout with intact OHCs
Nav1.9-/- mice had spared outer hair cells (OHCs) function of mechanoelectrical transduction and cochlear amplification, as evidenced by preserved cochlear microphonic potentials (CM). To explore the hair cell morphology in the region of ABR threshold shift, a standard cochleogram of a 4 months old Nav1.9-/- mouse was provided (Fig. 8A), containing scales of frequency, percent distance from the apex according to Müller (2004) (Fig. 8B). No significant hair cell missing from base to apex was found in cochleograms from DAPI stainging, especiall in the middle turn (30-55% distance from the apex) (Fig. 8C). Subsequently, we investigated the morphology of inner and outer hair cell stereocilia by scanning electron microscopy. Adult Nav1.9-/- mice at 2 months had well-formed stereociliary bundles, with evenly spaced stereocilia within each bundle and an equal height within each row for the apical (Fig. 8D, b1-b3) and middle turn (Fig. 8D, b4-b6), the basal turn as well (Fig. 8D, b7-b9).
