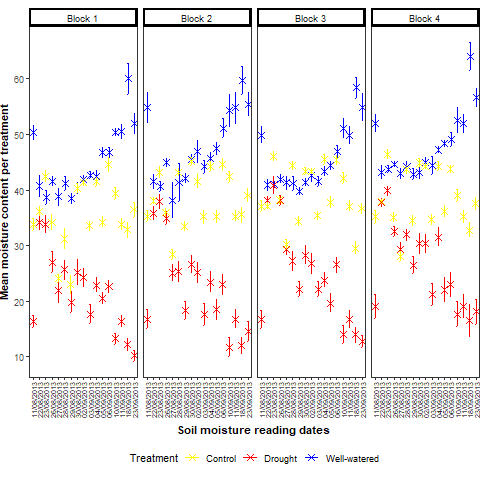
Phenotypic differences during water stress
Two M. sacchariflorus (Msac-G1 and Msac-G3), one M. sinensis (Msin-G2), two M. x giganteus (Mxg-G4 and Mxg-G5) and a newly bred interspecific triploid hybrid (Hyb-G6) were compared in drought and flooded conditions. Responses of each genotype were evaluated in terms of electrolyte leakage, relative water content (RWC) at two time points, and fresh and dry biomass weight (Fig. 1; Suppl. Figure 1: fresh and dry biomass by genotype with non-log transformed data).
Electrolyte leakage: Significant effects (P<0.05) on electrolyte leakage (logarithmic value) were observed for all contrasts in the experiment (Table 1). Genotype x treatment interaction effects were significant at P<0.001. When comparing drought, flooded and control conditions, high mean electrolyte leakage was recorded for Msac-G1, Msin-G2, Mxg-G5 and Hyb-G6 under flooded conditions, indicating stress induced by excess water. On the contrary, lower mean electrolyte leakage was recorded for Msac-G3 and Mxg-G5 in both control and drought conditions (Fig. 1, Table 2, Suppl. Table S1).
Table 1: Analysis of variance (REML method), fixed effects are displayed for electrolyte leakage, relative water content, fresh weight and dry weight.
|
Effects
|
Electrolyte leakage
|
Relative water content
|
Fresh weight
|
Dry weight
|
|
Treatment
|
0.0204
|
0.0039
|
<.0001***
|
0.0012**
|
|
Genotype
|
0.0061
|
0.0039
|
<.0001***
|
<.0001***
|
|
Genotype x treatment
|
0.0002
|
0.0005
|
0.0163*
|
0.0862ns
|
|
Date
|
NA
|
0.0165
|
NA
|
NA
|
|
Date x Genotype
|
NA
|
0.5691
|
NA
|
NA
|
|
Treatment x Genotype x Date
|
NA
|
0.0111
|
NA
|
NA
|
|
|
|
|
|
|
à NA = not applicable
Table 2: Estimates and confidence intervals (brackets) of electrolyte leakage, relative water content, fresh biomass, dry biomass and fresh biomass for six genotypes and three conditions (control, drought, flooded).
|
Genotype
|
Condition
|
Electrolyte leakage (25/09/13)
|
Relative water content T1 (13/09/13)
|
Relative water content T2 (24/09/13)
|
Fresh weight -g- (25/09/13)
|
Dry weight -g- (27/09/13)
|
RNA-seq libraries
|
|
(G1) M. sacchariflorus var. Dk-1
|
Control (C)
|
6.26
(5.67, 6.90)
|
96.98
(95.24, 98.53)
|
98.60
(97.06, 99.97)
|
62.44
(54.06, 72.08)
|
12.12
(10.32, 14.21)
|
M39, M51, M63
|
|
Drought (D)
|
6.29
(5.50, 7.17)
|
95.22
(92.61, 97.47)
|
87.73
(83.87, 91.04)
|
33.33
(27.05, 41.00)
|
9.83
(7.75, 12.40)
|
M35, M47, M59
|
|
Flooded (W)
|
7.14
(6.26, 8.13)
|
97.34
(95.08, 99.28)
|
98.43
(96.35, 100.22)
|
49.81
(40.53, 61.17)
|
10.71
(8.46, 13.49)
|
M31, M43, M55
|
|
(G3) M. sacchariflorus
|
Control (C)
|
6.24
(5.66, 6.88)
|
98.65
(97.12, 100.02)
|
98.07
(96.46, 99.49)
|
57.02
(49.36, 65.84)
|
12.16
(10.35, 14.25)
|
NA
|
|
Drought (D)
|
4.79
(4.16, 5.49)
|
95.96
(93.47, 98.10)
|
95.07
(92.42, 97.33)
|
31.38
(25.46, 38.62)
|
7.90
(6.19, 10.02)
|
NA
|
|
Flooded (W)
|
6.23
(5.45, 7.11)
|
97.76
(95.57, 99.64)
|
97.59
(95.37, 99.50)
|
57.43
(46.75, 70.49)
|
12.00
(9.50, 15.09)
|
NA
|
|
(G2) M. sinensis var. genotype-48
|
Control (C)
|
6.64
(6.02, 7.31)
|
98.15
(96.15, 99.57)
|
98.25
(96.67, 99.66)
|
50.80
(43.96, 58.67)
|
9.84
(8.36, 11.57)
|
M40, M52, M64
|
|
Drought (D)
|
6.46
(5.65, 7.36)
|
96.80
(94.44, 98.82)
|
96.25
(93.81, 98.35)
|
32.80
(26.62, 40.36)
|
8.12
(6.37, 10.29)
|
M36, M48, M60
|
|
Flooded (W)
|
6.83
(5.98, 7.78)
|
97.64
(95.43, 99.54)
|
96.37
(93.95, 98.45)
|
71.09
(57.92, 87.21)
|
13.78
(10.94, 17.29)
|
M32, M44, M56
|
|
(G4) M. x giganteus
|
Control (C)
|
6.16
(5.58, 6.79)
|
99.03
(97.54, 100.35)
|
98.41
(96.85, 99.80)
|
33.60
(28.72, 39.27)
|
6.41
(5.40, 7.59)
|
NA
|
|
Drought (D)
|
6.71
(5.87, 7.64)
|
97.11
(94.81, 99.08)
|
96.70
(94.33, 98.73)
|
26.48
(21.46, 32.62)
|
5.79
(4.48, 7.40)
|
NA
|
|
Flooded (W)
|
6.20
(5.42, 7.08)
|
96.15
(93.69, 98.29)
|
97.99
(95.84, 99.84)
|
41.41
(33.66, 50.89)
|
7.88
(6.17, 10.00)
|
NA
|
|
(G5) M. x giganteus cv. Illinois
|
Control (C)
|
5.89
(5.33, 6.50)
|
98.03
(96.42, 99.46)
|
97.84
(96.21, 99.29)
|
78.57
(68.07, 90.67)
|
15.75
(13.45, 18.42)
|
M41, M53, M65
|
|
Drought (D)
|
4.27
(3.70, 4.91)
|
96.50
(93.72, 98.83)
|
86.09
(81.96, 89.63)
|
35.54
(28.86, 43.71)
|
10.86
(8.58, 13.68)
|
M37, M49, M61
|
|
Flooded (W)
|
7.67
(6.73, 8.72)
|
96.19
(93.73, 98.29)
|
98.43
(96.35, 100.22)
|
77.32
(63.01, 94.83)
|
14.81
(11.77, 18.57)
|
M33, M45, M57
|
|
(G6) Miscanthus interspecific triploid hybrid (‘3n’)
|
Control (C)
|
5.89
(5.33, 6.49)
|
99.15
(97.68, 100.46)
|
98.88
(97.38, 100.22)
|
61.52
(53.27, 71.02)
|
15.58
(13.30, 18.21)
|
M42, M54, M66
|
|
Drought (D)
|
6.17
(5.39, 7.03)
|
97.76
(94.40, 98.79)
|
88.80
(84.55, 92.37)
|
32.68
(26.51, 40.21)
|
10.53
(8.31, 13.27)
|
M38, M50, M62
|
|
Flooded (W)
|
7.23
(6.34, 8.23)
|
96.59
(94.20, 98.64)
|
98.51
(96.44, 100.29)
|
82.27
(67.05, 100.89)
|
23.34
(18.66, 29.13)
|
M34, M46, M58
|
Relative water content (RWC): Significant effects (P<0.05) on RWC (logarithmic value), were observed for all contrasts in the experiment except for block effects and date x genotype treatment interaction (Table 1). RWC was recorded at two time points and significant reduction in RWC was observed at the second time point (Fig. 1). No significant difference in RWC was observed between control and flooded conditions at the second time point.
Fresh biomass weight: Highly significant effects (P<0.05) on fresh biomass weight (logarithmic value), were observed for all contrasts in the experiment (Table 1). Mean fresh biomass was higher in flooded conditions for genotypes Msin-G2, Msac-G3, Mxg-G4 and Hyb-G6 (Fig. 1 and Table 2). Mxg-G5 had the highest mean fresh weight both in control and drought conditions, and the second highest in flooded conditions after Hyb-G6.
Dry biomass weight: Highly significant effects (P<0.01) for dry biomass weight (logarithmic value) were observed for all contrasts in the experiment (Table 1). As was observed for fresh biomass weight, dry biomass was significantly reduced under drought conditions. Mxg-G5 had the highest mean dry biomass both in control and drought conditions (Fig. 1 and Table 2).
RNA-seq analysis under water stress
Four genotypes (Msac-G1, Msin-G2, Mxg-G5 and Hyb-G6) were selected because of sequencing budget constraints by discarding one of the two genotypes from the same species. Genotypes were sampled towards the end of the experiment and sequenced in 2014. The number of raw reads from each library ranged from 16.9M to 42.4M, and total of 945.2M reads were obtained in total (Suppl. Table S2). After filtering out adaptor sequences and ambiguous and low-quality reads, clean reads totalled 926.8M for all samples. Alignment and mapping summary for each library is presented in Suppl. Table S2 and read counts per gene in Suppl. Table S3.
When the normalised counts (Suppl. Table S4) were used to cluster the samples (Fig. 2), the samples clustered firstly by species (PC1: 30% variance) and later by condition (PC2: 21% variance). Msac-G1 and the Hyb-G6 clustered together and separated from Msin-G2 and Mxg-G5, which clustered together to each other. However, differences resulting from the treatment were only observed for drought samples. Control and flooded samples clustered together and away from drought samples, except for one drought sample (M48) from Msin-G2, which was discarded from down-stream analysis (Fig. 2).
Effects of drought on Miscanthus transcriptomes
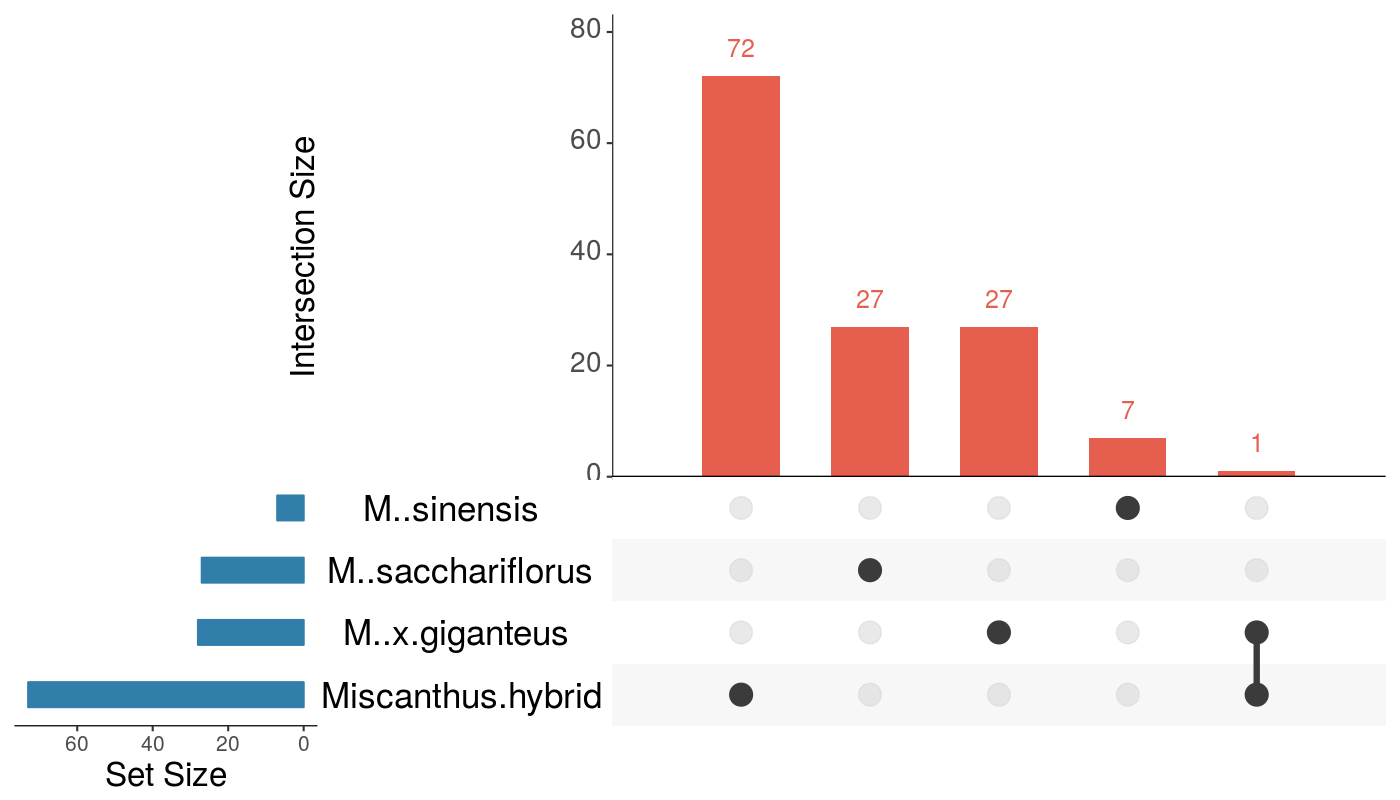
A total of 4,389 of the 67,789 genes (6.4%) in the reference genome were significantly differentially expressed in total (Fig. 3 and Suppl. Table S5). The highest number of DEGs was observed in Mxg-G5 (2,353) and the lowest in Msin-G2 (773). The UpSet diagram highlights shared DEGs among the four Miscanthus species under drought situation (Fig. 3). Only 67 DEGs were shared by all four genotypes. On the contrary, 3,232 of the 4,389 DEGs (73.3%) were differentially expressed in a single genotype. On the other hand, only 134 differentially expressed genes were detected in flooded against control conditions and none of those were shared among all genotypes (Suppl. Fig. S2 and Suppl. Table S6).
Enriched Gene Ontology (GO) terms in DEGs during drought
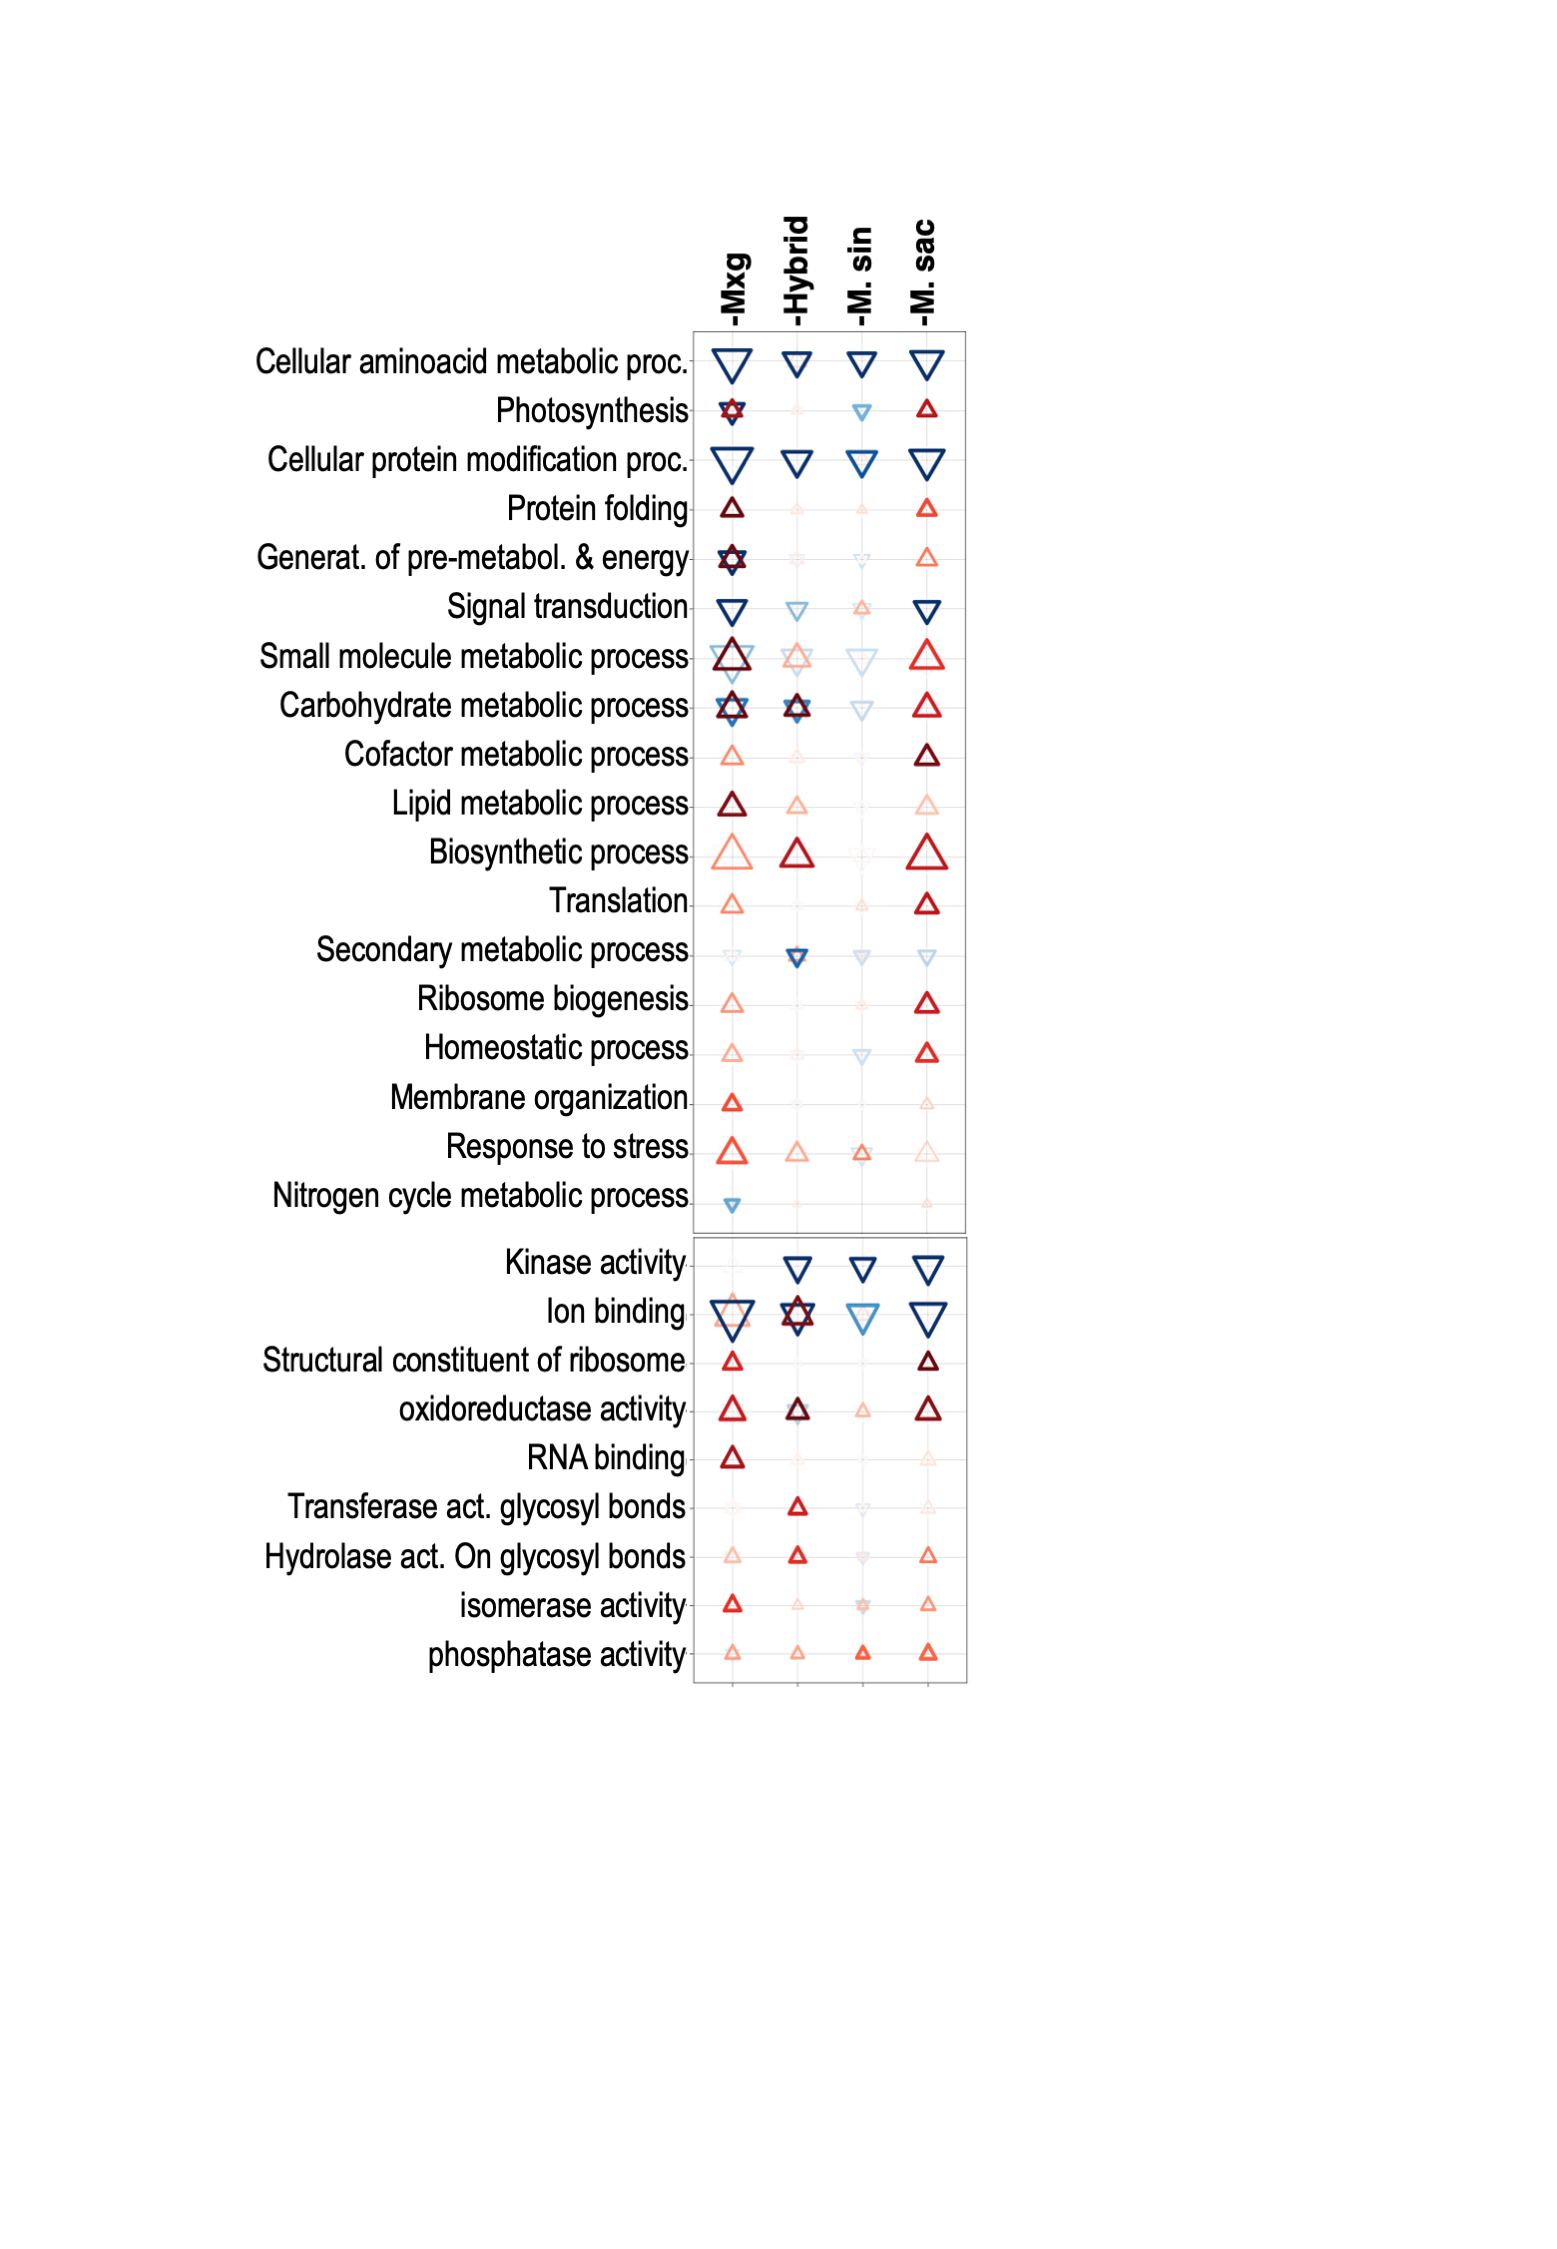
Enrichment analysis of GO terms over-represented among DE genes allowed us to identify the biological processes (BP) and molecular functions (MF) that are regulated in each genotype during drought. Firstly, we annotated the reference transcriptome with GO and GO-SLIM terms (Suppl. Table S7). The same biological processes were regulated in all the genotypes in the same direction (either up- or down-regulated) and by a similar-enough number of DEGs (Suppl. Tables S8 and S9). This is also evidenced by the similar shape sizes (number of genes), colours (red for up-regulation and blue for down-regulation) and intensities (darker for lower p-values) in Fig 4.
Downregulated differentially expressed genes were significantly enriched in GO terms involved in protein phosphorylation and kinase activity, cell receptor signalling, amino acid metabolism, and ion binding; while upregulated differentially expressed genes were significantly enriched in GO terms involved in sucrose and starch metabolism, redox, and water and glycerol homeostasis and channel activity (Fig. 4). DE genes in these functional categories were functional annotated (Suppl. Table S10). Relevant functions (water homeostasis and channelling, and starch and sucrose synthesis) were further characterised in the next result sections.
A similar analysis on the enriched “GO slim” terms among DEGs during drought highlighted broader GO terms in the similar functions than the previous analysis (Suppl. Fig.3).
Candidate genes involved in starch and sucrose synthesis and degradation
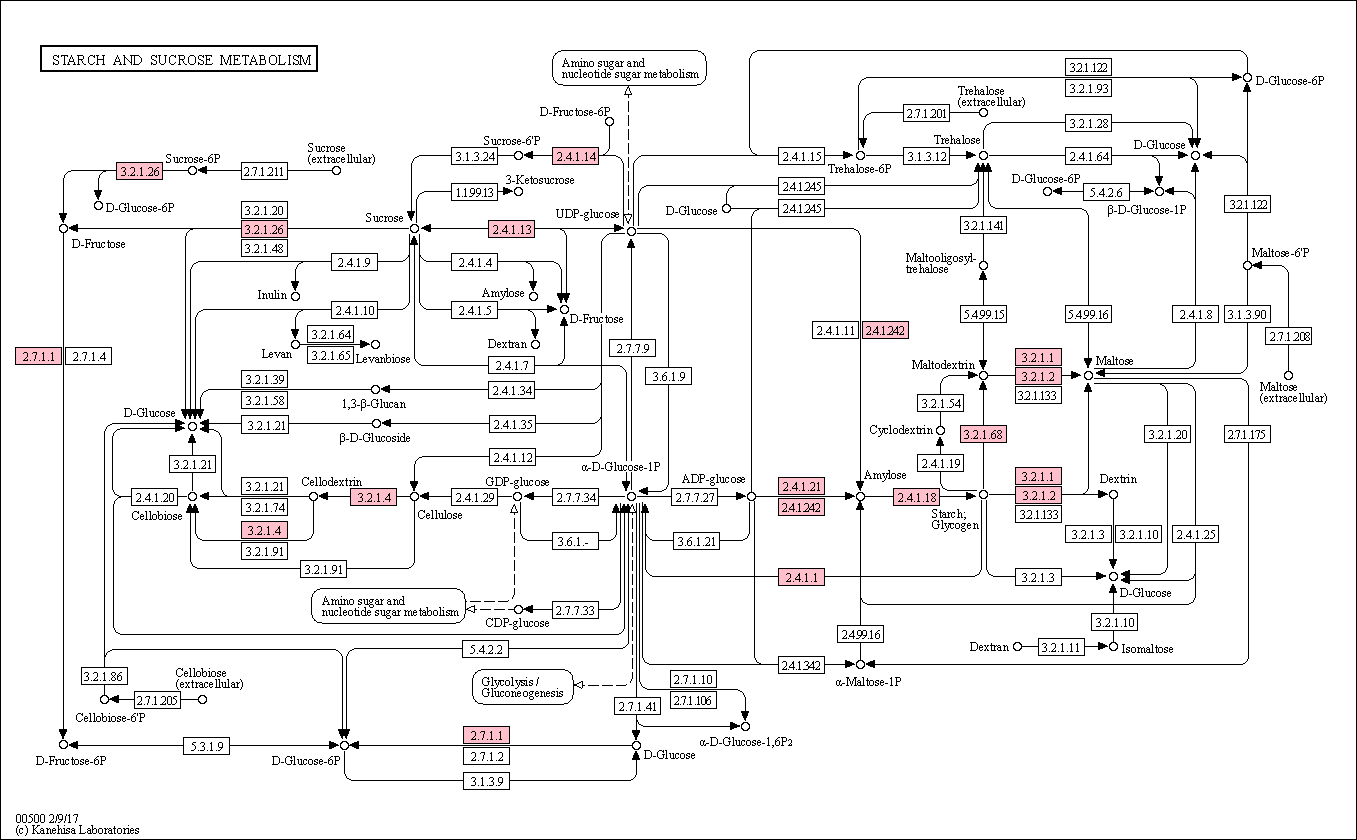
We observed a cluster of three related GO terms (“sucrose metabolism”, “starch metabolism” and “polysaccharide catabolism”), which was up-regulated with strong p-values during drought stress and contained a similar number of genes among genotypes (dotted box in Fig. 4). However, sucrose metabolism was not enriched in Mxg-G5 and none of these GO terms was enriched in Msin-G2 (most enriched GO terms were not enriched in Msin-G2, Fig. 4). The cluster of related GO terms included 53 DEG in total (Suppl. Table S11). Thirty-five of these genes could be mapped to reactions in the starch and sucrose KEGG pathways (Suppl. Fig. 4).
Twelve genes were involved in the direct degradation of starch to maltose (Enzymatic codes -EC- 3.2.1.1, 3.2.1.2, and 3.2.1.68). Ten genes were homologous to BAM1 (Suppl. Table S11; EC 3.2.1.2) and highly up-regulated with 3.4-8.9 fold-change expressions (FC), six of them were common among the genotypes. Involved in the same process, AMY3 (T282800; EC 3.2.1.1) had a low 1-1.3 fold-change expression (FC), and ISA3 (4G215400; EC 3.2.1.68) was weakly up-regulated among the genotypes (0.2-1 FC). On the other hand, two DE glycogen phosphorylase genes were involved in the first step of the degradation of starch in glucose (2.4.1.1), but only one (1G063200) was up-regulated in Mxg-G5 (3.1 FC) and less so in the new interspecific triploid hybrid (1.6 FC) and Msac-G1 (0.7 FC). The related SEX1 gene (18G152900; EC 2.7.9.4) showed a very similar expression pattern; more strongly up-regulated in Mxg-G5 (2.4 FC) than in Hyb-G6 (1.3 FC) or Msac-G1 (0.8 FC).
Concerning starch biosynthesis, waxy gene GBSS-I (19G002300), which synthetises amylose -a starch precursor-, showed very high up-regulation in Msac-G1 (11.9 FC), Mxg-G5 (8.8 FC) and Hyb-G6 (9.3 FC). Two genes involved in the ADP-glucose to starch synthesis, SS3 (T393000; EC 2.4.1.21) and BE1 (5G197100; EC 2.4.1.21) were moderately up-regulated in these three genotypes (1.4-2.3 FC and 0.51-1.8 FC, respectively). SUS3 (1G358800; EC 2.4.1.13) and two genes encoding SPS1F (16G229500 and 17G242300; 2.4.1.14), which are involved in the last steps of sucrose synthesis, were up-regulated in all genotypes. SUS3 fold-change expression was 1.8-2.6 FC, while SPS1F was 0.52-1.3 FC.
Five cellulose synthase genes involved in secondary cell wall biosynthesis (CESA4 and IRX1/3, Suppl. Table S11; EC 2.4.1.12) were strongly up-regulated in Mxg-G5 (5.2-10.4 FC), two were also strongly up-regulated in Mxg-G5 and Hyb-G6 (4.7 and 9.2 FC), but none was in the other genotypes. One glycosyl hydrolase 9B5 (GH9B5) involved in cellulose degradation (3G236400; EC 3.2.1.4) was up-regulated in Msac-G1 and Hyb-G6 (2 and 1.7 FC, respectively), but highly up-regulated in Mxg-G6 (3.7 FC).
Candidate genes involved in water homeostasis and channelling
We observed a cluster of five related GO terms (“cellular water homeostasis”, “water channel activity”, “water transport”, “glycerol transport”, and “glycerol channel activity”), which was up-regulated with strong p-values during drought stress and contained a similar number of genes among genotypes (dotted box in Fig. 4). Within these GO terms in any genotype, there were thirteen genes in total, twelve of them were aquaporins, and one (18G085200) was homologous to the LRR kinase EREC1/TE1 (“Transpiration efficiency 1”; Suppl. Table S12).
Using rice as a reference, three aquaporins were homologous to PIP2-1 (3G107200), PIP2-2 (7G413400), and PIP2-7 (4G263800). PIP2-7 was lowly up-regulated in all genotypes (0.2-1 FC), while PIP2-2 was only up-regulated in Mxg-G6 (3.6 FC), and PIP2-1 was up-regulated in Msac-G1 too (1.2-1.6 FC). Four aquaporins were homologous to PIP1; The homologous genes to PIP1-1 (7G437200) and PIP1-3 (7G548500) were clear, and two additional genes (8G232800 and 12G174400) were homologous to other PIP1 proteins. PIP1-3 (7G548500) was strongly up-regulated in Msac-G1 (5.3 FC), Mxg-G5 (3.7 FC) and Hyb-G6 (7.3 FC). NIP2 (7G481100) was highly up-regulated in all genotypes (1.84-2.7 FC) and LRR kinase ER1 (EC 2.7.11.1; ERECTA homolog 1) was only DE in Mxg-G5 with a low up-regulation (0.2 FC). Four aquaporins had not characterised homologous (1G219200, 3G326300, 8G270100, T569700). The uncharacterised Aquaporin 3G326300 was strongly up-regulated in Msac-G1 (7.7 FC) alone, but was wholly absent in the triploid hybrid. The uncharacterised aquaporin 1G219200 was only up-regulated in Mxg-G5 (4.7 FC). All thirteen genes were highly up-regulated in Mxg-G5, but only half of them were in Msac-G1 and Hyb-G6 (Suppl. Table S11).