Mice
C57BL/6 male mice aged 6–8 weeks (each weighing 19–22 g) were purchased from Cavins Experimental Animals Co., Ltd. (Changzhou, China; No. 201911131). They were fed at a specific-free level in the Experimental Animal Center at Jiangsu University. Animal experiments were conducted in accordance with the Guidelines for the Care and Use of Laboratory Animals and approved by the Animal Research Ethics Committee of Jiangsu University (UJS-LEAR-AP-2018030601).
Peptides
S. japonicum peptide SJMHE1 was synthesized and purified by ChinaPeptides (Shanghai, China) as described previously [14, 15, 16]. The peptide was detected through high-performance liquid chromatography with a purity of more than 98% and stored at −80 °C.
Experimental colitis induction via DSS and SJMHE1 treatment
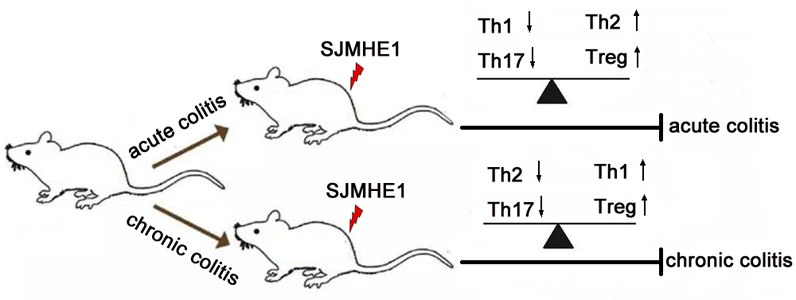
Male C57BL/6 mice were randomly divided into four groups: normal, DSS, DSS/PBS, and DSS/SJMHE1 groups. For acute colitis, the mice were drunk with 2.5% DSS (molecular weight of 36–50 kDa; MP Biomedicals, USA) solution continuously for 10 days in accordance with a previously described method [22]. The mice in the DSS/SJMHE1 and DSS/PBS groups were subcutaneously injected with 0.1ml emulsifier SJMHE1 (10 µg) or PBS with incomplete Freund’s adjuvant (IFA, Sigma, Poole, UK) on days 0 and 7, respectively. For chronic colitis, the mice were drunk with 2% DSS solution on days 0–5, 10–15, and 20–25 as described previously[22]. In the DSS/SJMHE1 and DSS/PBS groups, the mice were treated with 0.1ml emulsifier SJMHE1 (10 µg) or PBS with IFA on days 0, 14, and 28, respectively. During treatment, the mice were monitored daily for fecal traits, blood in stool, and weight change. The disease activity index (DAI) was calculated in accordance with the scoring criteria of Holger Sann [22]. Then, the mice were anesthetized and killed to evaluate the length and inflammation of the colon.
Histopathologic analysis
Colon tissue segments (about 0.5 cm) were collected and fixed with a formalin solution at room temperature for 2 days. Then, these segments were dehydrated, embedded in paraffin, sectioned, and stained with hematoxylin and eosin (H&E). The pathological changes and inflammation of colon tissues were assessed using a standard histopathological score as previously described [45].
Flow cytometry analysis
The spleen and mesenteric lymph nodes (MLNs) were aseptically separated, and single cell suspension was prepared as described previously [14, 15, 16]. Single-cell suspensions from the spleen and MLNs were stimulated with a brefeldin/monensin mixture (Brefeldin A, Multisciences) and a phorbol-12-myristate-13-acetate/ionomycin mixture (Multisciences) for 5 h. FITC-anti-mouse-CD4 (eBioscience) was used for surface staining. APC-anti-mouse-IFN-γ (eBioscience), APC-anti-mouse-IL-4 (Biolegend), and PE-anti-mouse-IL-17A (Biolegend) were utilized for intracellular staining after the membrane was ruptured with fixation/permeabilization (BD Biosciences) to analyze Th1, Th2, and Th17 cells as described previously[16, 46]. Mononuclear cells were stained with FITC-anti-mouse-CD4, APC-anti-mouse-CD25, and PE-anti-mouse Foxp3 by using a mouse regulatory T cell staining kit (eBioscience) to evaluate Treg cells. All the samples were detected with a BD FACSCcanto flow cytometer (BD Biosciences), and data were analyzed with Flowjo v10.0.7 (Tree Star, Ashland, OR, USA).
RNA extraction and quantitative RT-PCR (qRT-PCR)
Total RNA was extracted from the spleen cells by using a Trizol reagent (Invitrogen, CA, USA). First-strand cDNA was synthesized with a reverse transcription kit (GeneCopoeia, Germantown, MD, USA). RNA was isolated from the colon tissue by using a tissue RNA purification kit Plus (Yishan Biological Technology, Shanghai, China). The cDNA of mRNA was synthesized with a reverse transcription kit (TakaRa, Tokyo, Japan). All-in-oneTM qPCR primer sets for IFN-γ (Cat. No. MQP027401), IL-4 (Cat. No. MQP032451), IL-17A (Cat. No. MQP029457), IL-10 (Cat. No. MQP029453), TGF-β (Cat. No. MQP030343), IL-35 (Cat. No. MQP027412), and GAPDH (Cat. No. MQP027158) were obtained from GeneCopoeia. The PCR amplification and calculation of the relative mRNA expression were based on previously described methods [16, 46].
Statistical analysis
Data were expressed as mean ± SEM, and statistical significance was analyzed through one-way ANOVA followed by Dunn’s multiple comparison with GraphPad Prism 8.0.0 (GraphPad, USA). Data with P < 0.05 were considered statistically significant.