Citrus husbandry
All of the plant materials were produced and purchased from commercial Southern Citrus Nurseries, Dundee, Florida in August of 2017. Plants used in experiments were 2-yr old uninfected [Candidatus Liberibacter asiaticus (CLas)-free] Citrus sinensis L. Osbeck cv Valencia grafted onto US-812 rootstocks (52), After two months, citrus plants were transplanted into new plastic pots (19.69 x 45.7 cm) and filled with a Fafard citrus RSI soil mix containing Canadian sphagnum peat moss, perlite, vermiculite, dolomitic limestone, RSI and Pluronic (Sungro, Horticulture Distribution, Inc., WA, USA). Plants were repositioned into growth chambers and maintained under the following conditions: 23 ± 3 °C, 60RH, and a 16:8 h (Light: Dark) photoperiod with a maximum photosynthetic radiation of 215 µmol s-1 m-2. Plants were watered twice per week, and fertilized twice per month with an alternating schedule of a 24-8-16 NPK solution at 4 g L-1 (Miracle-Gro All Purpose Plant Food; Scotts Miracle-Gro Products, Marysville, OH) and a 6-4-6 (N–P–K) granular fertilizer at 1 g per pot (Expert gardener Gro Tec. Inc. Madison, GA).
Insect rearing
The CLas-free D. citri used in this study were reared on 3-4 yr. old Citrus sinensis cv Valencia trees maintained in a greenhouse at 26 ± 2 °C, 60-65% RH, and a 16:8 h (Light: Dark) photoperiod. Before initiating experiments, the presence/absence of CLas was examined in at least 40 D. citri individuals to confirm the lack of infection using TaqMan qPCR.
DNA extraction and CLas detection by TaqMan qPCR assay
Genomic DNA from single insects was isolated using the DNeasy blood and tissue kit (Qiagen Inc, Valencia, CA), following the manufacturer’s protocol. Quantity and purity of DNA samples were measured on a Nanodrop 2000 Spectrophotometer (Thermo fisher Scientific, Waltham, MA). Genomic DNA of CLas was detected using previously described target probes for CLas-specific 16S rDNA and an internal control sequence (gene region) for D. citri (Wingless) (53). DNA amplifications were conducted in ABI 7500 qPCR system (Applied Biosystems, Foster City, CA) using 96-well MicroAmp reaction plates (Applied Biosystems). Each TaqMan qPCR reaction was achieved using 100 ng of genomic DNA, 100 nM of each dual-specific labeled probe-primer sets, TaqMan® Universal PCR Master Mix (Applied Biosystems) and adjusted to a final volume of 20 µL with molecular grade pure water. The conditions used for TaqMan assays consisted of: an incubation at 50°C for 2 min, a polymerase activation step at 95°C for 10 min, followed by 40 cycles at 95°C for 15 sec and 60°C for 60 sec. Each 96-well plate contained samples including a ‘no template’ control, a positive control (CLas-infected samples), negative control (CLas-uninfected samples). Reactions were performed in duplicates and considered positive for target sequences if the cycle quantification (Cq) value, determined by the ABI 7500 Real-Time software (version 1.4, Applied Biosystems), was ≤ 36 cycles.
Bioinformatic analyses
Selection of genes. In order to analyze the expression pattern of genes involved in SA modification and SA-dependent defense signaling pathway in C. sinensis L. Osbeck cv Valencia, six homologous transcripts present in A. thaliana were selected from the NCBI database as follows: Methylesterase 1 (MES1, Accession number NM_127926), 2-oxoglutarate (2OG) and Fe(II)-dependent oxygenase (Accession number NM_117118) annotated and described by Zhang, Halitschke (25) as a salicylic acid 3-hydroxylase (S3H or DMR6), S-adenosyl-L-methionine-dependent methyltransferases (BSMT1, Accession number NM_111981), UDP-glucosyltransferase 74F2 (UGT74F2, Accession number NM_129944), Non-expressor of Pathogenesis Related genes 1 (NPR1, Accession number NM_105102), and Pathogenesis-related protein 1 (PR-1, Accession number NM_127025). A search using the BlastX algorithm allowed us to find homologs to each transcript within the C. sinensis genome (BioProject: PRJNA225998). Specific primers for each target gene (Table 1) were designed in Primer3 web (54).
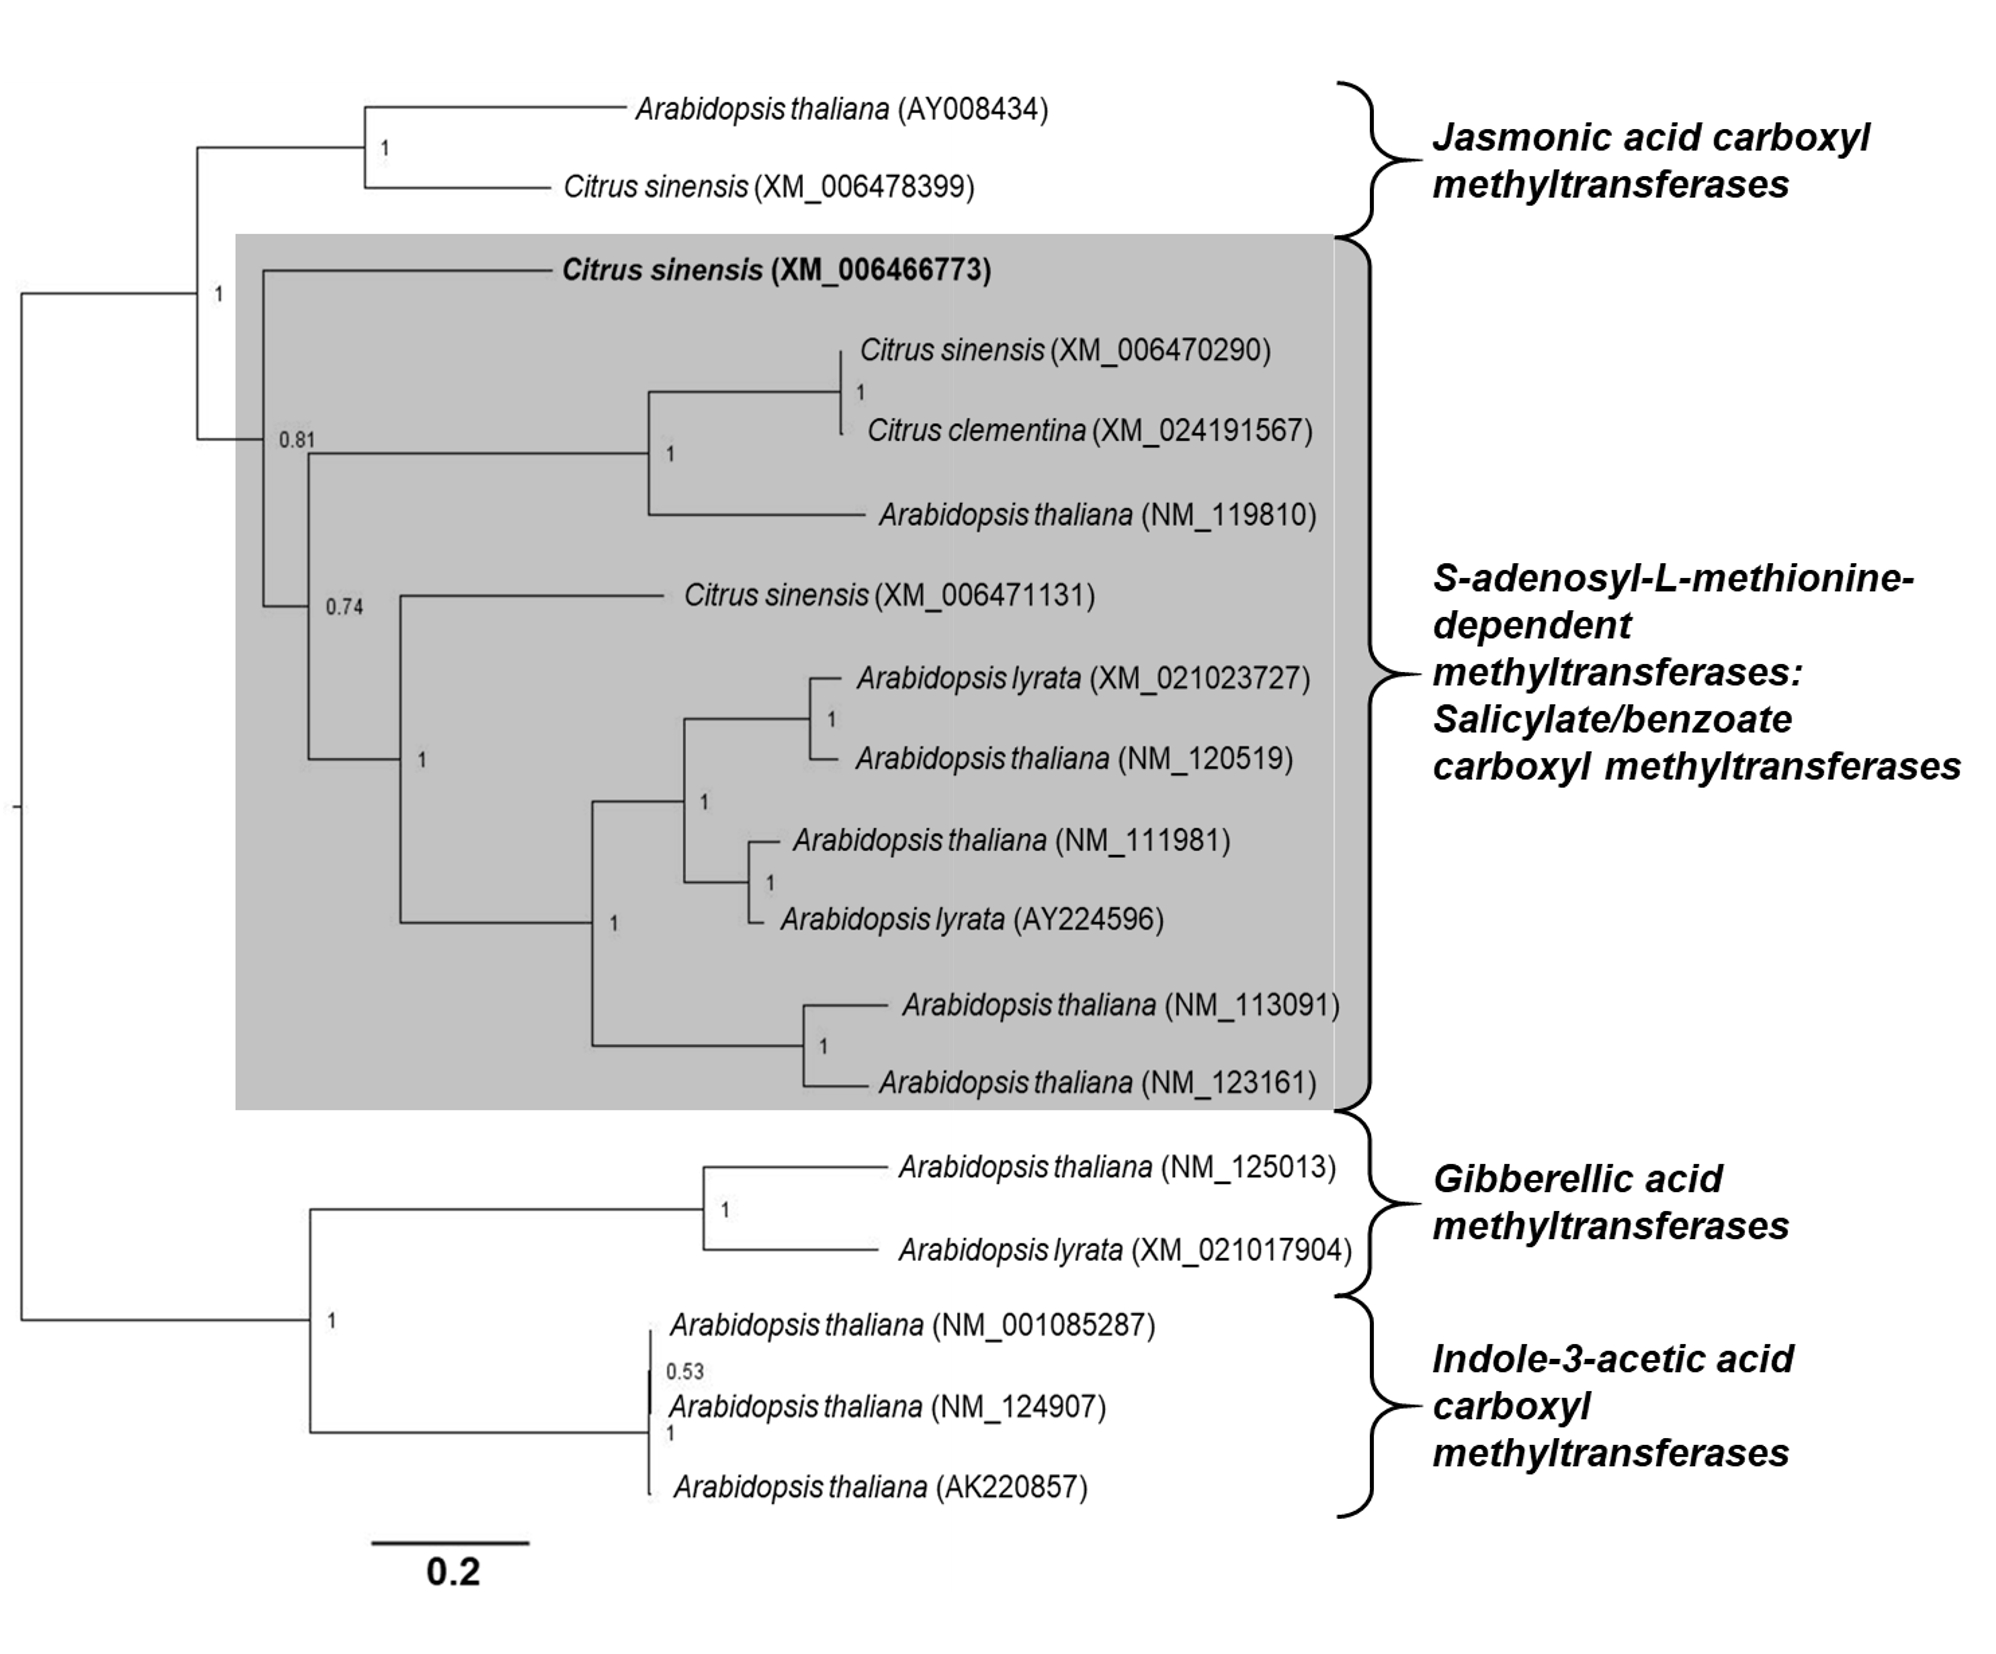
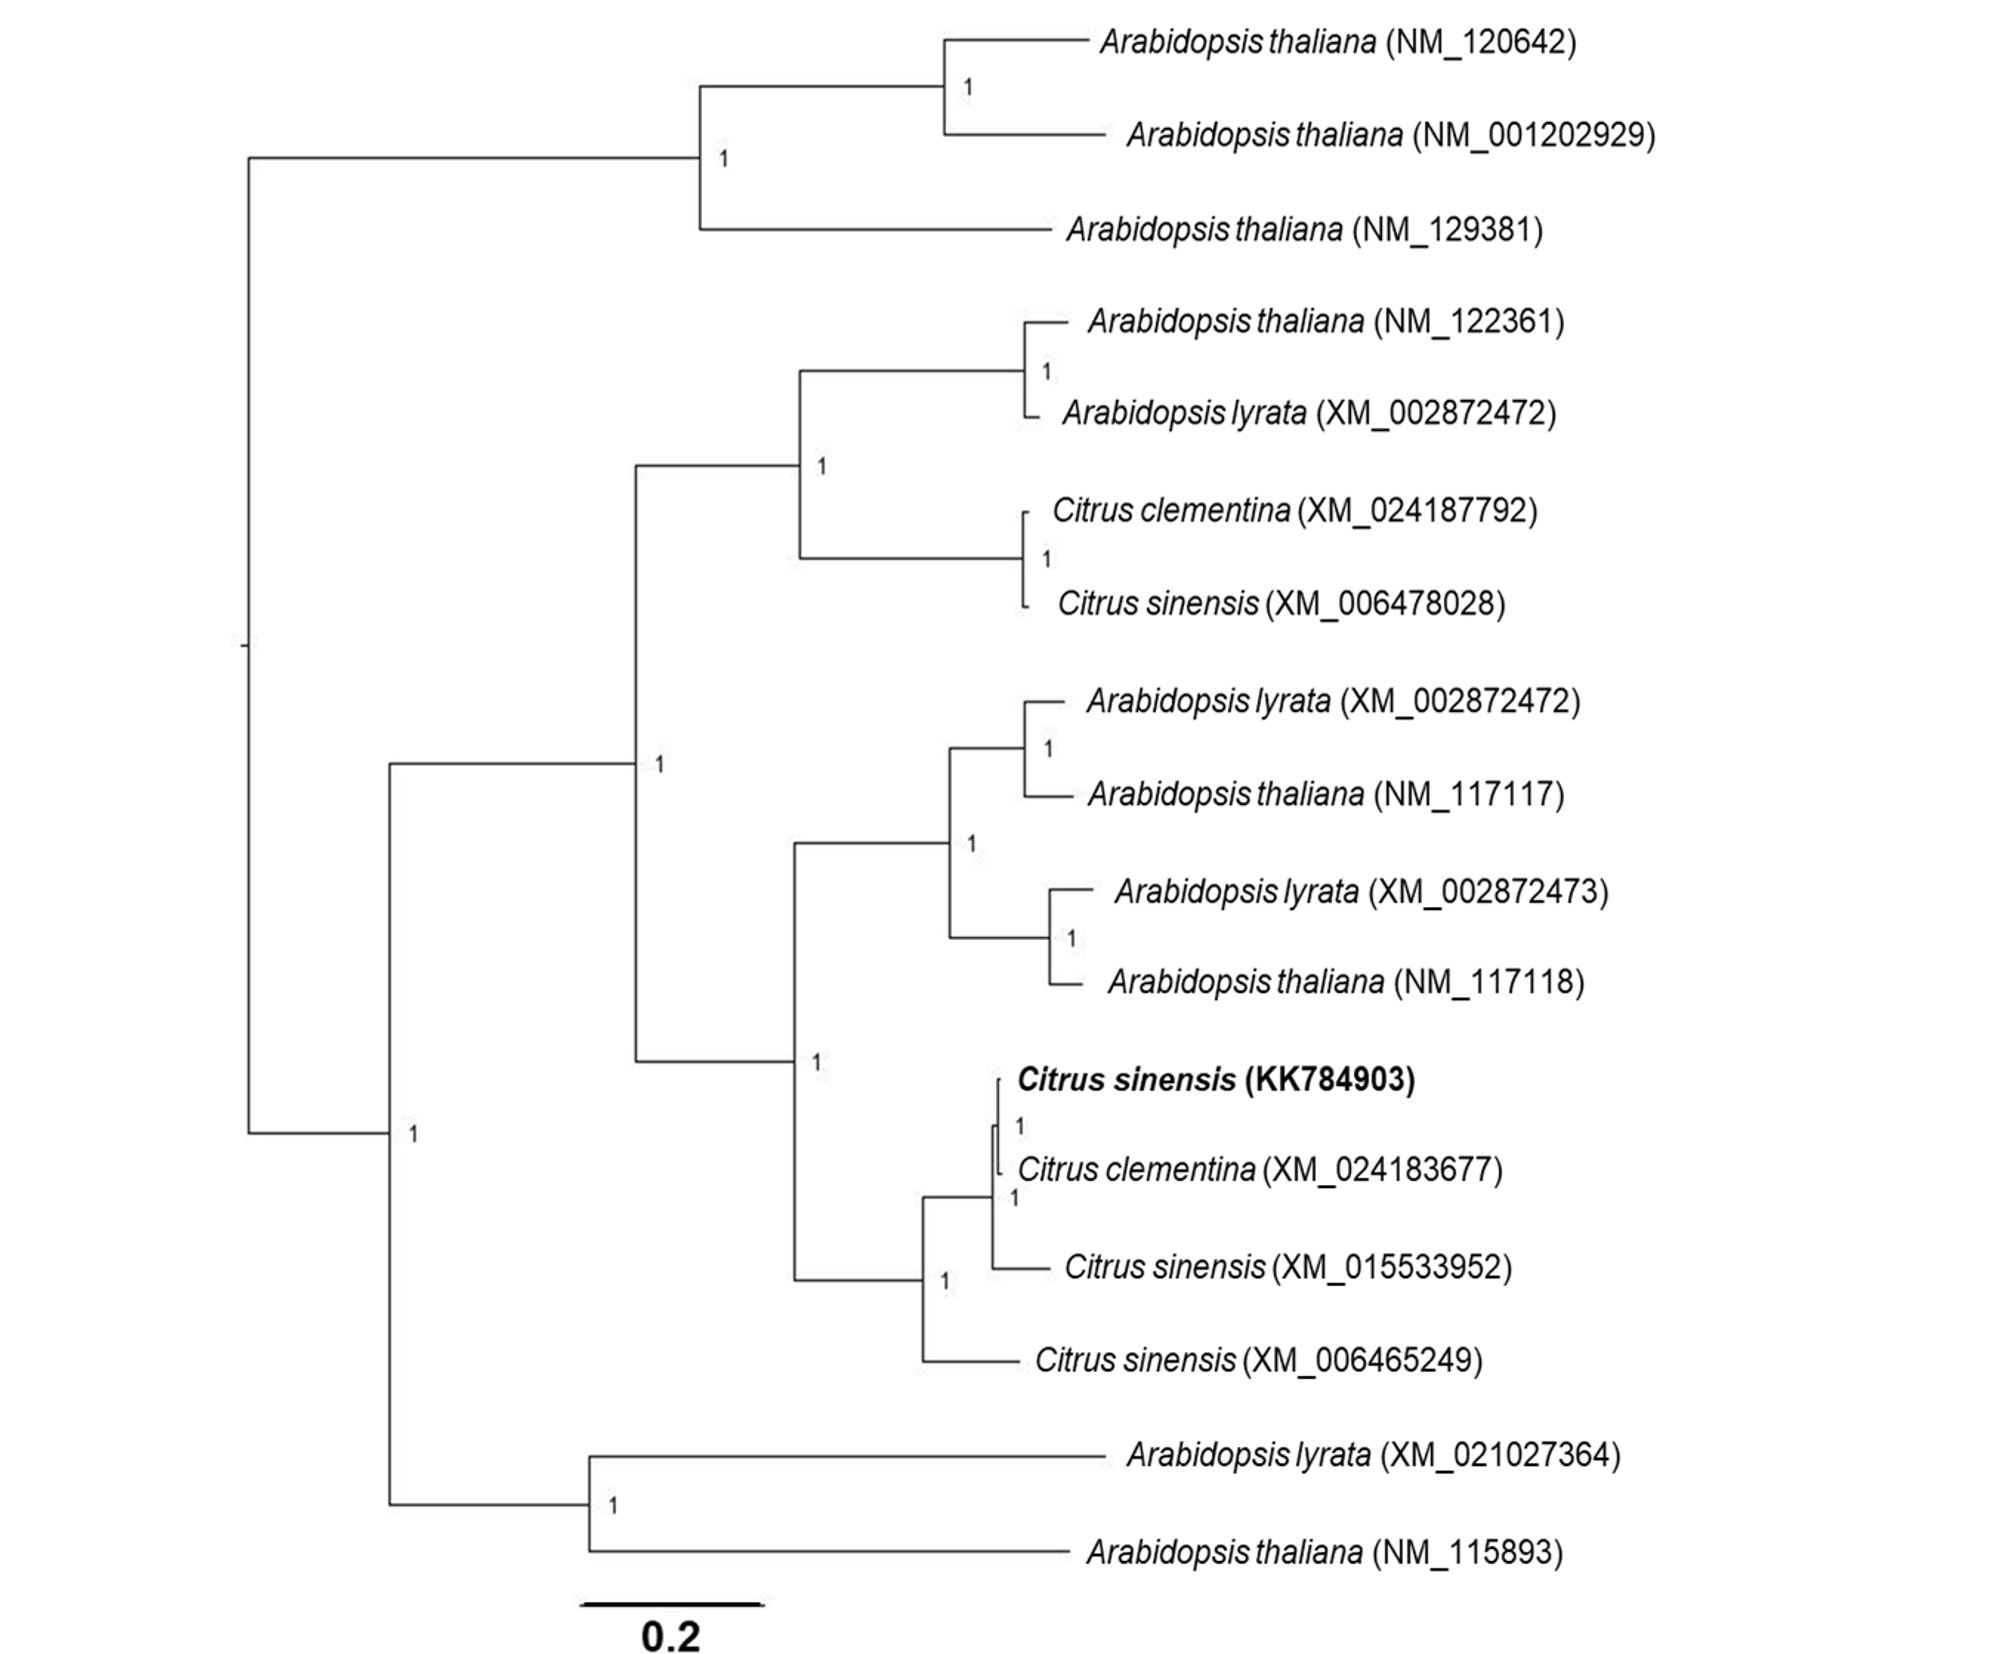
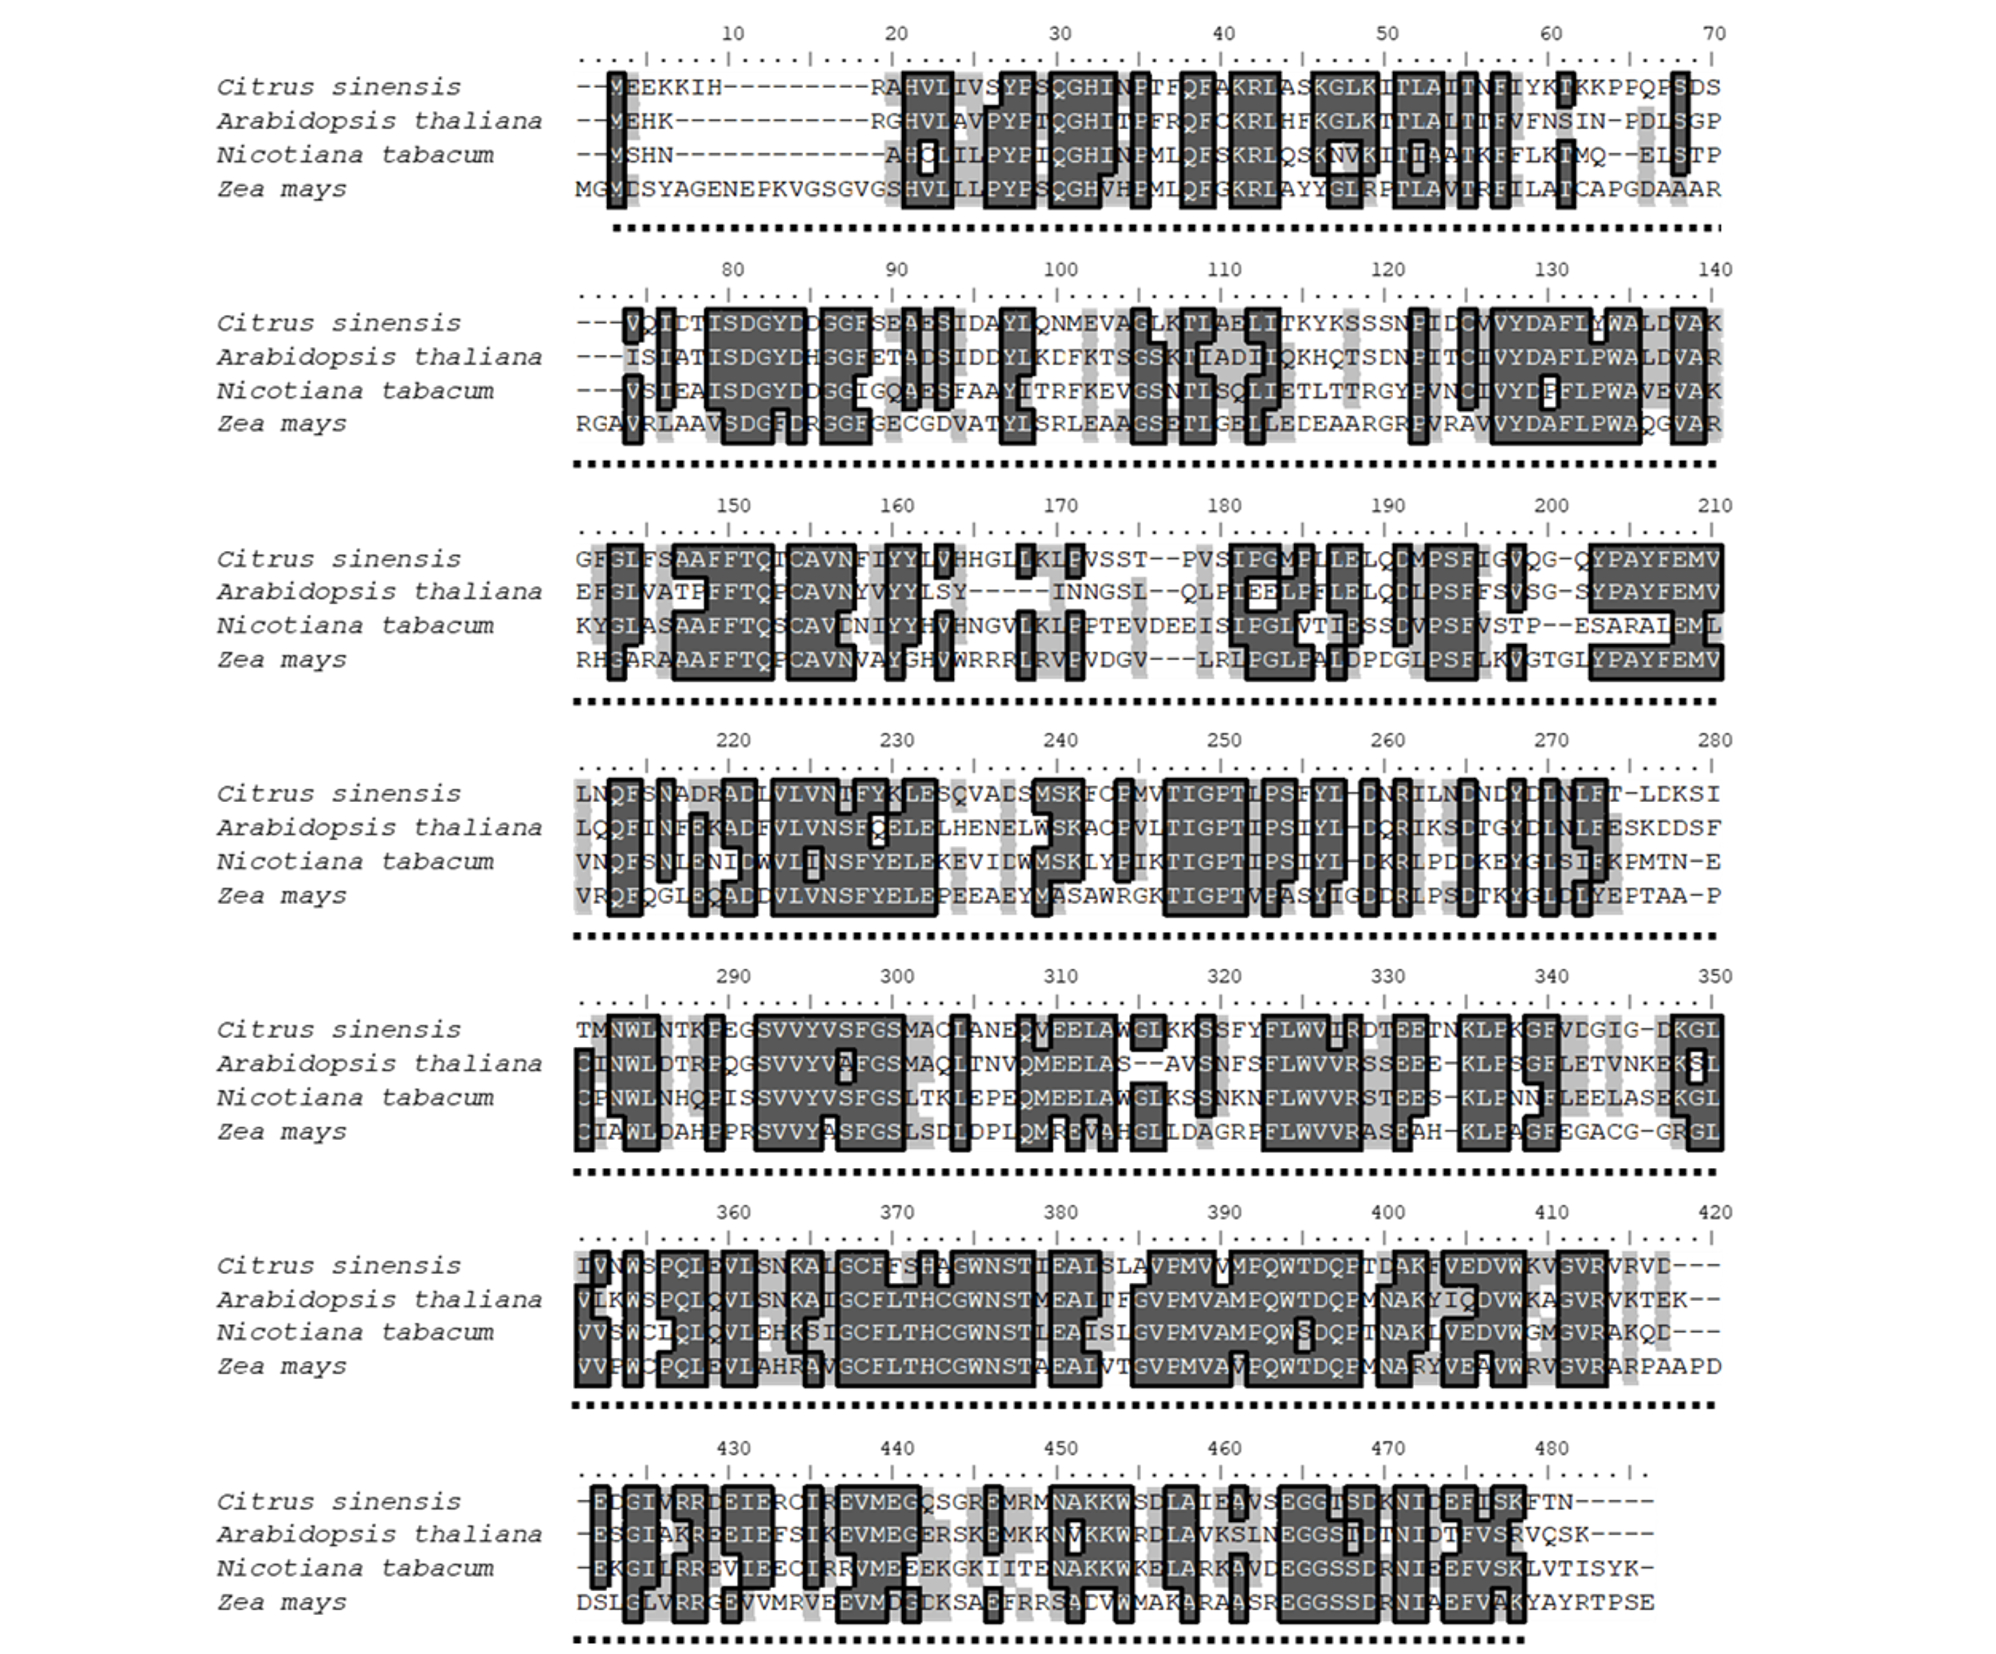
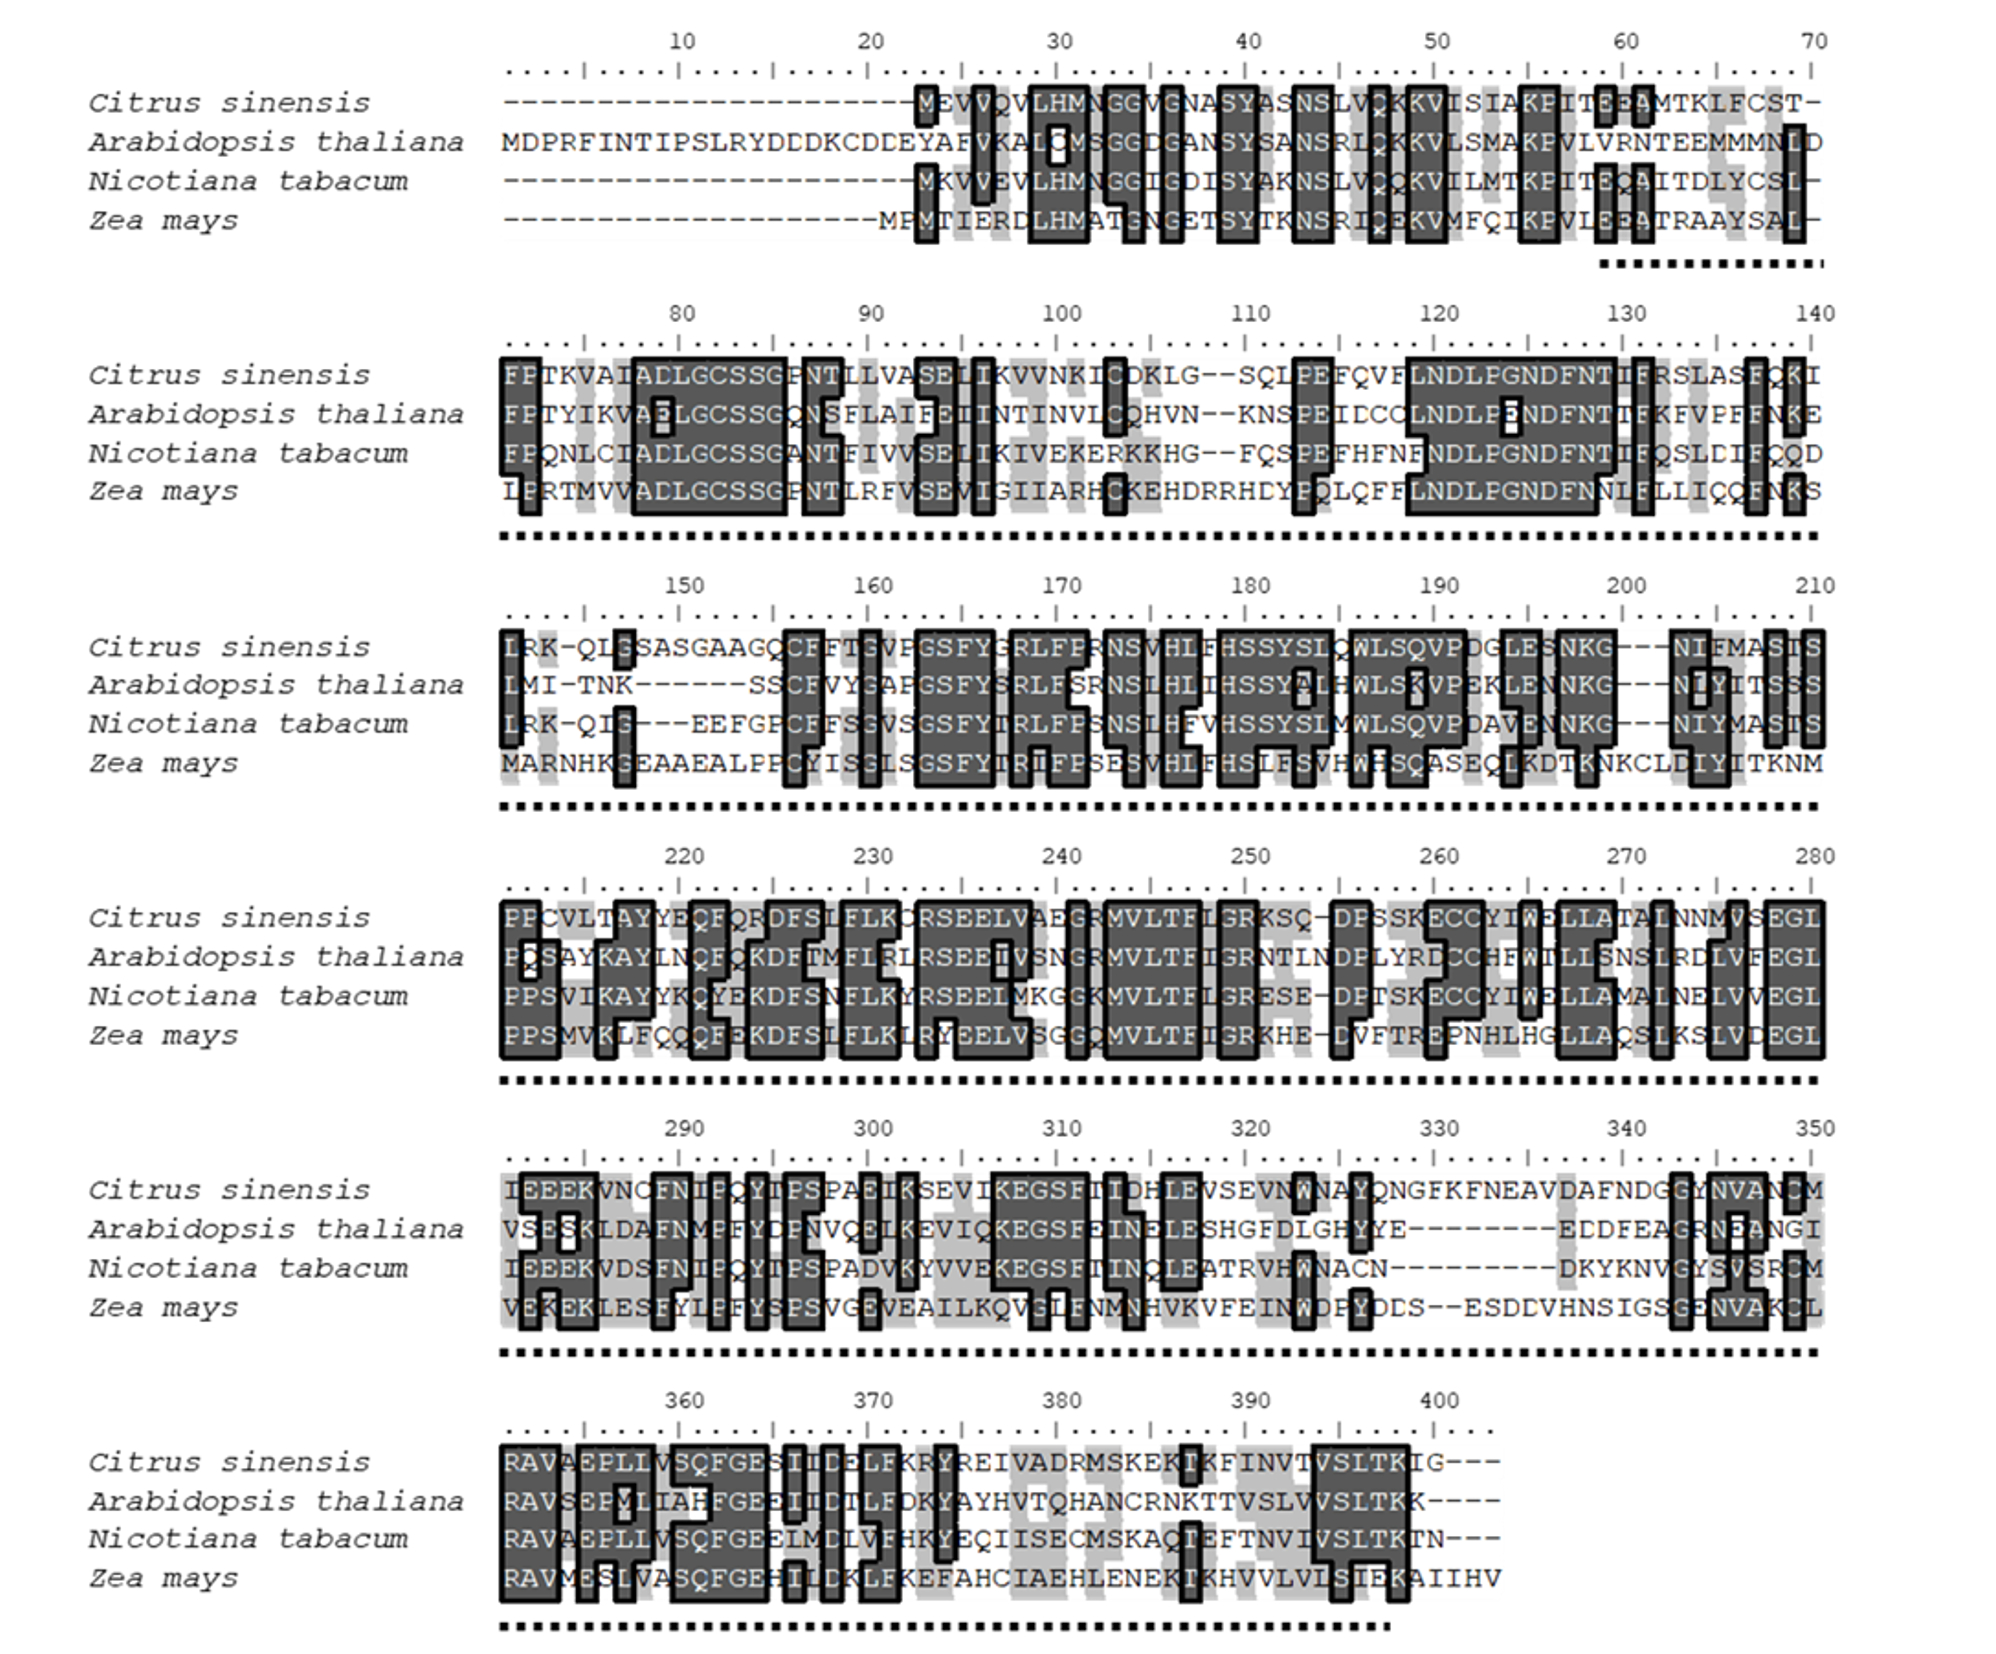
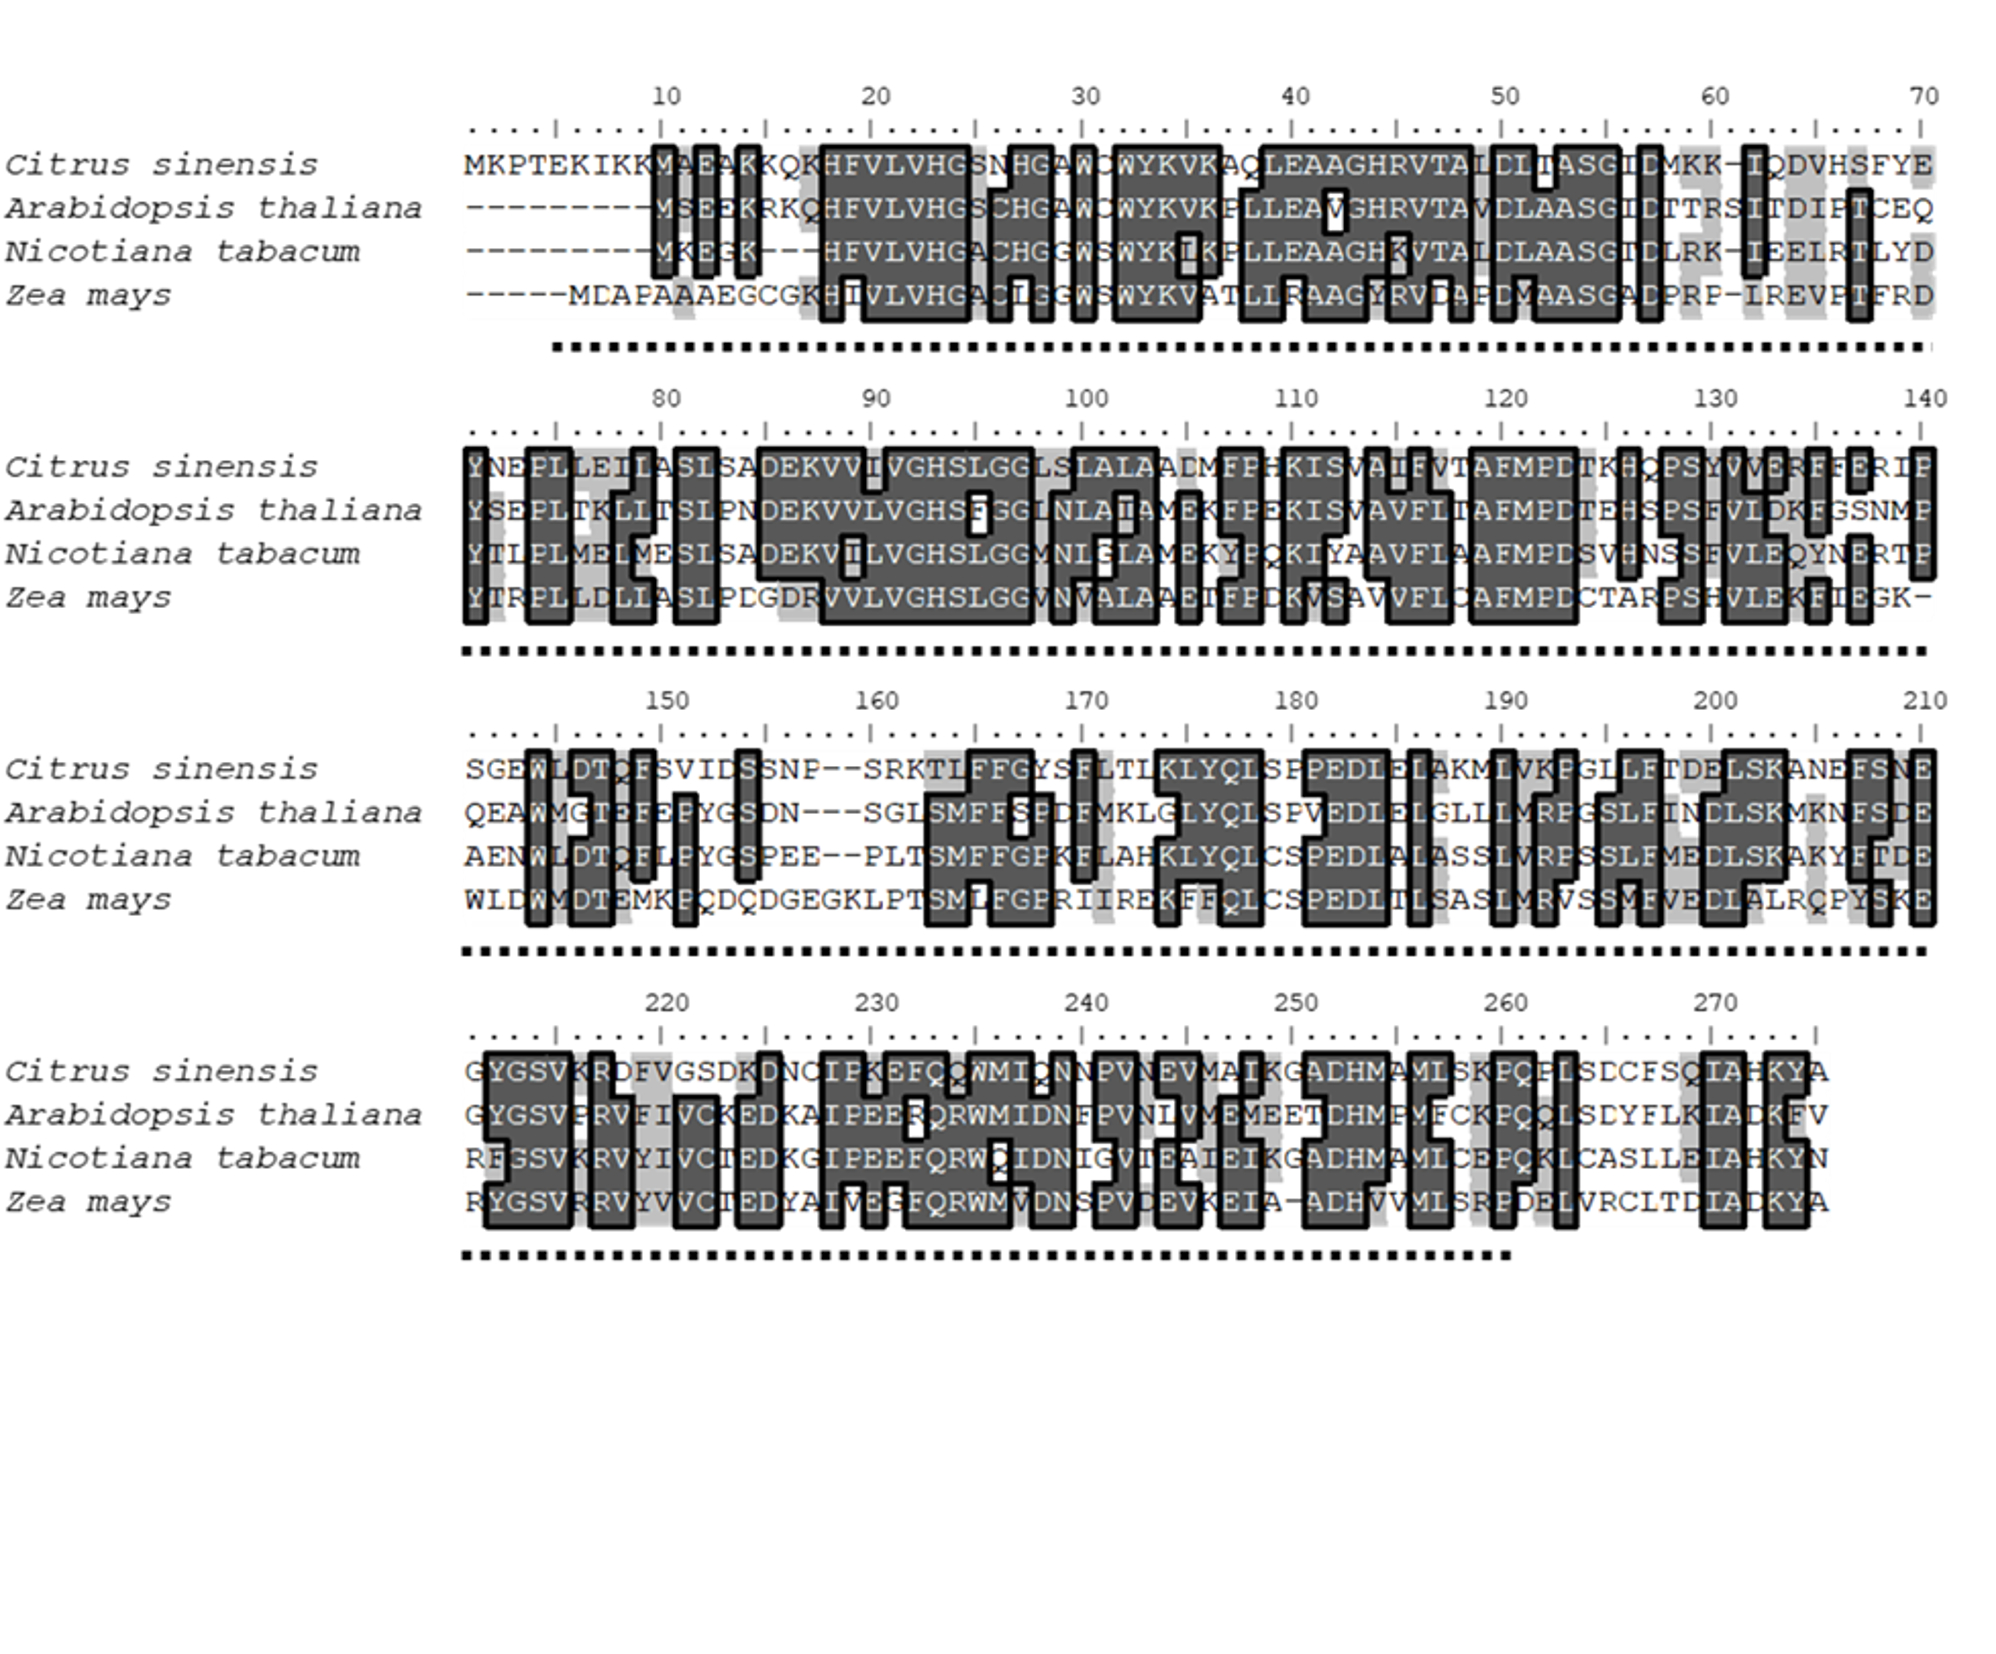
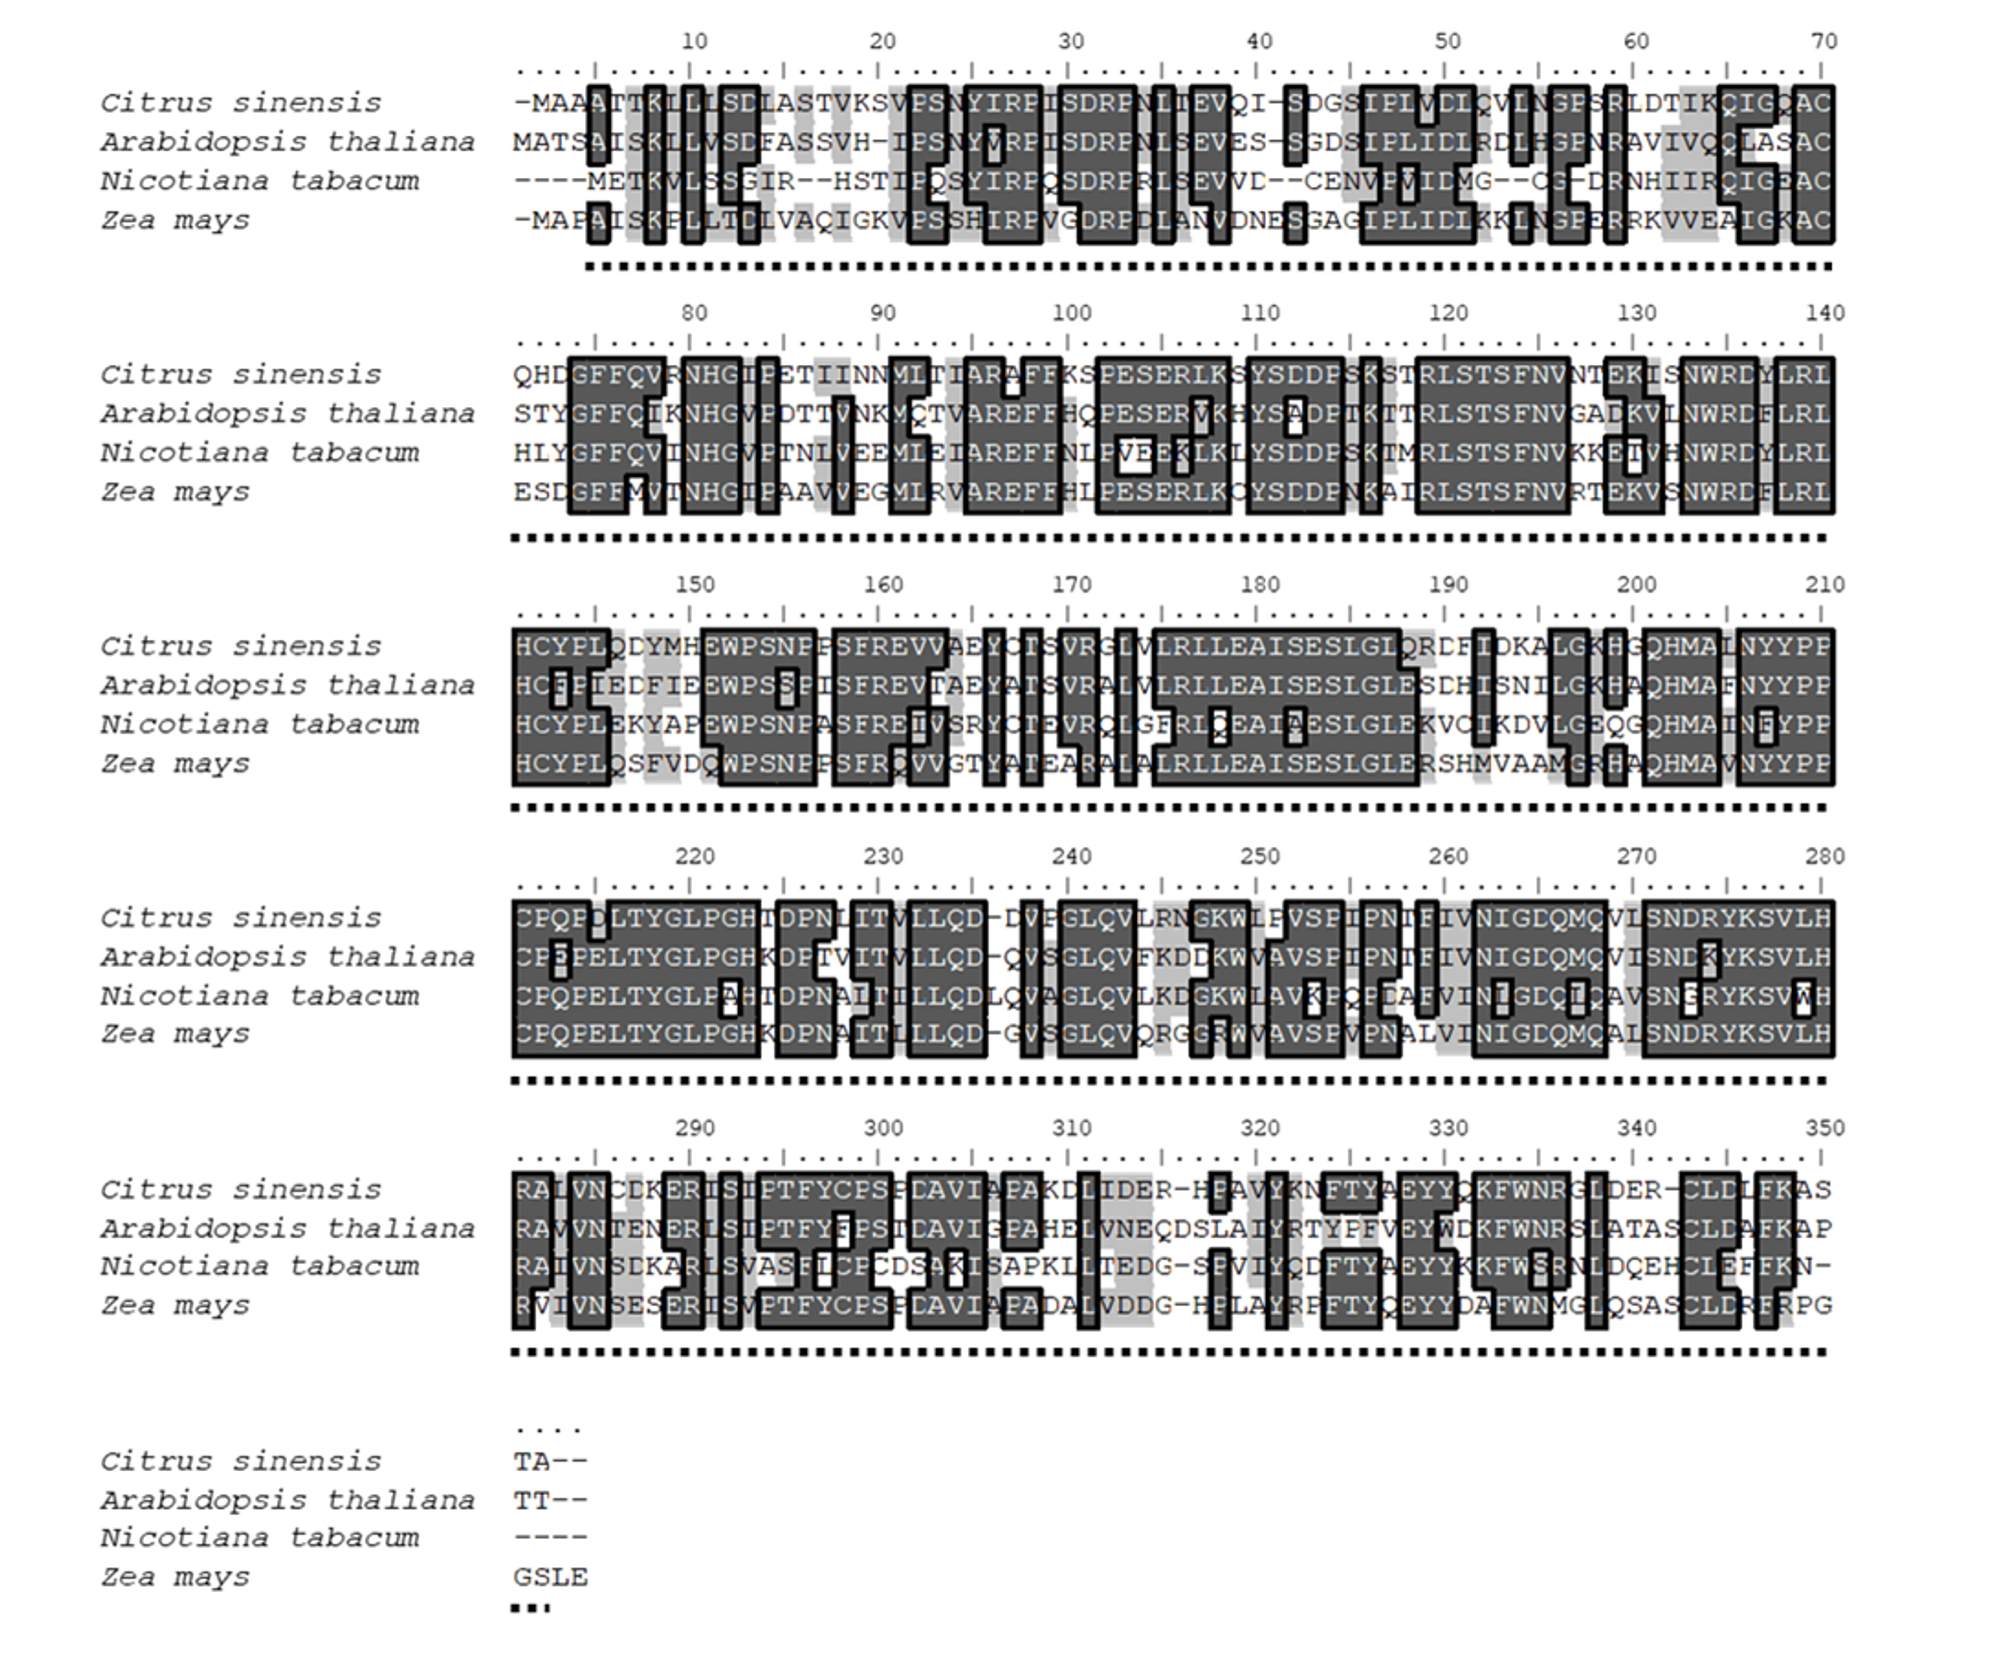
Alignments. Before creating amino acid alignments, only the Open Reading Frame (ORF) from genes associated with SA modifications were obtained using the Open Reading Frame Finder tool (http://www.ncbi.nlm.nih.gov/gorf/orfig.cgi). The sequences used for DMR6-like oxygenase alignment were: C. sinensis (accession number KK784903), A. thaliana (accession number NM_117118), Nicotiana tabacum (accession number NM_001325946), and Zea mays (accession number NCVQ01000003). The sequences used for S-adenosyl-L-methionine-dependent methyltransferase superfamily protein (BSMT) alignment were: C. sinensis (accession number XM_006466773), A. thaliana (accession number NM_111981), N. tabacum (accession number NM_001324786), and Z. mays (accession number CM000785). The sequences used for Methylesterase alignment were: C. sinensis (accession number XM_015532488), A. thaliana (accession number NM_127926), N. tabacum (accession number NM_001325513), and Z. mays (accession number XM_008676727). Finally, the sequences used for UDP-glycosyltransferase 74F2 alignment were: C. sinensis (accession number XM_006478492), A. thaliana (accession number NM_129944), N. tabacum (accession number XM_016625845), and Z. mays (accession number NCVQ01000003). All alignments were performed using ClustalW in Bioedit version 7.2.5 (55). To analyze the percentage of identity and similarity between the amino acid sequences of C. sinensis and A. thaliana, pairwise alignments were performed using Blast2 sequences algorithm (56). The predicted conserved domains in each amino acid sequence were determined using the NCBI Conserved Domain Database search (57).
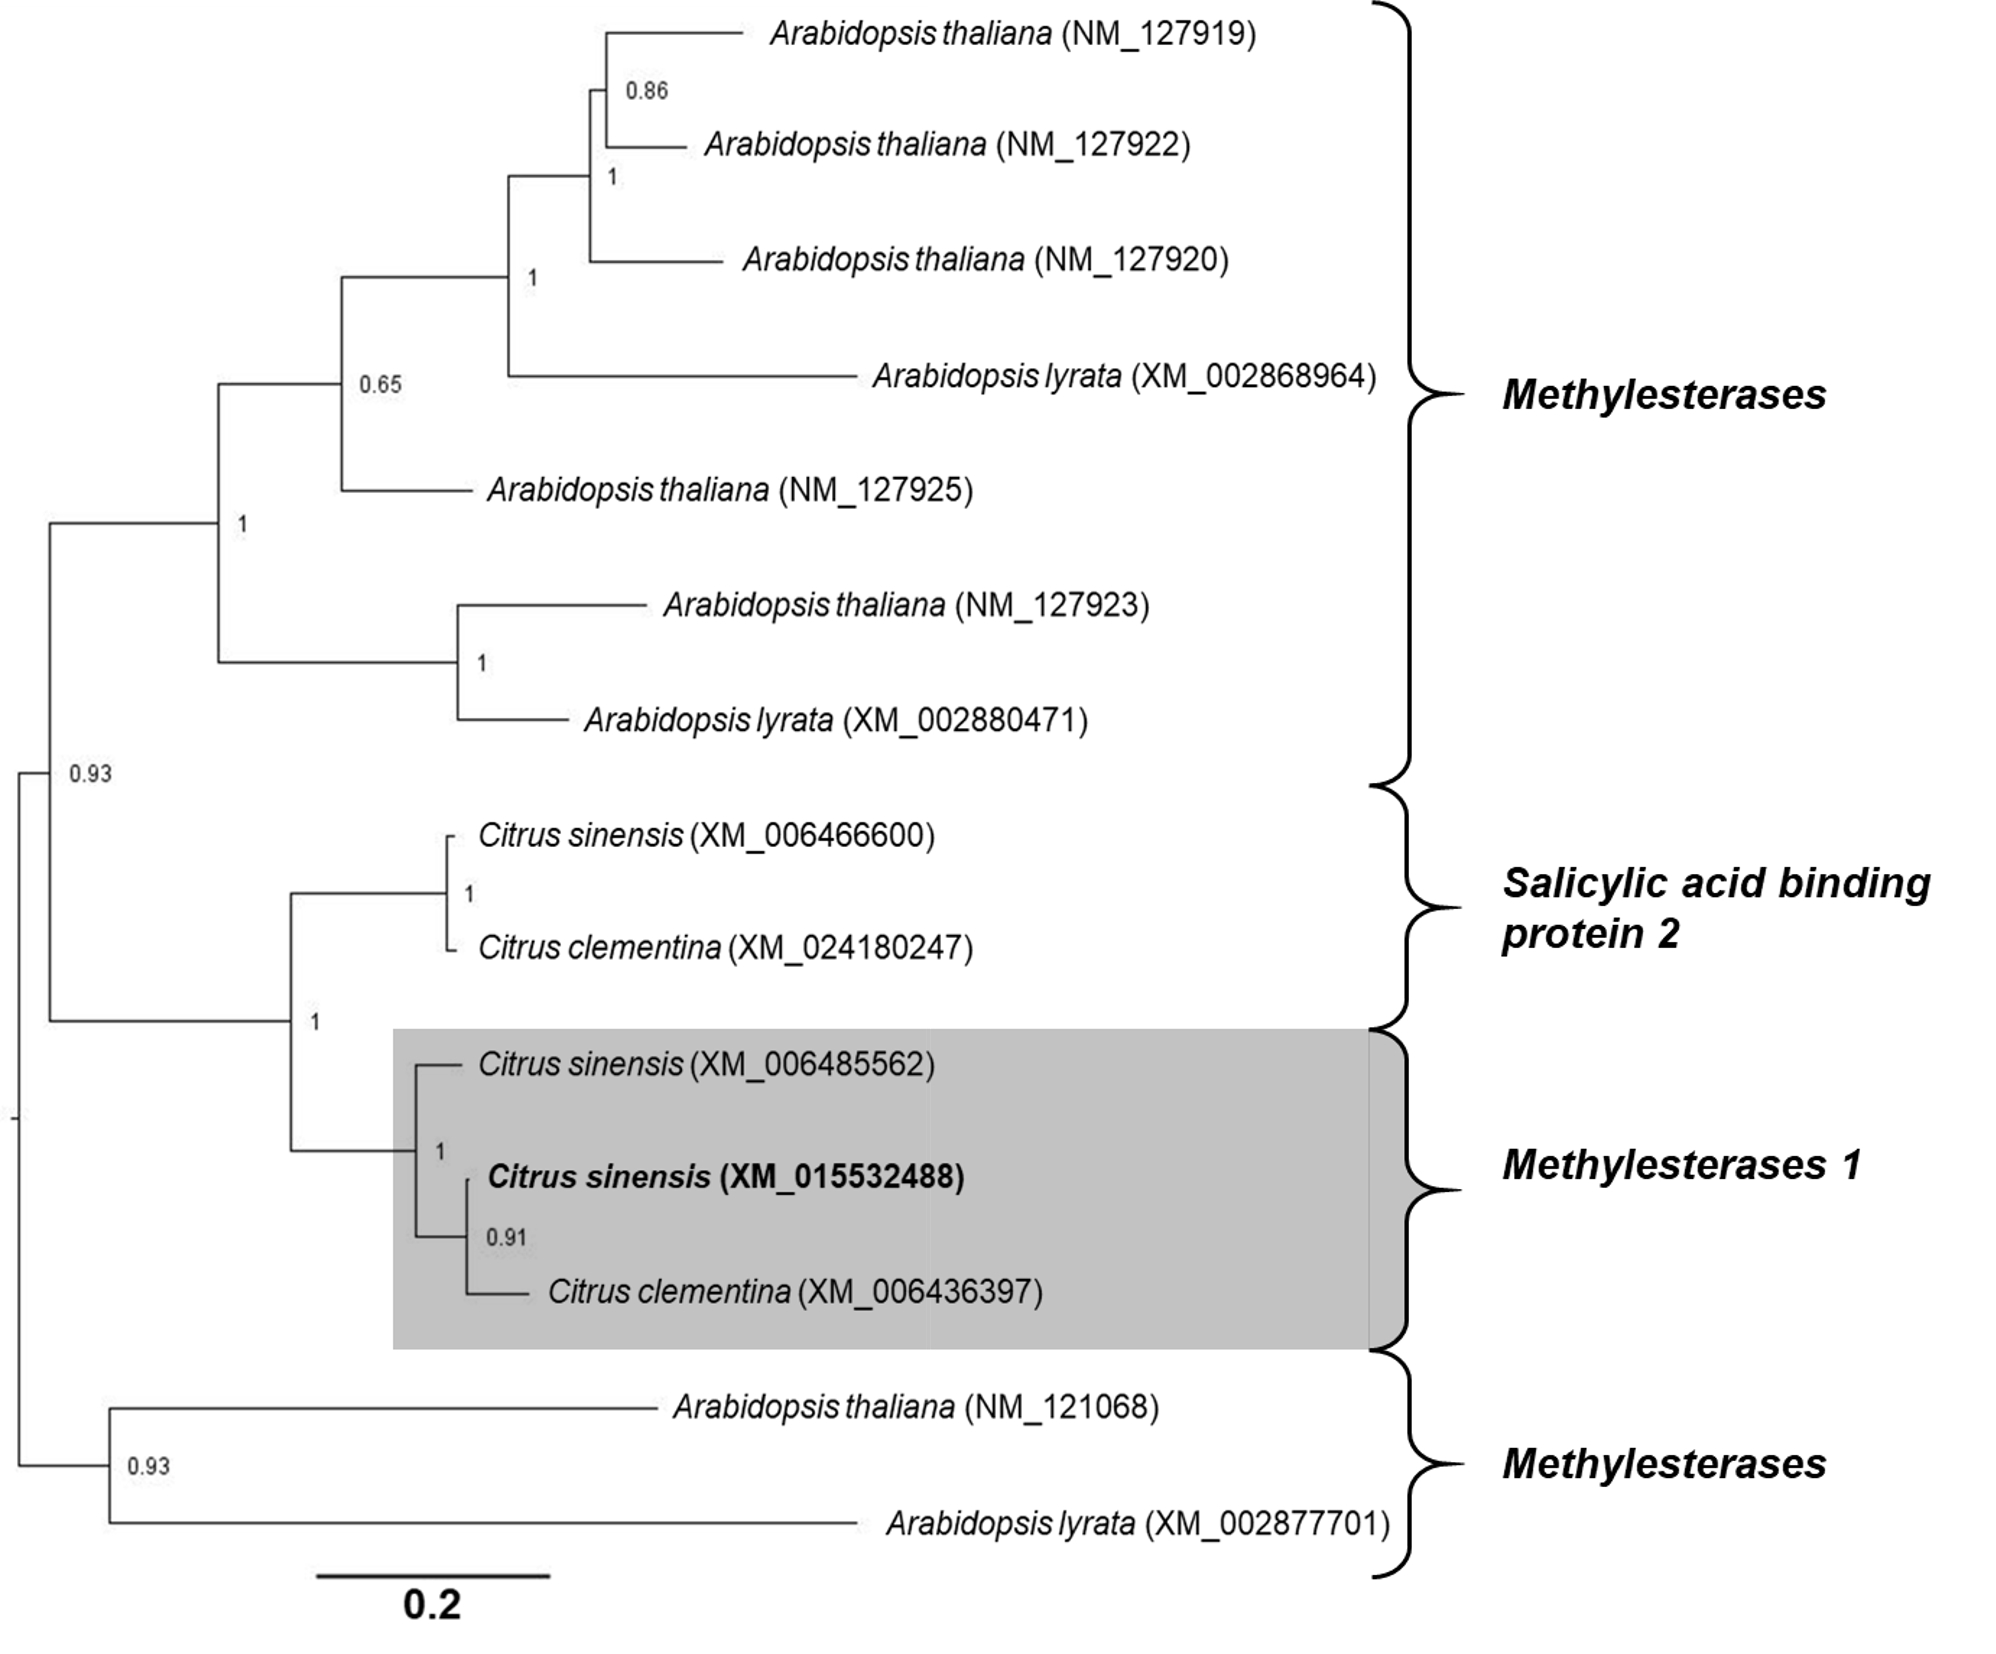
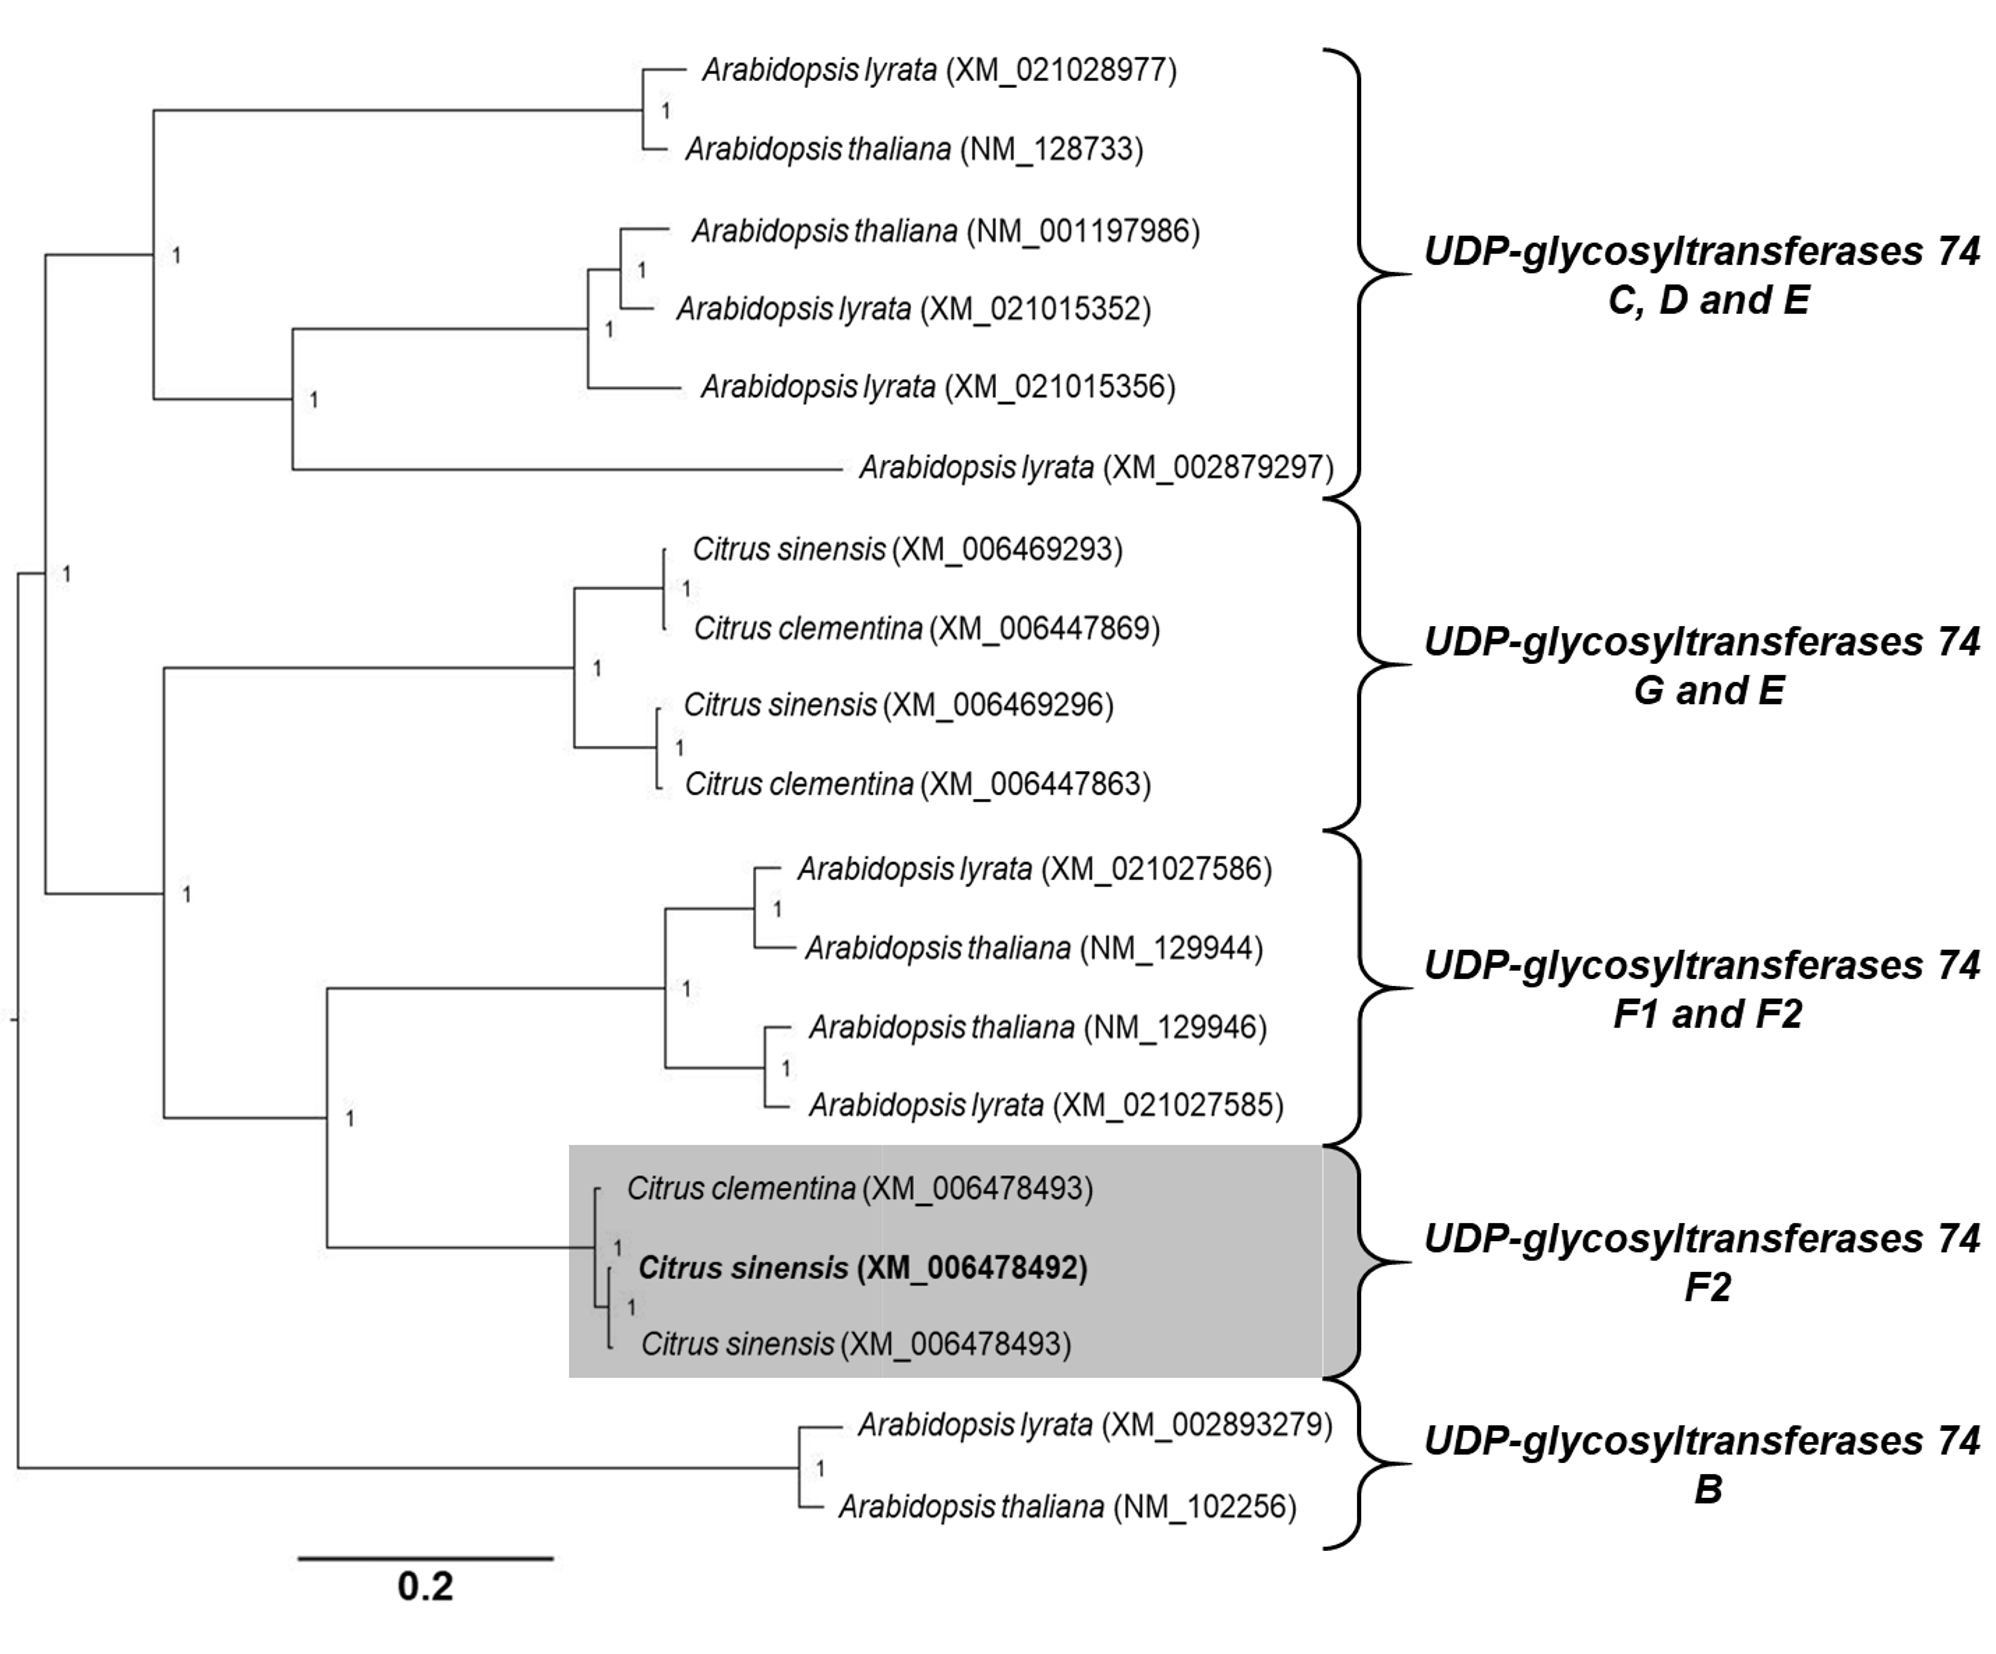
Phylogenetic analyses of genes associated to SA modifications. The open reading frame of each C. sinensis target gene was aligned with homologous nucleotide sequences obtained from A. thaliana, Arabidopsis lyrata and Citrus clementina. A multiple nucleotide sequence alignment was performed using ClustalW in the Cyberinfrastructure for Phylogenetic Research (CIPRES) portal (58). The estimation of phylogeny was achieved using MrBayes 3.2.6 in the CIPRES portal, with the following settings: four chains, two runs, nucleotide model = Generalized time reversible (GTR), rate variation = “invgamma” (GTR+I+Gamma model). Analysis of the Metropolis-coupled Markov chain Monte Carlo (MCMC) was run for fifteen million generations, sampled every 5000th step, and the first 25% of sampled trees were discarded as burn-in. The values of branch support were obtained by the method of posterior probability (≥0.70). Each phylogenetic tree was rooted at midpoint and edited in the Figtree program v.1.4.0 (59).
Insect feeding and plant-tissue collection
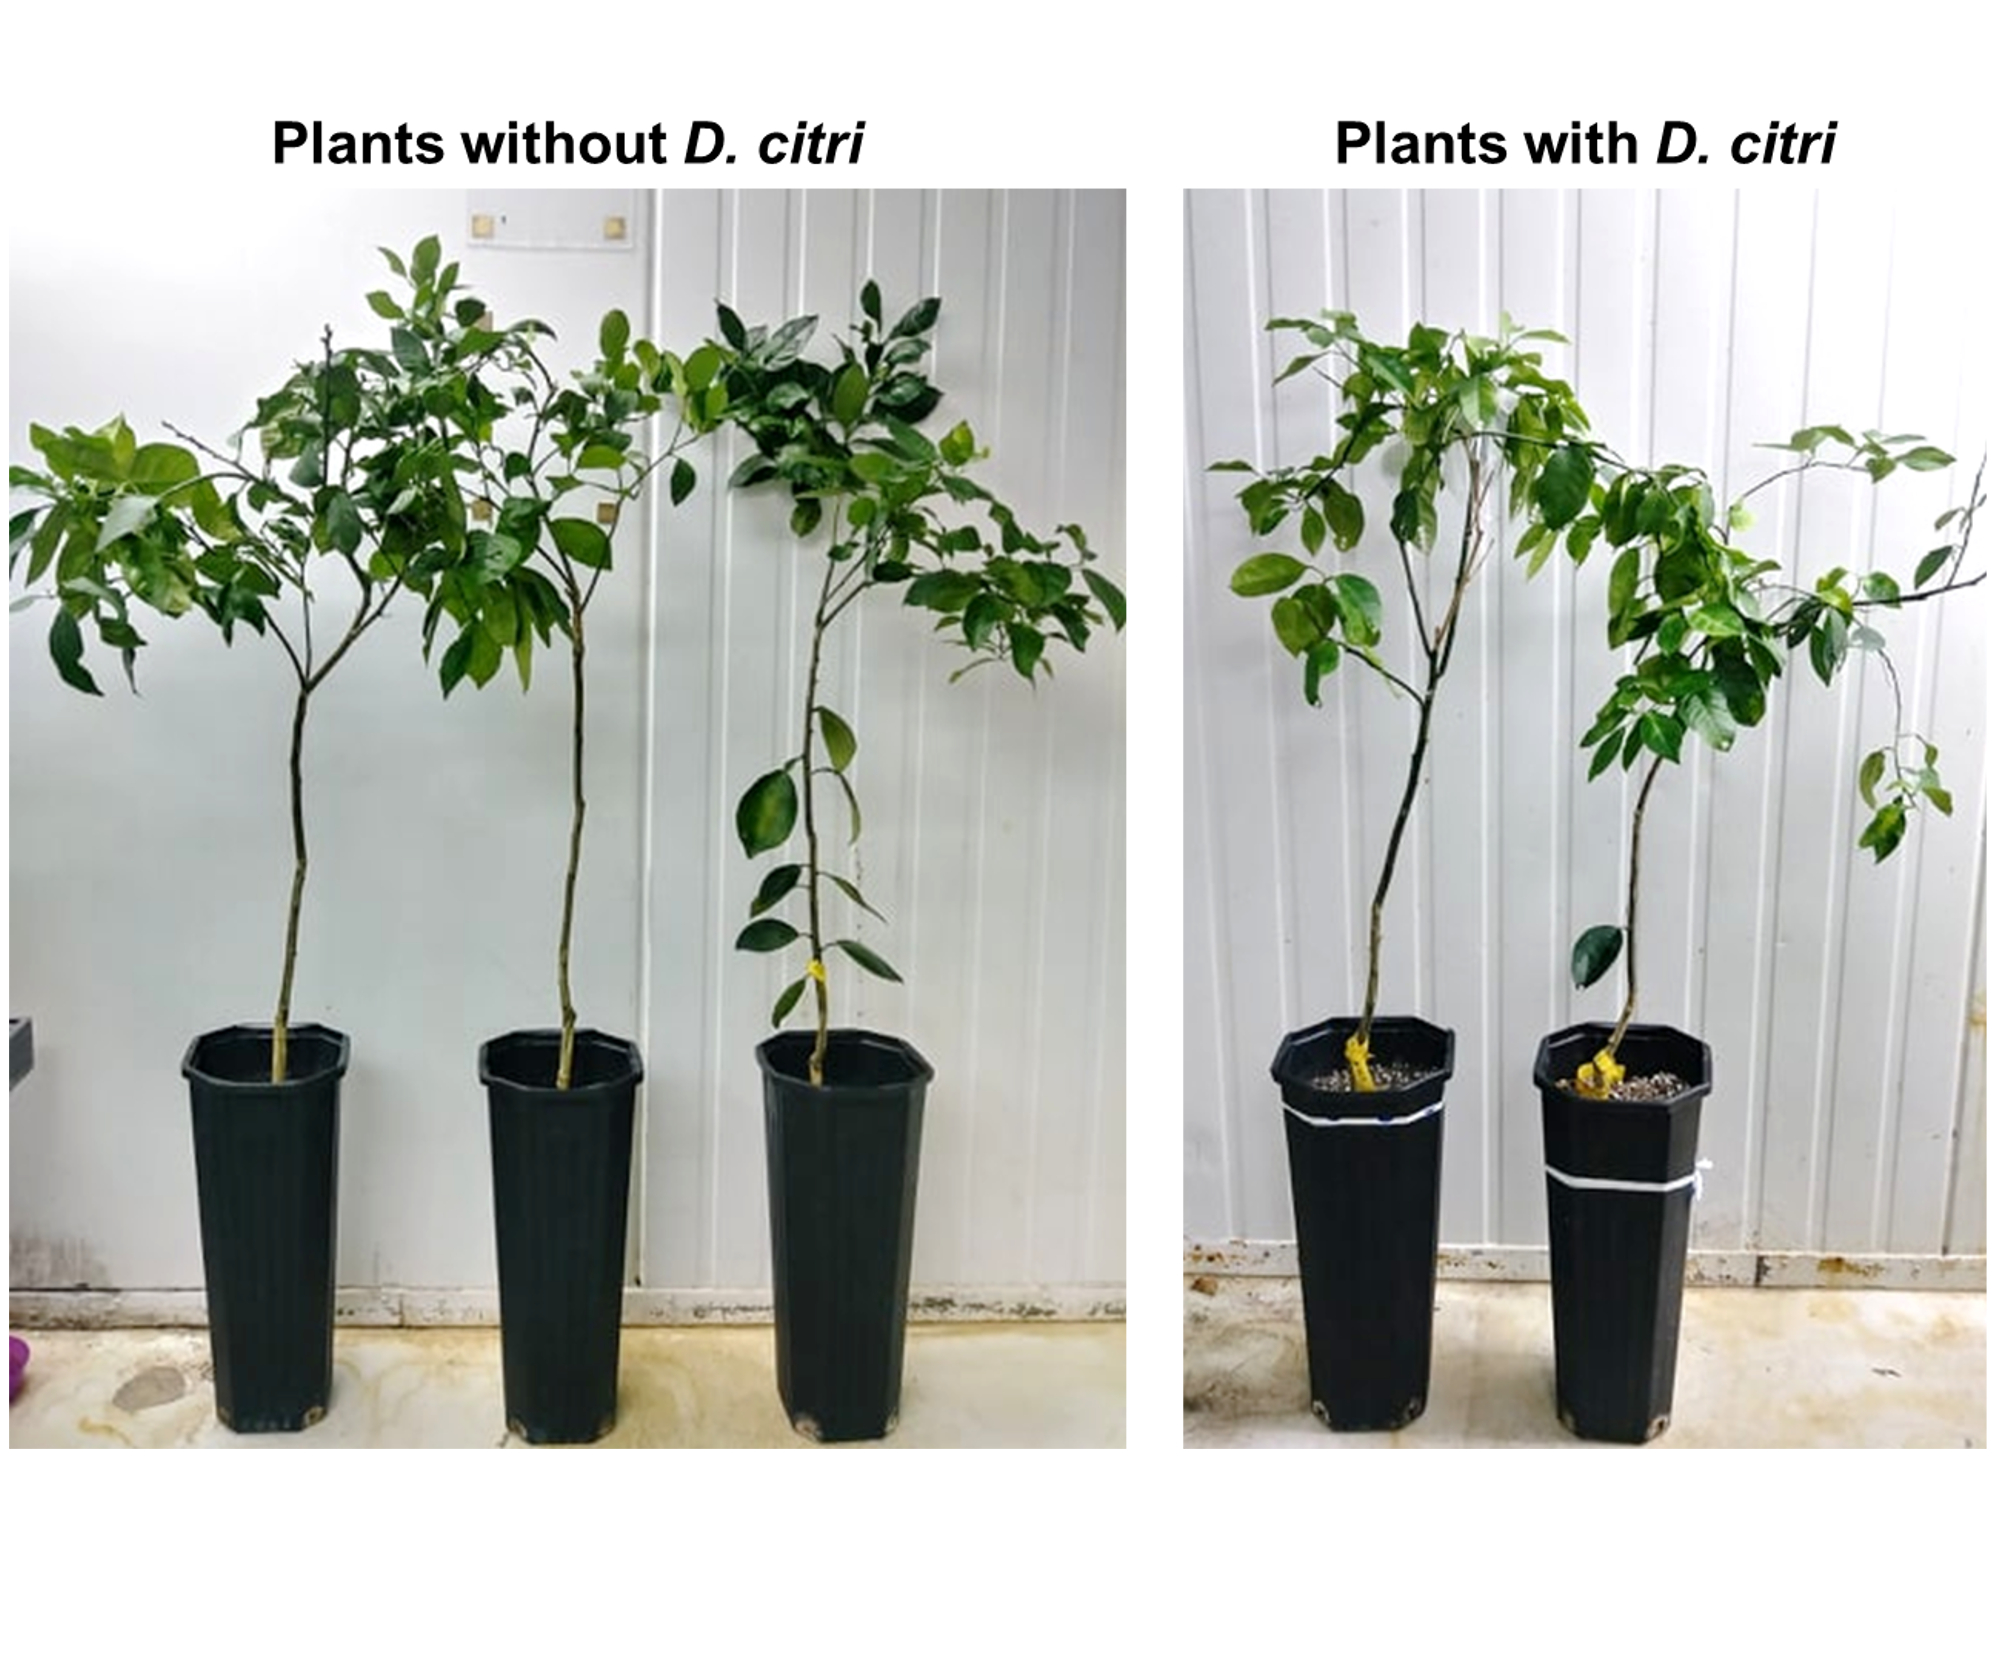
The objective of this experiment was to compare gene expression and SA metabolites produced during SA conversion between trees exposed to a constantly reproducing population of uninfected D. citri (feeding treatment) versus trees without insects (control treatment). There was no CLas infection present throughout the experiment in either vector or host. The feeding treatment consisted of initial release of 20 uninfected D. citri (~ 50:50 male: female ratio) per plant that were then constantly exposed to a reproducing population of D. citri adults and nymphs feeding on plants. Control plants were handled identically but remained unexposed to psyllids. The experiment began during spring flush (April 2018) when six plants of similar size and phenology were individually housed within (58.4 x 58.4 x 88.9 cm) insect-proof cages per treatment. From each plant, 19.63 mm2 leaf discs were collected from the midribs of 9 mature leaves following various durations of insect feeding to observe plant response after short (7-, 14- d of exposure to insects) and long-term (150- d exposure to insects) feeding by D. citri. The ‘150 d’ time point was chosen because plants began to display decreased growth rate compared to plants without insects (data not shown) near this time point. Plant tissues were immediately flash frozen using liquid nitrogen, ground in a tissue lyser, and then stored at -80°C until further analyses.
RNA extraction and cDNA synthesis
The total RNA was extracted from 20 mg of previously ground plant tissue using the RNeasy Plant mini kit (Qiagen) following the manufacturer’s instructions. To remove genomic DNA, each sample was treated with DNase using the Turbo DNase kit (Ambion) following the manufacturer’s protocol. The quantity and purity of total RNA was determined in a Nanodrop 2000 Spectrophotometer (Thermo fisher Scientific, Waltham, MA). After DNA removal, synthesis of complementary DNA (cDNA) was performed. Each cDNA synthesis reaction consisted of five hundred ng of total RNA, 5X cDNA synthesis buffer, anchored-Oligo (dT) primers, RT Enhancer and Verso Enzyme Mix, carried out with the Verso cDNA Synthesis kit (Thermo Fisher scientific, CA), as per the manufacturer’s protocol. Thereafter, cDNA samples were stored at -20°C until further analyses.
Gene expression analyses by RT-qPCR
RT-qPCR reactions were performed using PowerUp™ SYBR® Green Master Mix (ThermoFisher scientific). Each qPCR reaction contained 10 ng of cDNA (template), 300 nM of each gene-specific primer (Table 1) and 1x of PowerUp™ SYBR® Green Master Mix; the final volume was adjusted with nuclease-free water to 20 µL. The real-time PCR program consisted of a UDG activation step at 50°C for 2 min, a denaturation step at 95°C for 2 min, followed by 40 cycles at 95°C for 5 sec and 60°C for 60 sec. Real-time PCRs were performed using an Applied Biosystems 7500 Real-Time PCR System (Thermo Fisher Scientific). Each RT-qPCR reaction was performed in duplicate with a negative control in each run. Primer specificity was monitored with melting curve analysis using QuantStudio™ software V1.3 (Thermo Fisher Scientific) and 2% agarose gel electrophoresis. The relative gene expression for each target gene was determined with the delta delta CT (ΔΔCT) method (60) using the mean CT of β-actin and Elongation factor-1α (Accession numbers XM_026823249.1 and XM_006488084, respectively) as reference genes (61), following the equation: ΔΔCT = (CT, Target – CT, Actin/EF1a) Time x - (CT, Target – CT, Actin/EF1a) Time 0, where ‘time x’ corresponded to the ΔCT values observed between the target gene and the mean CT of β-actin and Elongation factor-1α following specified durations (7, 14 and 150 days) of plant exposure to treatments, while ‘time 0’ corresponded to the ΔCT values of genes analyzed in plants without insects, one day before beginning the assays.
Metabolite analysis by liquid chromatography-mass spectrometry (LC-MS).
SA metabolites were extracted using 20 mg of ground leaves. Briefly, each sample was mixed with 0.25 mL of ice-cold methanol/water solution (20/80, v/v), including three internal standards (0.01 μg/mL salicylic acid-d6, for salicylic acid and jasmonic acid; 0.4 μg/mL 2,5-dihydroxybenzoic acid-d3, for salicylic acid 2-O-β-D-glucoside and 2,3-dihydroxybenzoic acid; and 0.8 μg/mL methyl salicylate-d4 for methyl salicylate). Samples were extracted by ultra-sonic assisted extraction for 30 min in ice block-filled bathtub. After incubation, samples were centrifuged at 30,000 g at 4°C during 10 min, the supernatant was recovered and filtered with a 0.22 μm membrane filter, and 10 μL was injected into LC–MS/MS system.
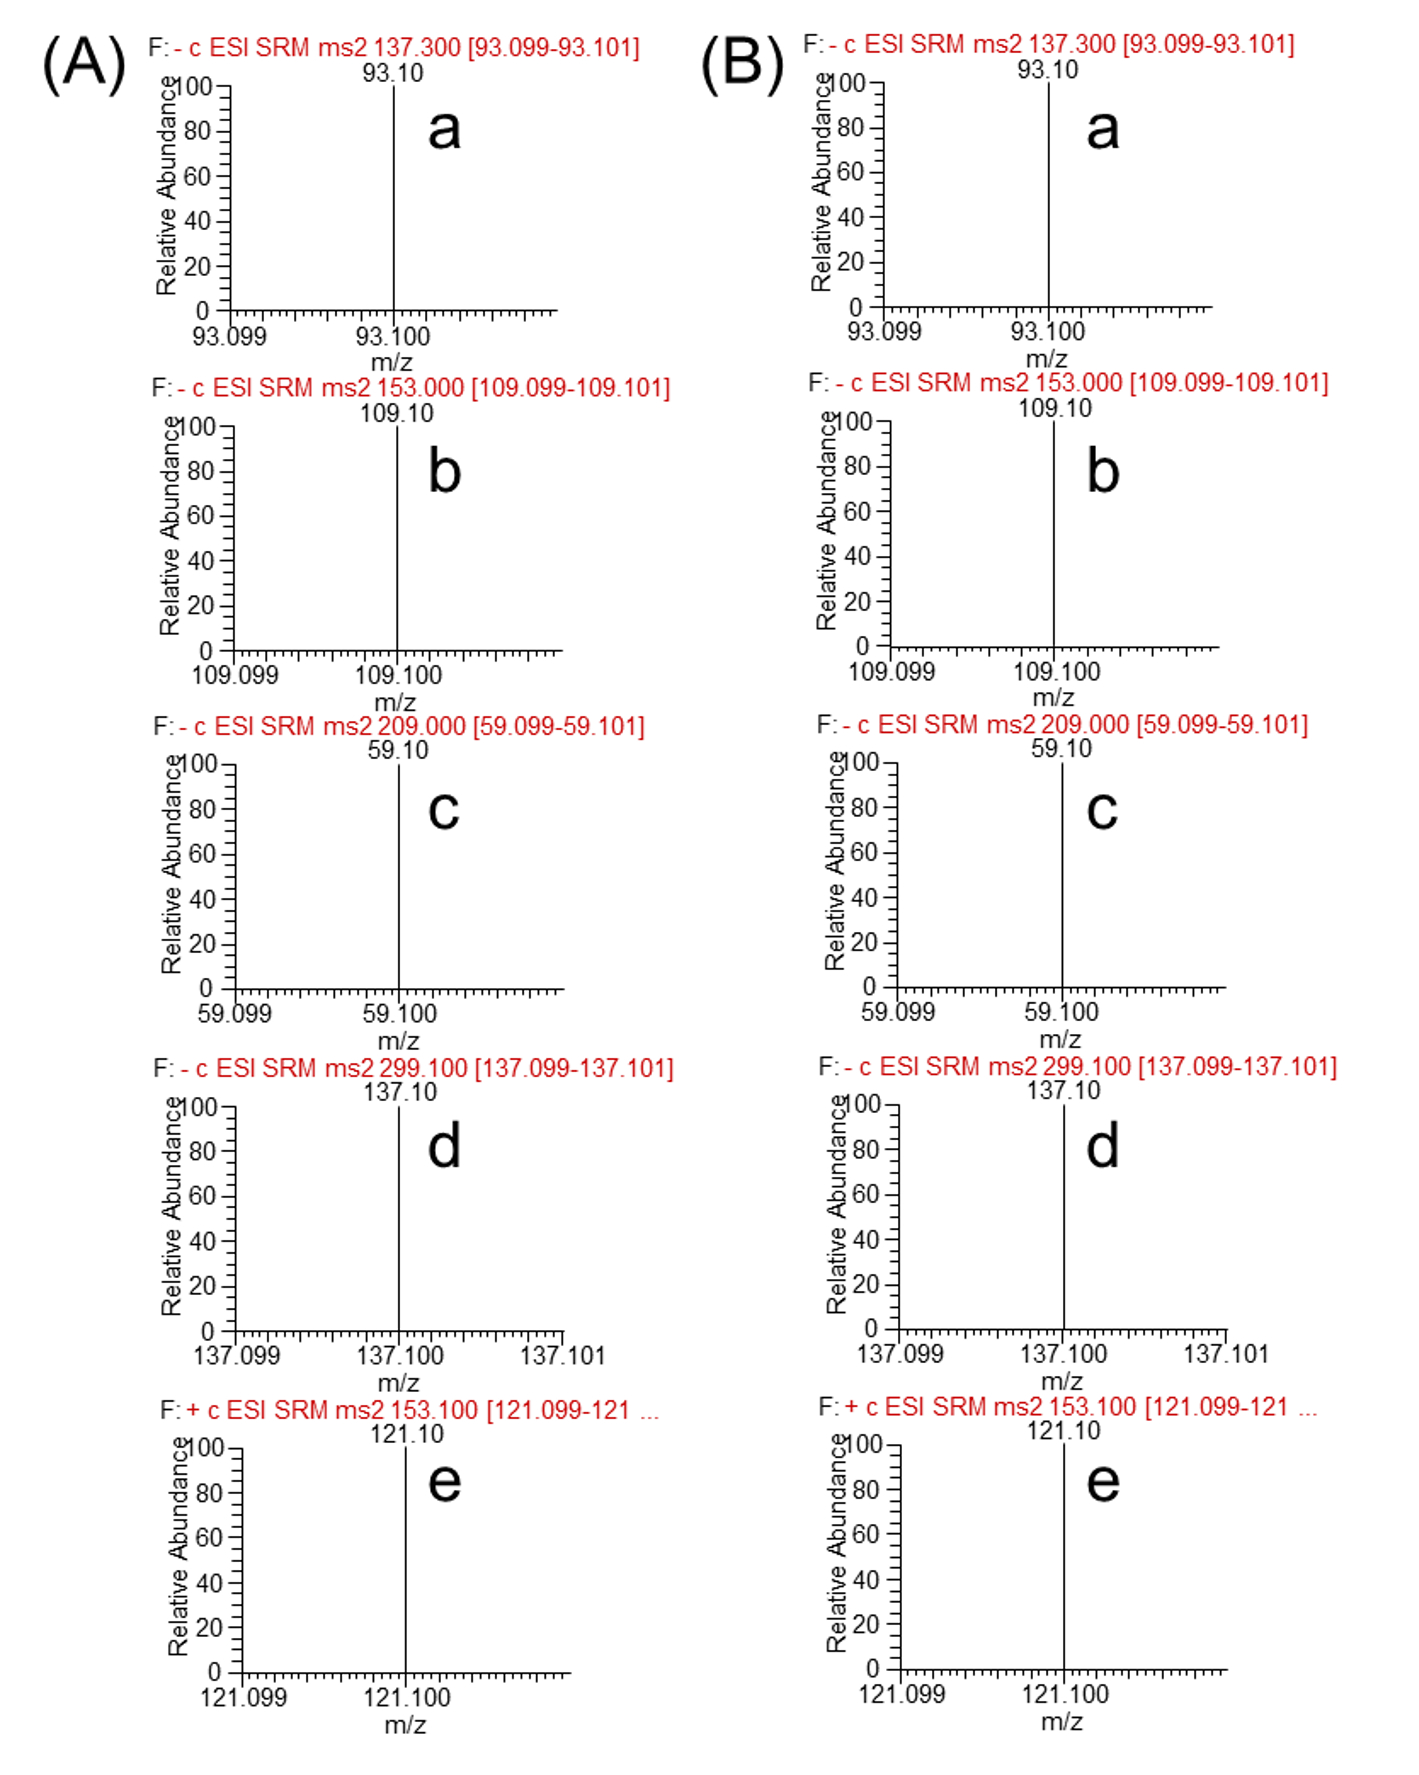
LC–MS/MS analyses were carried out with an Ultimate 3000 LC system coupled to a TSQ Quantiva triple quadrupole mass spectrometer (Thermo Fisher Scientific, San Jose, CA, USA). The analytes (salicylic acid 2-O-β-D-glucoside, 2,3-dihydroxybenzoic acid, salicylic acid, jasmonic acid, and methyl salicylate) were chromatographed on a Thermo Fisher scientific Acclaim C30 column (150 mm × 2.1 mm, 3.0 μm particle size) at a column temperature of 30°C using a gradient elution with 0.1% formic acid in water (eluent A) and 0.1% formic acid in acetonitrile (eluent B). The gradient was as follows: 0-10 min 20-95% B and 10-15 min 95% B. The column was re-equilibrated using the initial mobile phase before next run. The flow rate was set at 0.2 mL/min. The mass spectrometer was operated in both positive and negative electrospray ionization (ESI+ and ESI–) with selected reaction monitoring (SRM) mode. The ESI parameters were as follows: spray voltage, 3500 V for ESI+ and 2500 V for ESI–; sheath gas, 35 Arb; aux gas, 10 Arb; ion transfer tube temperature, 325°C; and vaporizer temperature, 275°C. Dwell time was 100 msec, and collision-induced dissociation (CID) gas was 2 mTorr. The parameters of MS/MS (retention time, SRM transition, collision energy and RF lens) are presented in Table 2. The analytes were assigned by comparing SRM transitions and retention times with authentic standards. The absolute quantification was performed using calibration curves constructed by plotting peak area ratios of the analyte relative to the internal standard against analyte concentrations (Table 3). Pooled quality control (QC) samples were run after every six experimental samples to check the batch reliability. Xcalibur software (Ver. 3.0) was employed for data processing and instrument control.
Statistical analyses
The relative gene expression and quantity of SA metabolites were analyzed using analysis of variance (ANOVA) with Tukey’s test post hoc analyses. All statistical analyses were performed using RStudio environment (62).