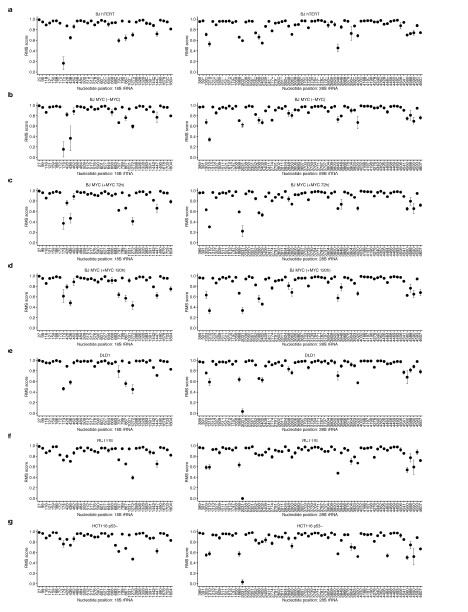
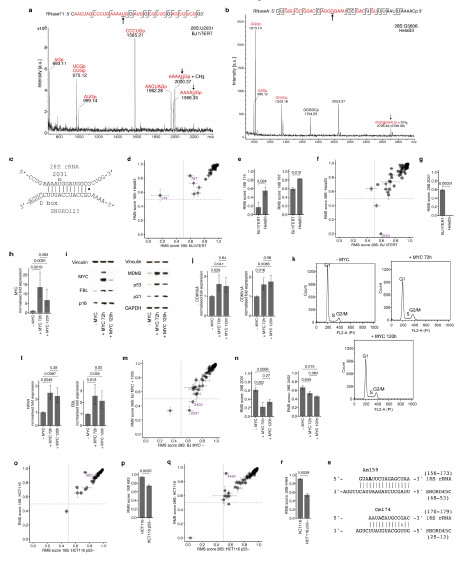
Extended Data Fig. 2 | Variation in 2’-O-me levels sites exists at specific sites in cell model systems. a, MS analysis of 28S:U2031 from fragment generated by RNase T1 digestion. Both methylated and unmethylated fragments are present in the spectra, as 25 expected from the RMS score. The sequence of the fragment is shown above the spectra, with an indication of the expected RNase cleavage sites. All identified fragments are labelled in red. Arrows mark 28S:U2031 position and spectra peaks. Observed mass is shown below each fragment. b, As (a) for MS analysis of 28S:G3606 from fragment generated by RNase A digestion. Theoretical mass (in brackets) is shown for fragment containing Gm3606. c, Schematic showing base pairing of SNORD123 and target region in 28S rRNA containing U2031. d, Comparison of RiboMeth-seq (RMS) scores representing fraction of 18S rRNA molecules 2’-O-methylated at each site in 18S rRNA from HelaS3 and BJhTERT cells. Points denote mean RMS score (n=3) per site. Horizontal and vertical error bars indicate ±s.d. for each condition. Sites exhibiting significant change are labelled with nucleotide position (magenta). e, RMS scores for 2’-O-me at 18S:174 and 18S:G683 in HelaS3 and BJhTERT cells. Columns indicate mean RMS score (n=3) for each condition. Error bars represent ±s.d. P values are shown above brackets. f, As (d), for 28S rRNA. g, As (e), for 2’-O-me at 28S:U2031. h, Expression of MYC mRNA in BJMYC cells. RT-qPCR analysis where MYC expression is not induced, or induced for 72 or 120h as indicated. Columns indicate mean (n=3) fold-change relative to the control condition, normalized to ACTB expression. Error bars indicate 95% confidence intervals. P values are shown for pairwise comparisons, indicated by brackets. i, Western blot analysis in BJMYC cells, where MYC expression is not induced, or induced for 72 or 120h as indicated. Protein levels of MYC, FBL, p53, MDM2, p21 and p16 are shown. Vinculin and GAPDH are included as loading controls. Data is representative of n=2 independent experiments. j, As (h), for expression of cell-cycle inhibitors CDKN2A (p16) and CDKN1A (p21) in BJMYC cells. k, Cell cycle profiles of BJMYC cells where MYC expression is not induced, or induced for 72 or 120h as indicated. FACS analysis of propidium iodide (PI) stained cells, showing proportion of cells 48 (count) against PI intensity (FL-2A). Representative data (n=2) is shown. l, As (h), for expression of MYC target genes NPM1 and FBL in BJMYC cells. m, Comparison of RiboMeth-seq (RMS) scores representing fraction of 28S rRNA molecules 2’-O-methylated at each site in BJMYC cells, where MYC expression is induced for 120h or not induced. Points denote mean RMS score (n=3) per site. Horizontal and vertical error bars indicate ±s.d. for each condition. Sites exhibiting significant change are labelled with nucleotide position (magenta). n, RMS scores for 2’-O-me at 28S:U203 and 28S:U2402 in BJMYC cells, without MYC induction or with MYC induction for 72 or 120h. Columns indicate mean RMS score (n=3) for each condition. Error bars represent ±s.d. P values are shown for each pairwise comparison, indicated by brackets. o, As (m), for 18S rRNA in HCT116 and HCT116p53-/- cells. p, As (n), for 2’-O-me at 18S:G683 in HCT116 and HCT116p53-/- cells. q, As (m), for 28S rRNA in HCT116 and HCT116p53-/- cells. r, As (n), for 2’- O-me at 28S:G4464 in HCT116 and HCT116p53-/- cells. s, Sequence alignment of SNORD45C guide regions with putative target sequences in 18S rRNA. Position of methylation sites at A159 (top) and C174 (bottom) is indicated by *.