Breastmilk samples (colostrum) from 43 Mexican individuals aged 20-32 years were used in this study. All deliveries were at term with a mean of 39.4 weeks of gestation. A total of 18 samples from mothers with BMI < 25 kg/m2 (non-obese), with no GDM symptoms were considered as controls. Twelve milk samples were collected from mothers with obesity (BMI ≥ 30 kg/m2) and without GDM, as well as 13 samples were obtained from mothers with GDM and a BMI < 30 kg/m2. None of the participants in the gestational diabetes study group had obesity; however, eight of them were overweight (BMI ≥ 25 kg/m2). Most of our participants were multiparous and 25 women were given antibiotics during labor. Regarding delivery, 24 neonates were born by caesarean section and the sex distribution of the newborns was 48.8% of males and 51.16% of females. Clinical and demographics of the participants are summarized in Table 1.
Table 1. Clinical characteristics of subjects included in the study (n = 43).

We classified data according to the pathophysiological condition and the newborn gender resulting in a total of six study subgroups, namely: obesity positive, GDM negative - female newborn (Ob-F; n=8); obesity positive, GDM negative – male newborn (Ob-M; n=4); GDM positive, obesity negative - female newborn (GD-F; n=6); GDM positive, obesity negative - male newborn (GD-M; n = 7); healthy normal weight - female newborn (NW-F; n = 8) and healthy normal weight - male newborn (NW-M; n = 10).
After birth, breastmilk was collected within the first 24 hours and colostrum was appropriately stored at -20°C until analysis. Using NGS, 1,675,157 high quality reads were obtained with a mean of 38,957 ± 27,723 sequencing reads per sample. Removal of possible contaminants and rare taxa was performed through an exhaustive batch analysis for all samples processed. We identified batch effect for Pseudomonas, Enterobacteriaceae, Ralstonia and Herbaspirillum across our dataset. Even though Pseudomonas and Enterobacteriaceae are part of other breastmilk microbial compositional studies [8,25–28] we decided to remove them from our dataset as clear batch effect is observed (Supplementary Figure 1).
After the removal of possible contaminants and rare taxa (≤ 25 reads in total), 1,496 amplicon sequence variants (ASVs) were assigned at 30 phyla, 58 classes, 133 orders, 217 families, 395 genera and 335 species using Silva 132 database with a confidence identity level set at 99%. We found increased prevalence of Staphylococcus, Corynebacterium 1, Anaerococcus and Prevotella in samples from participants with GDM and obesity. Detailed information about the abundance of ASVs found per sample can be found in the Supplementary Table 1.
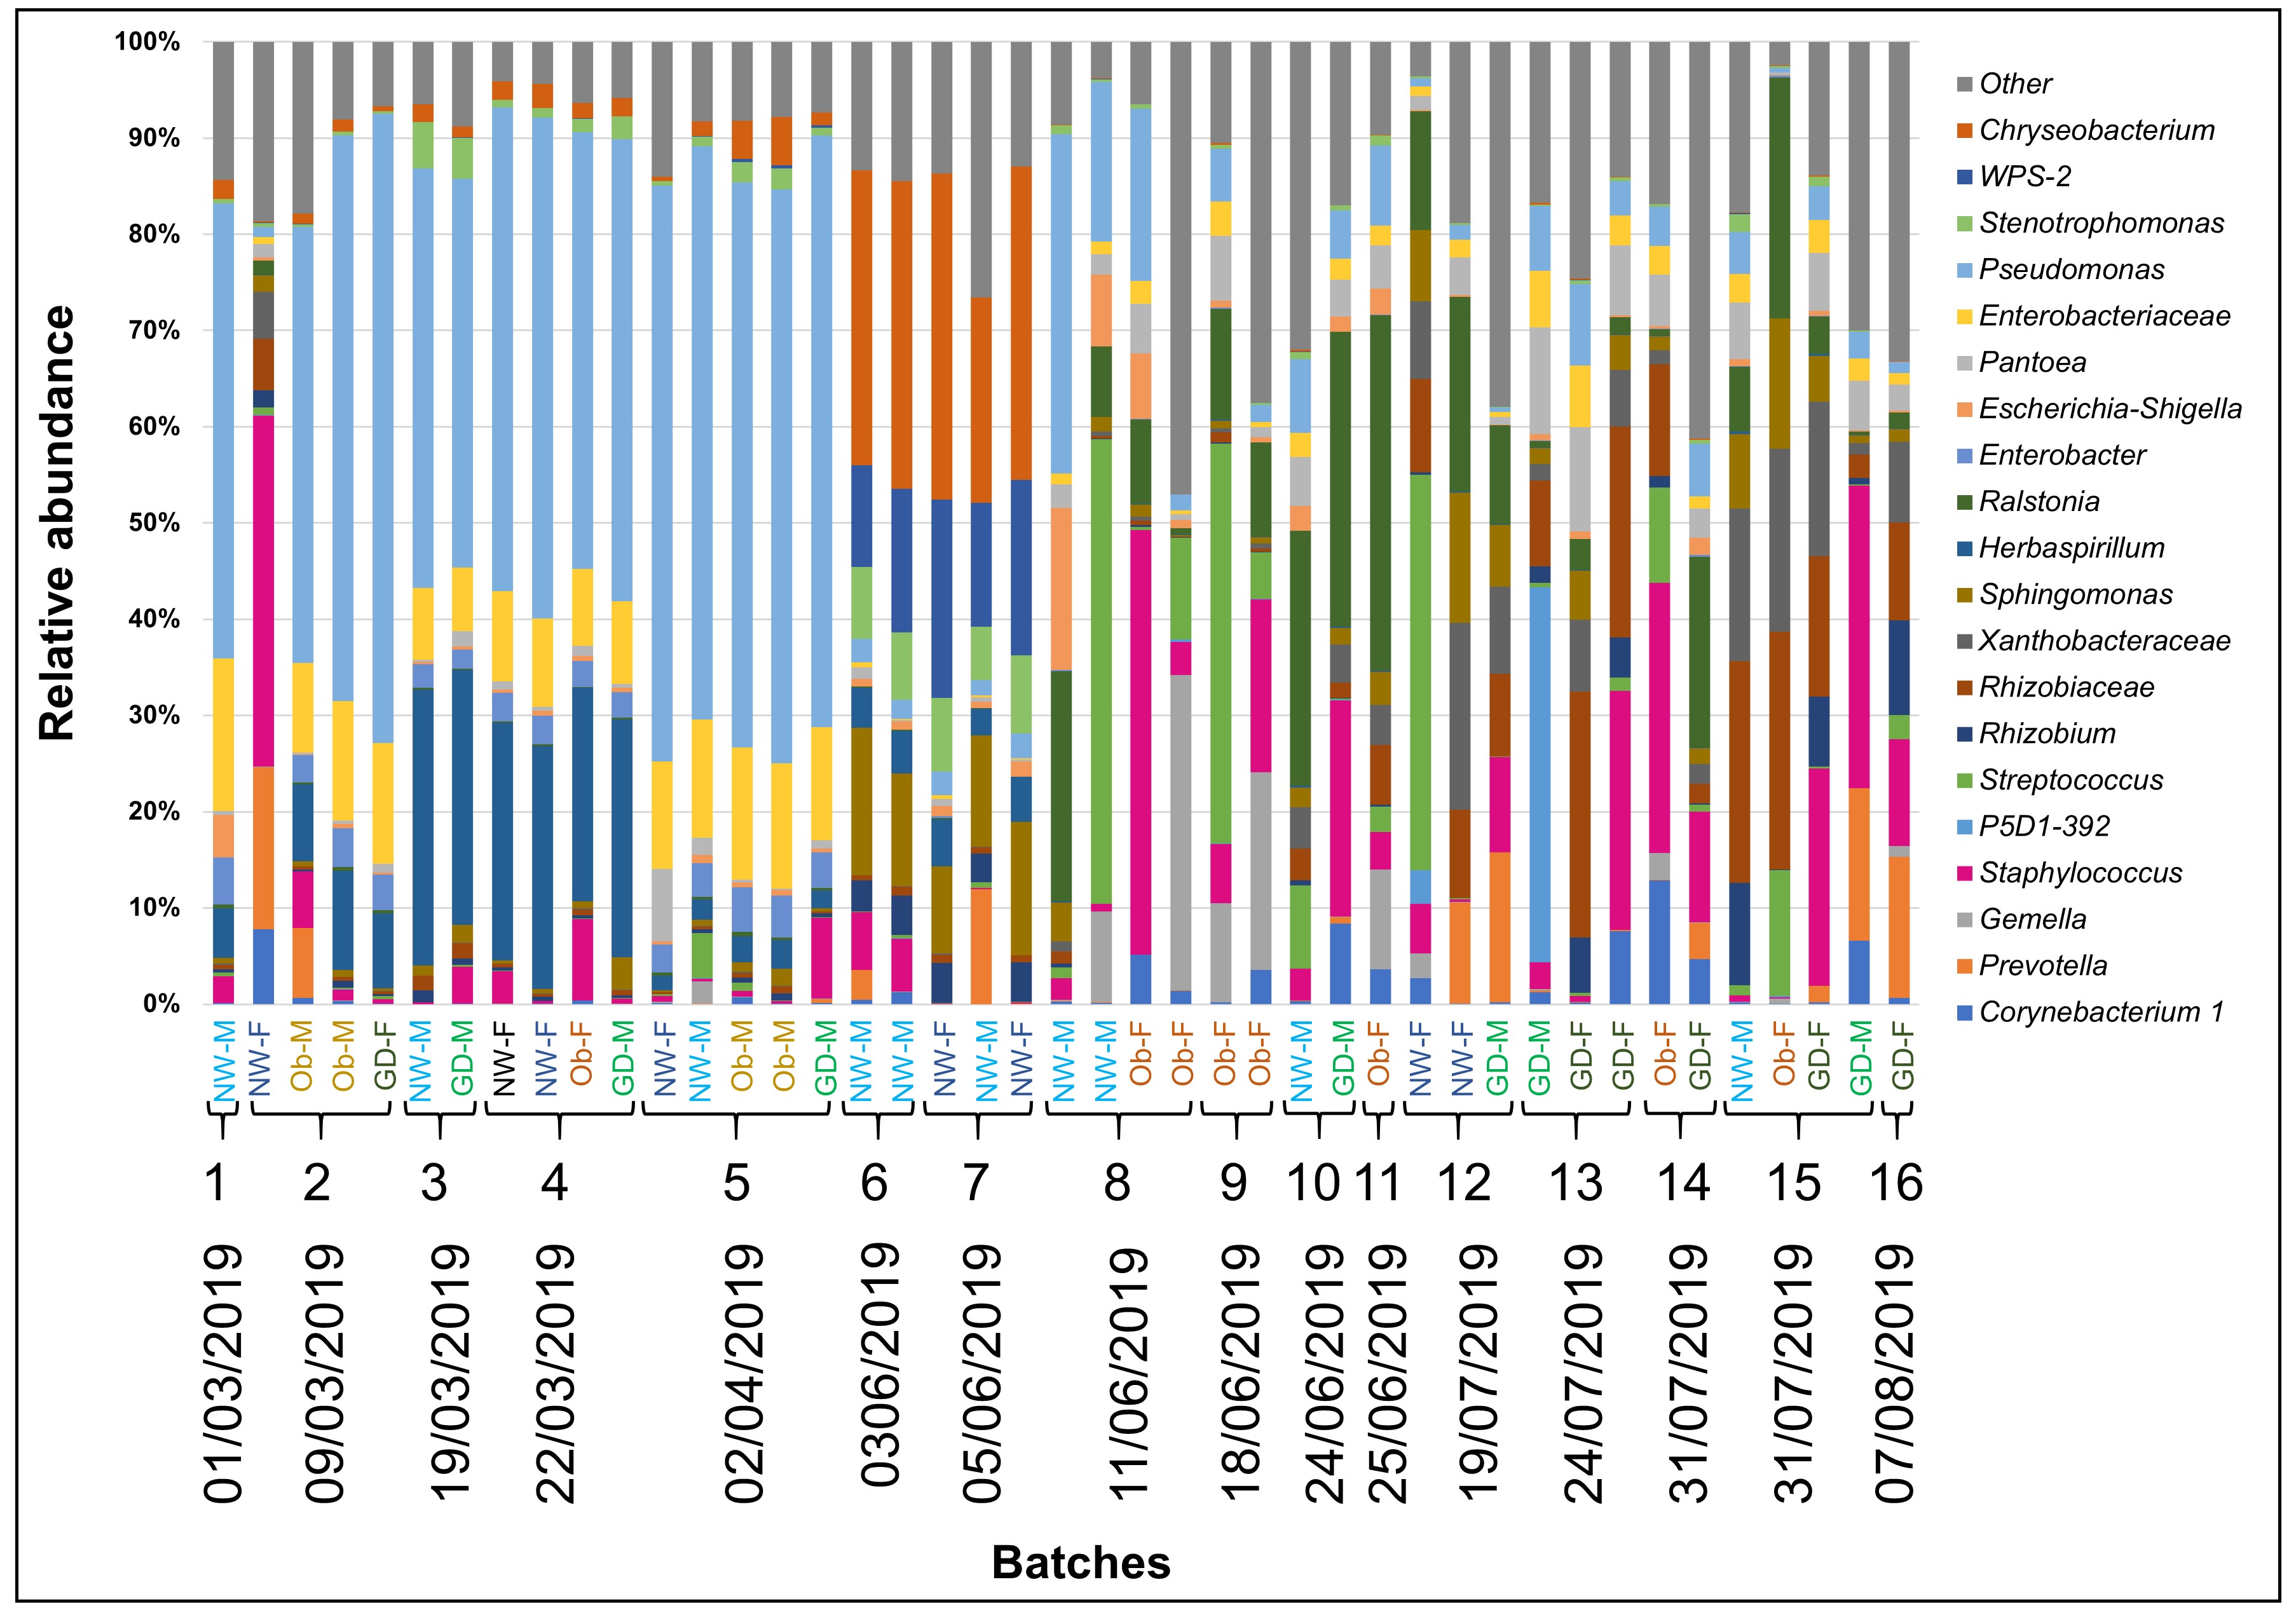
Colostrum compositional microbiota was dominated by Staphylococcus in all the samples.
We found that breastmilk samples were overrepresented by the family member of the Firmicutes phylum Staphylococcaceae with a relative abundance mean of 13.9% ± 16.5% (range 0.1% - 76.3%). Followed by the Proteobacteria phylum members Rhizobiaceae with a relative abundance mean of 10.3% ± 11.1% (range 0.1% - 47.2%) and Burkholderiaceae (9% ± 11.7% (range 0% - 48.6%). Less represented phyla were Bacteroidetes with Weeksellaceae (8.6% ± 11.9% (range 0% - 37.2%) and Prevotellaceae (3.8% ± 7.1% (range 0% - 24.3%) and Actinobacteria with Corynebacteriaceae (3.2% ± 4.5% (range 0% - 16.2%). The classification of “Other” represents phyla with less than 1% of total relative abundance (Figure 1A).
Bacteria belonging to the Burkholderiaceae family were more abundant in obesity-male (Ob-M, 21.9% ± 9.5%) but less abundant in obesity-female (Ob-F, 2% ± 4.5%). The highest relative abundance of Staphylococcaceae, Streptococcaceae and Bacillales was shown for obesity-female (Ob-F, 24.2% ± 25.8%; 13.9% ± 19.3%; 12.6% ± 13.6). Xanthobacteraceae showed higher abundance in all the female groups compared to their male counterpart. Sphingomonadaceae were more abundant in healthy groups with 8.4% ± 6.5% for female (NW-F) and 10% ± 7.2% for male (NW-M). This behavior was also observed for WPS-2, a recent candidate division, which had the highest relative abundance in healthy-female (NW-F, 5.5% ± 10%) (Figure 1A).
Staphylococcus, Corynebacterium 1, Anaerococcus and Prevotella are overrepresented in samples of individuals with obesity and GDM
Overall, the most abundant genera were Staphylococcus (13.9% ± 16.5%), Chryseobacterium (7.9% ± 11.6%), Rhizobiaceae (7.3% ± 9.2%), Streptococcus (7.1% ± 16.1%), Sphingomonas (6.6% ± 6%) and Burkholderia (5.5% ± 9.8%) (Figure 2). The “Other” category represents the taxa with less than 1% overall. According to the subgroup classification, in the healthy normal weight subgroups, Chryseobacterium (p < 0.05) and Sphingomonas (p < 0.10) were more abundant (15% ± 16.5%, 8% ± 6.5% for female (NW-F) and 12% ± 13.7%, 9.3% ± 6.7% for male (NW-M) respectively). Corynebacterium 1 (p < 0.10) and Anaerococcus (p < 0.10) were more abundant in subgroups with obesity and GDM. Staphylococcus was more abundant (p < 0.05) in obese and GDM subgroups with female baby (Ob-F, 24.2% ± 25.8%; GD-F, 15.5% ± 11.9%) compared to their healthy counterpart. Obesity-female (Ob-F) had the highest prevalence of Gemella (p < 0.05). While not statistically significant, Streptococcus and Neisseria presented higher relative abundance in obesity-female (Ob-F) compared to the rest of subgroups. Stenotrophomonas and Burkholderia were more abundant in subgroups with male neonate compared to the healthy counterpart (p < 0.05), distinctively in obese (Ob-M, 6.6% ± 5.7% and 16.7% ±7.1% respectively). A similar pattern was also observed for Prevotella in the obesity-male (p < 0.05) and in the GDM-male (p < 0.10) subgroups. Breastmilk from subjects with GDM showed higher prevalence of “Other genera” (29.8% ± 13%, 25.9% ± 7.4% for female and male respectively), suggesting that the biggest part of this contribution to the relative abundance of both subgroups is due to genera with less than 1% in total. This is supported by the rarefaction curves which reveal that GDM–female (GD-F), GDM–male (GD-M) and obesity-female (Ob-F) had higher values of estimated number of observed ASVs (Figure 1B). A full distribution of taxa is shown in Figure 2.
Alpha and beta diversity metrics show a distinct microbial composition for GD-F, Ob-M and newborn gender-related samples
We used a general linear model (glm) using alpha diversity metrics at a sequencing depth of 6,130 (data not shown) in order to quantify the influence of GDM, obesity (BMI ≥ 30 kg/m2), mode of delivery, antibiotic exposure, multiparity and sex of the baby. As a result of the analysis, maternal physiopathology (GDM, obesity and healthy) and antibiotic exposure showed statistically significant association (p ≤ 0.10) for Shannon index and observed ASVs. The implementation of intrapartum antibiotics was related to a decrease in diversity. The sex of the baby showed statistically significant association (p ≤ 0.05) for phylogenetic diversity and observed ASVs (Figure 3A-C). GDM subgroups presented the highest values in all alpha indexes. In addition, our results suggest that, in general, female subgroups had higher diversity compared to male subgroups. Fisher’s comparisons indicate that statistical difference was only significant between healthy-female (NW-F) and GDM-female (GD-F) for Shannon index. Breastmilk samples from obesity-male subgroup (Ob-M) had the lowest levels of alpha diversity and were statistically different to all the subgroups, including their female counterpart (Figure 3A-C).
We estimated microbiome beta diversity using the unweighted UniFrac distance (Figure 3D). Our results show that obesity-male (Ob-M) subgroup cluster separately from the rest of the samples (PERMANOVA; p = 0.047; 999 permutations). Using the unweighted distance matrix, we generated a PCoA biplot in order to show that the clustering was significant for obesity-male (Ob-M; p < 0.05) compared to healthy-male (NW-M). Arrows in the plot represent the correlation at family level with PCoA axes, indicating their contribution to the variation (Figure 3D). While samples from GDM-female (GD-F), GDM-male (GD-M), healthy-female (NW-F) and obesity-female (Ob-F) show high similarity regarding microbial composition, the unweighted measurement indicates that there is a phylogenetic difference between obesity-male (Ob-M) and the rest of subgroups (p < 0.05).
We used the beta-diversity compositional Aitchison’s distance in order to assess the compositional nature of data (PERMANOVA; p = 0.002; 999 permutations) (Figure 3E). The robust principal component analysis (RPCA) biplot, which allows to examine the variation of samples and taxa, did not show a clear separation of any subgroup. PERMANOVA tests and pairwise comparisons showed that obesity-male (Ob-M) was different to both GDM subgroups (p < 0.05) and that obesity-female subgroup (Ob-F) was statistically different to its male counterpart (Ob-M) and both healthy and GDM subgroups (p < 0.05). In addition, the GDM-male (GD-M) subgroup was different to its healthy counterpart (NW-M; p < 0.10). The 7 taxa presented as vectors in the plot are the most significant drivers of the location of samples (Figure 3E).
Breastmilk core and differentially abundant taxa
We defined the breastmilk core microbiota as taxonomical families present in all samples with a minimum 1% of total mean relative abundance. Overall, 8 families were identified as the core taxa and comprise 56.8% ± 11.3% of the total (Table 2). The most abundant were Staphylococcaceae with a general mean of 13.9% ± 16.5%, followed by Rhizobiaceae (10.3% ± 11.1%), Burkholderiaceae (9% ± 11.7%) and Streptococcaceae (7.1% ± 16.1%). These results demonstrate the high variability of the core bacteria among subgroups and individuals. The four most abundant families belonging to the core were found to describe most of the variation in the ordination space observed in the unweighted PCoA biplot and were represented as arrows (Figure 3D). However, no clear participation of families to the formation of subgroups was visualized with the implement of UniFrac metrics.
Table 2. Breastmilk core microbiota at the taxonomical family level (% relative abundance ± standard deviation).

We used the Aldex2 tool [29] in order to identify differences in ASV abundance between subgroups. We determined the taxa that were driving the difference between the subgroups and obtained effect plots (based on the effect size), which allowed us to visualize if the variation was higher between or within subgroups. Given the high variability amongst samples, we only observed differentially abundant ASVs with a significant expected Benjamini-Hochberg corrected p-value of Welch’s t test (q ≤ 0.1) in three sample pairs (Figure 4). In the GDM-female vs healthy-female (GD-F vs NW-F) comparison, the family Rhodobacteraceae was identified as different (q < 0.10; Figure 4A).While in the healthy-male vs obesity-male (NW-M vs Ob-M) were found a total of 5 families (Vibrionaceae, Halomonadaceae, Shewanallaceae, Bdellovibrionaceae, and Saccharimonadales) with an absolute effect size greater than 1 and a q-value ≤ 0.05 (Figure 4B), in the obesity-male vs obesity-female (Ob-M vs Ob-F) 10 significant taxa were different, of which only 2 (Burkholderiaceae and Sphingobacteriaceae) corresponded to the core families (Figure 4C). Based on the median difference between subgroups, we observed that in all comparisons, obesity-male (Ob-M) had significant higher abundance for differential taxa found. In addition, GDM-female (GD-F) had higher prevalence of Rhodobacteraceae compared to healthy-female (NW-F).