Ethical statement
The experimental protocols were approved by the Ethics Committee of The Third Affiliated Hospital of Kunming Medical University, and performed according to the guidelines of the 1975 Declaration of Helsinki. All participants involved in this study provided written informed consent.
Specimen collection
Total 20 lung cancer tissues and 20 adjacent normal lung tissues were collected from The Third Affiliated Hospital of Kunming Medical University. All subjects were born and lived in Xuanwei area for more than 3 generations, and with local bituminous coal contact history over 10 years. The pathologic diagnosis of each specimen was evaluated by a pathologist. None of the patients had received anti-tumor treatment before collecting specimens. The clinic pathological features were obtained from the medical records of lung cancer patients. All tissue specimens were stored at − 80 °C until use.
Cell culture
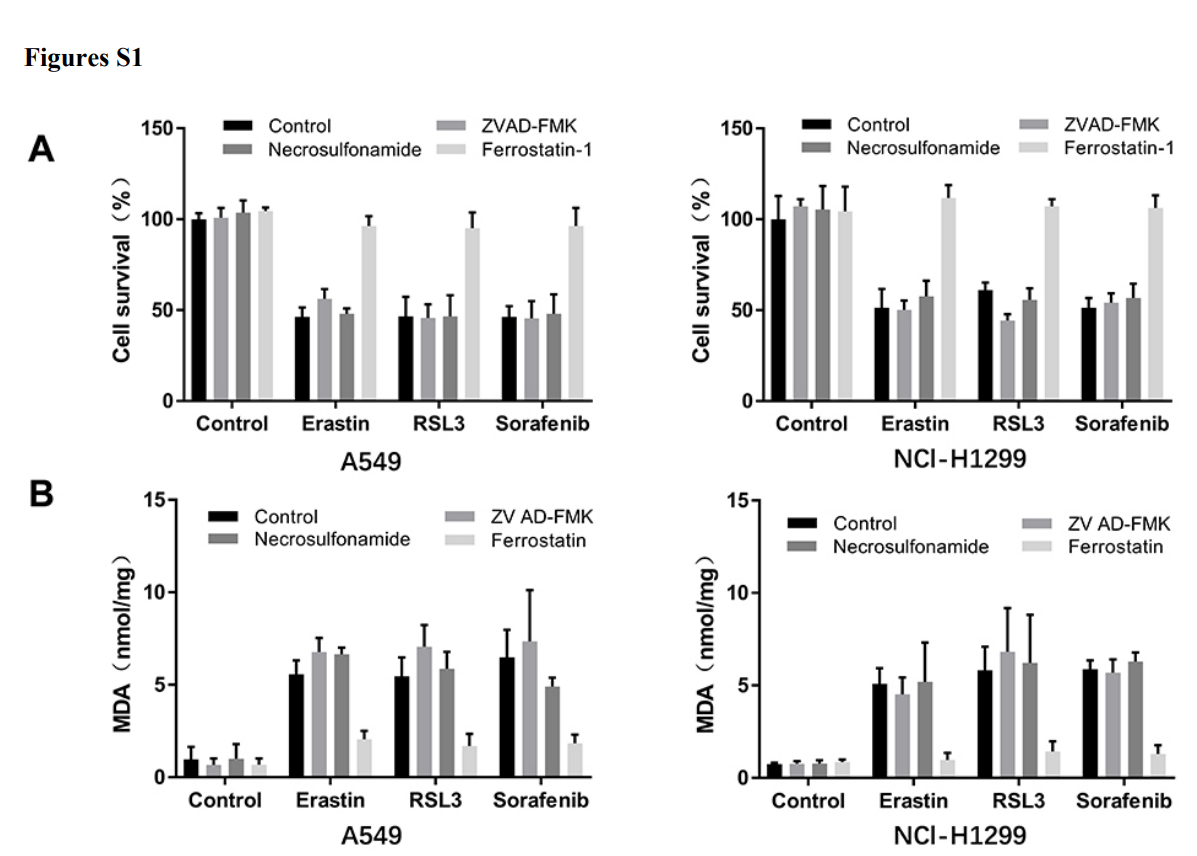
The lung cancer cell lines, A549 and NCI-H1299, were purchased from Shanghai Cellular Research Institute (Shanghai, China) and maintained in RPMI-1640 medium (ScienCell, Carlsbad, CA, USA) supplemented with 10% fetal bovine serum, 100 U/ml penicillin, 100 µg/ml streptomycin in a humidified incubator at 37C with 5% CO2.
Western blotting
The cells were treated under the indicated conditions, and then lysed with RIPA buffer at pH 8.0 (150 mM NaCl, 50 mM Tris, 1% Triton X-100, 0.5% sodium deoxycholate, 0.1% SDS). All the samples were quantified using Pierce™ bicinchoninic acid (BCA) assay (Thermo Fisher Scientific Inc., IL, USA) to ensure equal loading of proteins. The cellular protein samples were subjected to SDS-PAGE, and then transferred to a polyvinylidene difluoride membrane (Millipore, Billerica, MA, USA). After blocked with 5% BSA, the membrane was probed with the primary antibody, then incubated with HRP-conjugated secondary antibody in TBST. β-actin was used as a loading control. Proteins were visualized using an enhanced chemiluminescence solution.
Cell Viability Assay
Cell viability was determined using CCK-8 assay (Beyotime, China) following the manufacturer’s instruction.
ROS assay
For assay of ROS, the superoxide indicator dihydroethidium (DHE, Invitrogen) was added at 5 µM into cell culture medium and incubate for 1 h at 37 °C. Fluorescence was measured according to kit instructions with 485 nm excitation and 527 nm emission.
Malondialdehyde (MDA) assay
Levels of MDA, a product of lipid peroxidation, were measured based on reaction between MDA and thiobarbituric acid with commercial kit from Beyotime Biotechnology (Shanghai, China) [18]. The enzymatic activities were recorded as units per milligram of protein (U/mg protein). Values obtained were the average of three independent measurements.
Animal Experiments
All animal experiments strictly adhered to local regulations as well as LAWER (Laboratory Animal Welfare Ethics Review) guidelines (Andersen and Winter, 2017; Herrmann and Flecknell, 2018), and were approved by the local authorities before initiation.
1 × 10⁶ the indicated tumor cells in 100 µl of PBS were injected into the back of BALB/c-nu mice. The tumor volume (tv) of BALB/c-nu mice were monitored every week. The tv was calculated using the following formula: tv = ab2/2, where a is the length of the tumor, and b is the width. The tumors were separated after mice euthanizing.
High-performance liquid chromatography (HPLC) and mass spectrometry analysis
Each sample was subjected to trypsin digestion and TMT labeling. Subsequently, the digested samples were separated with a capillary HPLC system. The Q-Exactive mass spectrometer from Thermo Finnigan was used to perform data acquisition.
Samples were separated by Easy nLC system with EASY column (Thermo scientific, 10 cm × 75 µm, 3 µm C18). The column temperature was set at 25 °C and injection volume was 10 µL. The gradient elution of mobile phase was at a flow rate of 250 nL/min. The mobile phase consisted of 0.1% formic acid in water (mobile phase A) and 84% acetonitrile plus 0.1% formic acid in water (mobile phase B). The gradient elution procedure was as follows: phase B started from 0%, and then increased linearly to 35% at 50 min, and further increased to 100% at 55 min, then was held for 5 min. During the whole analysis, the samples were in an automatic 4 °C injector. The samples were analyzed randomly. QC samples were inserted into the sample queue to monitor and evaluated the stability of the equipment and the reliability of the raw data.
MS analysis was performed using a Q-Exactive mass spectrometer (Thermo Finnigan) with a nano ESI source and an orbitrap analyzer, operating in positive ion modes. The mass spectrometer recorded ions with a range of 300–1800 m/z. The dynamic exclusion duration was 40.0 s. Survey scans were acquired at a resolution of 70 000 at m/z 200, and the resolution for the HCD spectra was set to 17 500 at m/z 200. The normalized collision energy was 30 eV, and the under-fill ratio was defined as 0.1%. QC samples were checked at an interval of 7 samples to ensure stability during the whole sequence.
Data processing
Raw MS/MS spectra data were analyzed using Mascot (version 2.2, Matrix Science, London, U.K.). The search engine was set up to search the SWISS-PROT database. Scaffold Q+ (version Scaffold_4.4.5, Proteome Software, Inc., Portland, OR, United States) was used to quantify the TMT peptide. A threshold of ± 1.2-fold change with p value < 0.05 was considered as significant changes. Statistical procedure was performed with the t test. Gene Ontology (GO) annotation, including biological processes (BP), cellular components (CC), and molecular functions (MF), of the identified proteins was implemented using BLAST2TO (version 2.5), and pathway enrichment analysis of the differentially-expressed proteins was by Kyoto Encyclopedia of Genes and Genomes (KEGG) automatic annotation server.
Transmission Electron Microscopy (TEM)
The cells were washed with precooled PBS (pH 7.4) and then post-fixed in phosphate-buffered glutaraldehyde (2.5%) and osmium tetroxide (1%). The samples were then cut and stained en bloc with 2% uranyl acetate (UA), dehydrated in a graded ethanol series, and embedded in an epoxy resin. Then, the sections (70–90 nm) were stained with UA and lead citrate. Ultrastructural images were captured with a transmission electron microscope (Hitachi HT7700, Tokyo, Japan).
Statistical analysis
SPSS 20.0 statistical software (SPSS, Chicago, IL, USA) was used for data analysis. The indexes were analyzed by one-way ANOVA. Differences were set as significant at P < 0.05.