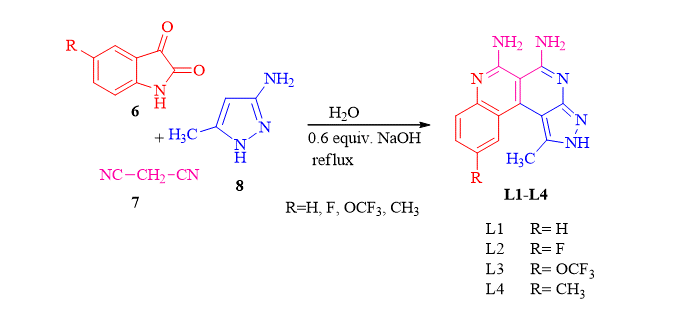
The benzo[c]pyrazolo[2,7]naphthyridine based chemosensors were synthesized as shown in scheme 1. The isatin 6 react with malononitrile 7 via Knoevenogel condensation to form arylidene. The formed arylidene then reacted with 3-amino-5-methylpyrazole 8 to synthesize the spiro-intermediates which then undergo basic hydrolysis, cyclization, decarboxylation and aromatization to form target naphthyridine receptors (L1–L4) 31.
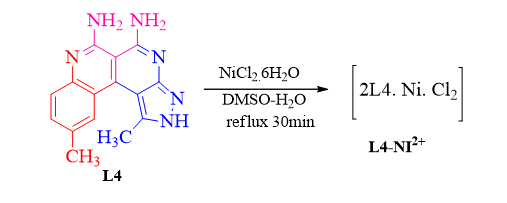
The Ni2+ complex of receptor L4 was synthesized by mixing Ni2+ salt with L4 using 1:2 ratio in DMSO-H2O solvent mixture. The yellow solution of the ligand immediately turned to red colored solution. The solution was further refluxed to get the solid product (Scheme 2).
Spectrophotometric studies of L1–L4
The chemosensor study of L1–L4 towards various metal ions (Al3+, Ca2+, Cd2+, Co2+, Cr3+, Cu2+, Fe3+, Hg2+, K+, Mg2+, Mn2+, Na+, Ni2+, Pb2+, Sr2+ and Sn2+) were investigated by UV-visible spectroscopy. The preliminary colorimetric experiments revealed that addition of one equivalent of metal ions (1x10⁻³ M) to solution of L1–L4 (1x10⁻³ M) in DMSO–H2O (v/v 1:2), HEPES buffer of pH = 7.4 at room temperature resulted in distinct visual color change from yellow to red by addition of Ni2+ and no color change was observed for other metal ions (Al3+, Ca2+, Cd2+, Co2+, Cr3+, Cu2+, Fe3+, Hg2+, K+, Mg2+, Mn2+, Na+, Pb2+, Sr2+ and Sn2+) Figure 2.
The binding interaction of L1–L4 with different metal ions was further monitored by investigating UV-visible absorption spectral changes and shown in Table 1.
Table 1: UV-visible spectral bands of receptor L1-L4 with addition of nickel (II).
|
Receptor
|
UV-visible spectral band (nm)
|
Nickel addition
|
|
L1
|
273, 283, 398, 440
|
535 nm
|
|
L2
|
274, 286, 384, 443
|
538 nm
|
|
L3
|
261, 287, 380, 450
|
550 nm
|
|
L4
|
273, 285, 396, 438
|
537 nm
|
The UV-visible spectra of model receptor L4 showed a remarkable bathochromic shift in absorption spectrum at 537 nm which is in good agreement with color change, may possibly be ascribed to fast metal-ligand binding kinetics and high thermodynamic affinity of Ni2+ for N-donor ligands32. The other examined metal ions did not exhibit any distinct spectral changes in UV-visible spectrum at 537 nm under identical conditions. Similar pattern of absorption spectral changes were observed for L1-L3 (Figure S1-S3).
The coordination between receptor L4 and Ni2+ was further ratified by UV-visible absorption spectral titrations involving sequential addition of Ni2+ (0-12 µM) to L4 (20 µM). It was observed that intensity of absorption bands at 537 nm and 438 nm increased while the absorption bands at 396 nm and 376 nm began to decrease until it reached its limiting value. Moreover emergence of isosbestic points at 365 nm and 410 nm during spectral titrations indicate the formation of stable complex with some stoichiometric ratios between L4 and Ni2+ 33 (Figure 3). The similar coordination behavior was observed for L1-L3 (Figure S4-S6). These results suggest that receptors L1-L4 could be employed as colorimetric and ratiometric sensor for Ni2+ and discriminating among different transition metal ions (Fe3+, Cu2+, Co2+, Pb2+, Hg2+) which are normally difficult to differentiate.
The binding stoichiometry of the complexes were further explored by Job’s continuous variation method34 by plotting mole fraction versus changes in absorption intensity at 535 nm for L1, 538 nm for L2, 550 nm for L3 and 537 nm for L4, respectively. The Job’s plot (Figure S7) indicate maximum value at 0.7 corresponding to the formation of complex with 2:1 stoichiometry between L1–L4 and metal ions Ni2+.
The association constant Ka of receptors L1–L4 with Ni2+ were determined by Benesi–Hildebrand equation 35 (Figure S8) and are listed in table 2. It has been clear that the association constant values are in range of those 103-106 reported for Ni2+ sensing chemosensors 36. The comparison of Ka values shows that L4- Ni2+ complex is stronger than the other receptor complexes.
Table 2: Association constant values and detection limit of receptor L1-L4 with nickel (II).
|
Receptor
|
Association constant M-1
|
Detection limit
(3SB/S) M
|
Detection limit
(Naked eye) M
|
|
L1
|
2.3 x 10³
|
5.62 x 10⁻⁷
|
1 x 10⁻⁵
|
|
L2
|
1.0 x 10⁴
|
5.56 x 10⁻⁷
|
1 x 10⁻⁵
|
|
L3
|
2.6 x 10⁴
|
3.88 x 10⁻⁷
|
1 x 10⁻⁵
|
|
L4
|
3.2 x 10⁴
|
2.43 x 10⁻⁷
|
1 x 10⁻⁶
|
The detection limit of L1–L4 for Ni2+ as colorimetric sensors were determined both by naked eye and absorption spectral changes. The results are shown in Table 2. For naked eye detection, the receptor L4 showed a distinct color change at minimum concentration of 1 x 10⁻⁶ M for Ni2+ (Figure 4/S9). Moreover, the detection limit determined by absorption spectral changes on the basis of 3SB/S 37 for L4 and Ni2+ was found to be 2.43 x 10⁻⁷ M. This value is five times lower than EPA drinking water guidelines 1.2 x 10⁻⁶ M for Ni2+ 38 and revealed that L4 is highly efficient in sensing Ni2+ even at minute level.
The possible binding mode of receptor L4 and Ni2+ in the complex showed that the nitrogen atoms of naphthyridines coordinates Ni2+in 2:1 ratio and showed bathochromic shift in absorption spectra that can be rationalized by ICT 32. The coordination of Ni2+ to the nitrogen of naphthyridine moiety increases its electron withdrawing character which showed stronger ICT from electron donating methyl group to metal complex moiety.
ESI-MS and IR titrations
The coordination mechanism of L4 was further explored by ESI-MS and IR titration experiments. The ESI mass spectra of L4 showed the appearance of peak at m/z 279.17 corresponds to [L4+ H]+. The titration of L4 with Ni2+ showed the signal at m/z 685.58 for [2L4+Ni+Cl2]+ ions indicating the formation of 2:1 stoichiometry between L4 and Ni2+ (Figure S10).
FT-IR titrations were performed by using Bruker Alpha FT-IR and Figure 5 showed comparison of IR spectra of L4 before and after the addition of Ni2+. The sharp peaks present at 3420, 3294 and 3109 cm-1 due to NH stretching frequencies in free receptor L4 were broadened by adding Ni2+, suggesting the involvement of NH2 group in coordination with Ni2+ to form complex. 39
Metal ion selectivity
An important feature of receptor L4 is to examine its selectivity towards analyte by competitive titration experiments (Figure 6). The intensity of absorption band at 537 nm due to complex formation of L4-Ni2+ is not disturbed at all in the presence of other metal ions (Al3+, Ca2+, Cd2+, Co2+, Cr3+, Cu2+, Fe3+, Hg2+, K+, Mg2+, Mn2+, Na+, Pb2+, Sr2+ and Sn2+). Thus receptor L4 shows excellent binding affinity for Ni2+ in other physiological samples where Cu2+, Co2+, Fe3+, Hg2+ and Pb2+ usually coexist with analyte. This distinct selectivity for Ni2+ may be due to suitable conformation of receptor and ionic radius of Ni2+ 13.
The UV-visible absorption spectra of L4- Ni2+ complex with various anions was recorded to check the stability of complex, no change in absorption band at 537 nm was observed (Figure 7). This clearly depict that the stability of complex is unaffected in the presence of various anions.
pH effect study
In order to investigate the effect of pH on absorption response of receptor L4 to Ni2+, a series of solution with pH value ranging from (2.0 – 12.0) were prepared (Figure S11).
At pH 2.0–3.0, the receptor L4 has no substantial response to Ni2+ in absorption spectroscopy. The absorption at 537 nm is maximum and constant in pH range 7.0 – 8.0 and above pH 8.0, absorbance decreased gradually. The results warranted its biological and environmental applications at physiological pH. The color of L4– Ni2+ complex remained red between pH 4–11, which indicate that Ni2+ could be clearly detected over a wide range of pH 4–11.
Reversibility of receptor L4
The reversibility of receptor L4 towards Ni2+ was examined by adding ethylenediaminetetracetic acid (EDTA, 1 equiv.) to the complexed solution of L4 and Ni2+ (Figure 8). The solution color changed from red to light yellow (original color of L4). Upon addition of Ni2+ again the absorbance at 537 nm was recorded. The absorption changes in spectral bands were reversible even after several cycles with alternative sequential addition of Ni2+ and EDTA. These results indicate that receptor L4 could be recyclable through reagent EDTA. Such regeneration and reversibility could be valuable for the fabrication of sensors to sense Ni2+.
Fluorescence study
The fluorescence study of L4 via fluorescence titrations were examined at room temperature and exhibited emission maximum at 470 nm (λex = 390nm). The sequential addition of Nli2+ (0 – 12 µM) to the receptor L4 caused a reasonable decrease of emission intensity in emission maxima at 470 nm and gave bounteous information regarding “turn-off” behavior of receptor (Figure 9). The quenching of fluorescence (CHEQ) may be due to coordination of Ni2+ with NH2 group of receptor L4 as amine group loses its donating ability to fluorophore and emission potential is quenched 40.
Chemistry synthesized of L4– Ni2+ complex
The synthesized complex of L4–Ni2+ was characterized in terms of molar conductance, SEM and ESMIS analysis. The 10-3 M solution of L4–Ni2+ complex exhibited molar conductance value of 0.4 S cm2 M-1 which suggest its non-electrolyte behavior in DMSO solution. Furthermore, SEM analysis was carried out to get better understanding of morphological difference before and after the addition of Ni2+ to L4 receptor (Figure 10). SEM images of receptor L4 has dense sprinkled elliptical shape like structure which has been transformed into rough stone like structure after complexation with Ni2+. The ESI-MS of synthesized L4–Ni2+ complex (Figure S12) showed the molecular ion peak at m/z 685.58 which resembled very well with experimental molar mass of [2L4+Ni+Cl2] complex.
Practical application
In order to investigate the potential use of newly synthesized receptor L4 in real water samples, a calibration curve was drawn, which showed good linear relationship (R2 = 0.9996, n = 3) between the absorbance of L4–Ni2+ complex and Ni2+ concentration (0–5 µM) at 537 nm (Figure 14/S11).
The receptor L4 was used for estimation of Ni2+ in drinking water, tap water and industrial waste water samples (Table 3). All water samples were analyzed in triplicate with good recoveries and RSD values. The results indicate that receptor L4 is highly specific and sensitive for Ni2+ estimation in environmental samples.
Table 3: Determination of Ni2+ in water samples
|
Sample
|
Ni2+ added (µM)
|
Ni2+ found (µM)
|
Recovery (%)
|
RSD (n = 3) %
|
|
Drinking water
|
0.00
1.00a
|
0.00
0.98b
1.00c
|
98.0
|
1.97
|
|
Tap water
|
0.00
1.00a
|
0.00
0.97b
1.00c
|
97.0
|
2.34
|
|
Industrial waste water
|
0.00
1.00a
|
0.00
0.96b
0.99c
|
96.0
|
3.04
|
a = 1.00 µM of Ni2+ was spiked artificially.
b = Results obtained by newly synthesized receptor L4.
c = Results obtained from ICP-OES.
To explore another application of receptor L4, test kits were prepared by immersing filter paper in receptor L4 (1x10⁻³ M, HEPES buffer, pH = 7.4) and then air dried to check the suitability of “dip-stick” method for detection of Ni2+. When the prepared test strips were immersed into water solution of Ni2+ with different concentrations, clear color change from yellow to red was observed (Figure 11). The results showed that discernible concentration of Ni2+ can be as low as 1x10⁻⁵ M. The development of “dip-stick” method did not require any additional equipment for detection of Ni2+ and showed extreme attraction “in-the-field” measurements.