Phenotype and physiological changes of tea leaves under AT and SD
To investigate the phenotype changes of tea plants treated with exogenous ABA and drought, their stress phenotypes (displayed visible morphological changes) were photographed. The results showed that a number of wilted and curled leaves were observed under SD (Figure 1). While the wilted and curled leaves were remarkably relieved under AT, indicating that the exogenous ABA partly relieved the damage and maintained the growth of tea plants under drought stress.
To assess the effects of exogenous ABA on physiological characterization of tea leaves, we detected several physiological indexes of tea leaves during drought stress. As shown in Table 1, the content of total chlorophyll decreased as the duration of the drought treatment increased under AT and SD, but it was higher under AT than that under SD. The value of maximum quantum yield of PSII (Fv/Fm) also showed similar changes. The content of MDA increased as the duration of the drought treatment increased under AT and SD, but it was lower under AT than that under SD. The results indicated that the exogenous ABA could reduce lipid peroxidation, prevent the degradation of chlorophyll and maintain photosynthesis of tea leaves under drought stress. In addition, the contents of three endogenous hormones and the activities of four antioxidant enzymes were also measured, suggested that the exogenous ABA could affect the changes of endogenous hormones and antioxidant enzymes of tea leaves under drought stress.
Table 1 Physiological indexes of tea leaves during drought stress
|
Parameters
|
CK
|
MD
|
AT
|
SD
|
|
MDA(nmol/g)
|
46.25 ± 0.88 b
|
43.87 ± 0.88 b
|
47.54 ± 0.92 ab
|
51.85 ± 2.01 a
|
|
CAT(U/g)
|
98.48 ± 3.29 a
|
80.21 ± 1.75 c
|
82.76 ± 1.72 bc
|
89.01 ± 1.80 b
|
|
POD(U/g)
|
105.09 ± 3.09 a
|
110.33 ± 2.63 a
|
89.17 ± 0.92 b
|
86.18 ± 0.64 b
|
|
APX (μmol/min/g)
|
1.55 ± 0.05 a
|
0.6186 ± 0.01 c
|
0.68 ± 0.02 c
|
0.9517 ± 0.04 b
|
|
GR (μmol/min/g)
|
483.26 ± 2.81 bc
|
433.22 ± 16.81 c
|
536.16± 16.96 ab
|
594.06 ±25.23 a
|
|
ABA(μg/g)
|
0.4669 ± 0.0194 b
|
0.533 ± 0.024 b
|
2.6333 ± 0.031 a
|
0.4473 ± 0.018 b
|
|
IAA(μg/g)
|
0.6124 ± 0.0113b
|
0.8129 ± 0.0338a
|
0.6303 ± 0.0158b
|
0.5862 ± 0.0124b
|
|
GA3(μg/g)
|
0.495 ± 0.0393 d
|
0.6711 ± 0.0417 c
|
0.9108 ± 00397 b
|
1.1986 ± 0.0996a
|
|
FV/FM
|
0.83±0.21 a
|
0.79±0.19 ab
|
0.73±0.18 b
|
0.65±0.57 c
|
|
Chl content(mg/g)
|
3.17±0.33 a
|
3.01±0.27 ab
|
2.88±0.12 ab
|
2.46±0.21 b
|
The date in the table are represented as the mean ± standard deviation of three biological replicates, lowercase letters indicated statistical significance—samples not sharing a letter differed significantly according to Duncan test at P < 0.05.
The analysis of Transcriptome
To explore the transcript events of exogenous ABA on tea plants under drought, the sample leaves of CK, MD, AT and SD were conducted to RNA-seq analysis. A total of 619,817,958 clean reads were obtained from 12 RNA-Seq libraries. The Q30 percentage were over 92.54%, and the average GC content was over 44.52%. Overall, the results indicated that the RNA-Seq datasets were robust quality and could be used for further analysis (Supplementary Table S2).
A total of 2,210 DEGs (1,361 up- and 849 down-regulated) were obtained in AT/MD, 13,007 DEGs (6465 up- and 6542 down-regulated) were obtained in SD/MD, 9,238 DEGs (5006 up- and 4232 down-regulated) were obtained in AT/SD (Figure 2). The results revealed exogenous ABA can effectively relieve the drought stress of tea plants and decrease the expression amounts of response genes to drought.
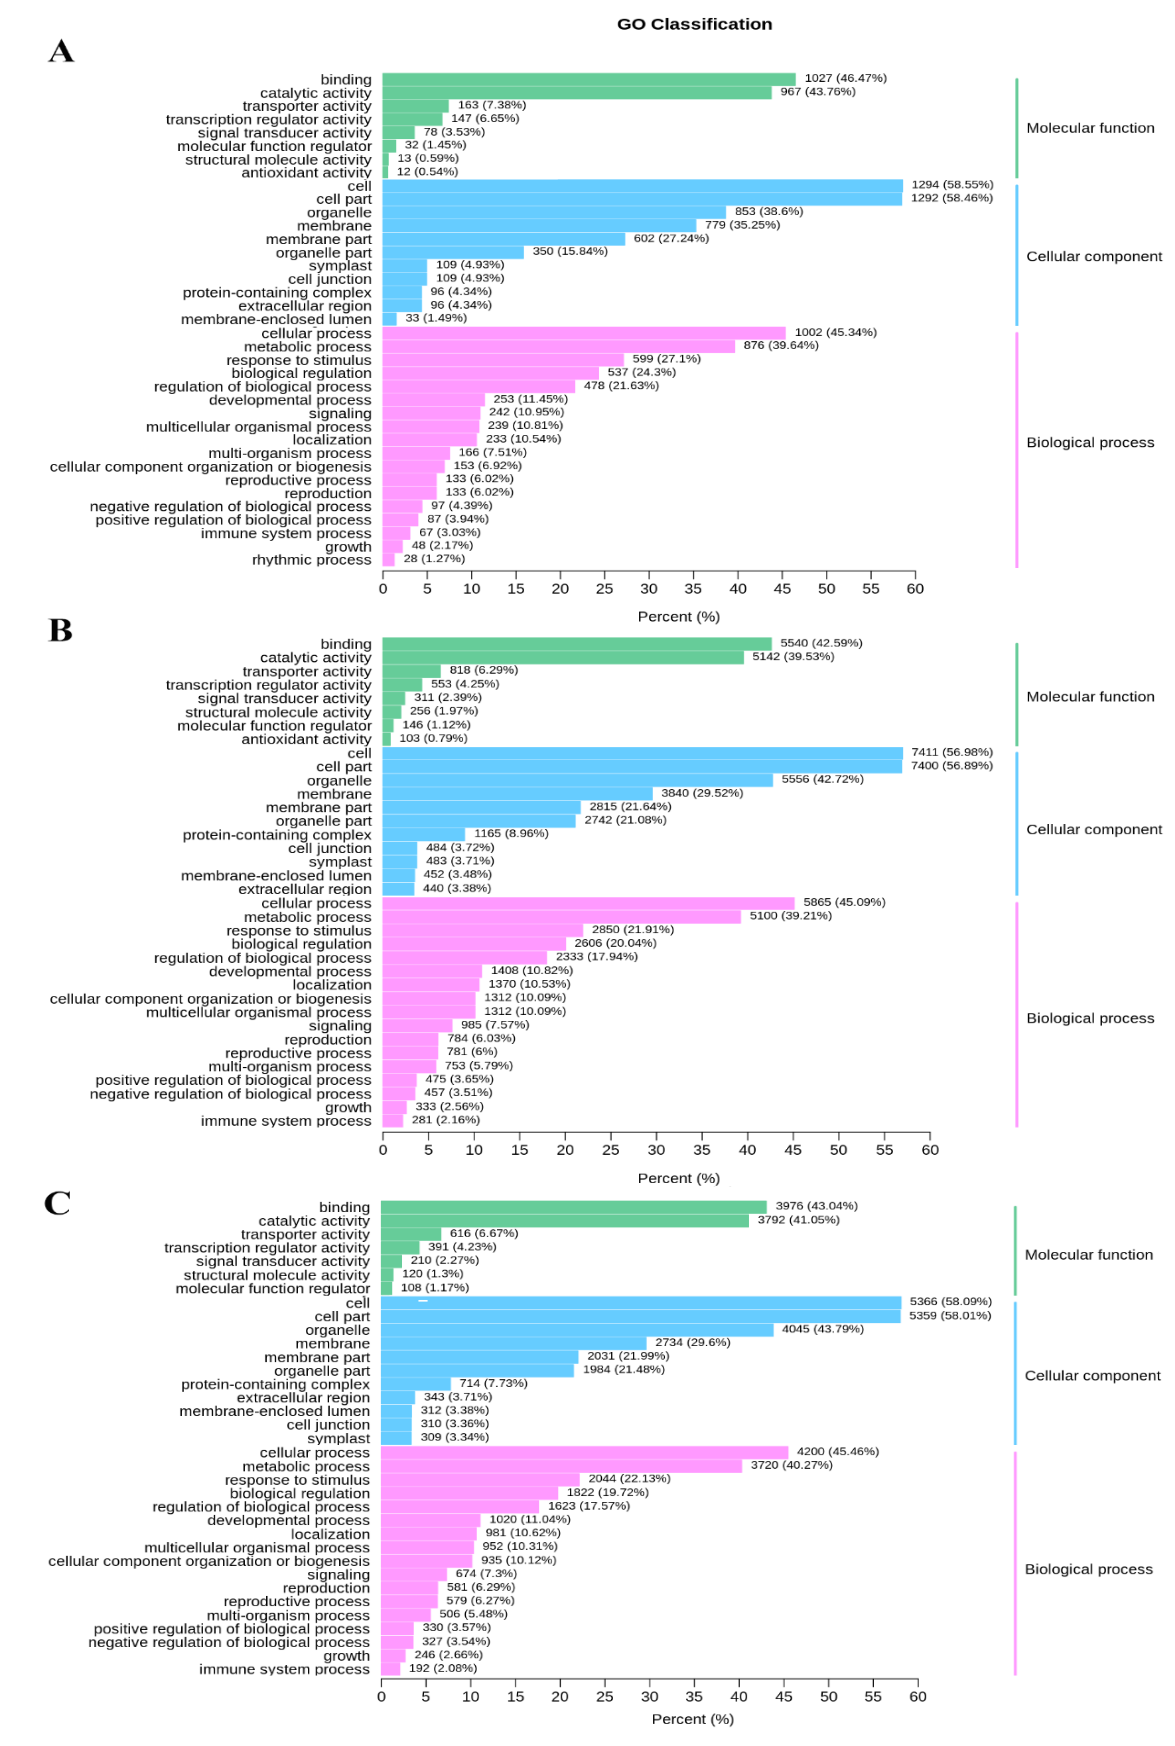
GO analysis of the above DEGs revealed that the highly enriched terms of the biological process category were ‘cellular process’, ‘metabolic process’, ‘biological regulation’ and ‘response to stimulus’. Within the cellular component category, the highly enriched terms were ‘cell’, ‘cell part’ and ‘organelle’. Within the molecular function category, the highly represented terms were ‘binding’, ‘catalytic activity’ and ‘transporter activity’ (Supplementary Fig S1).
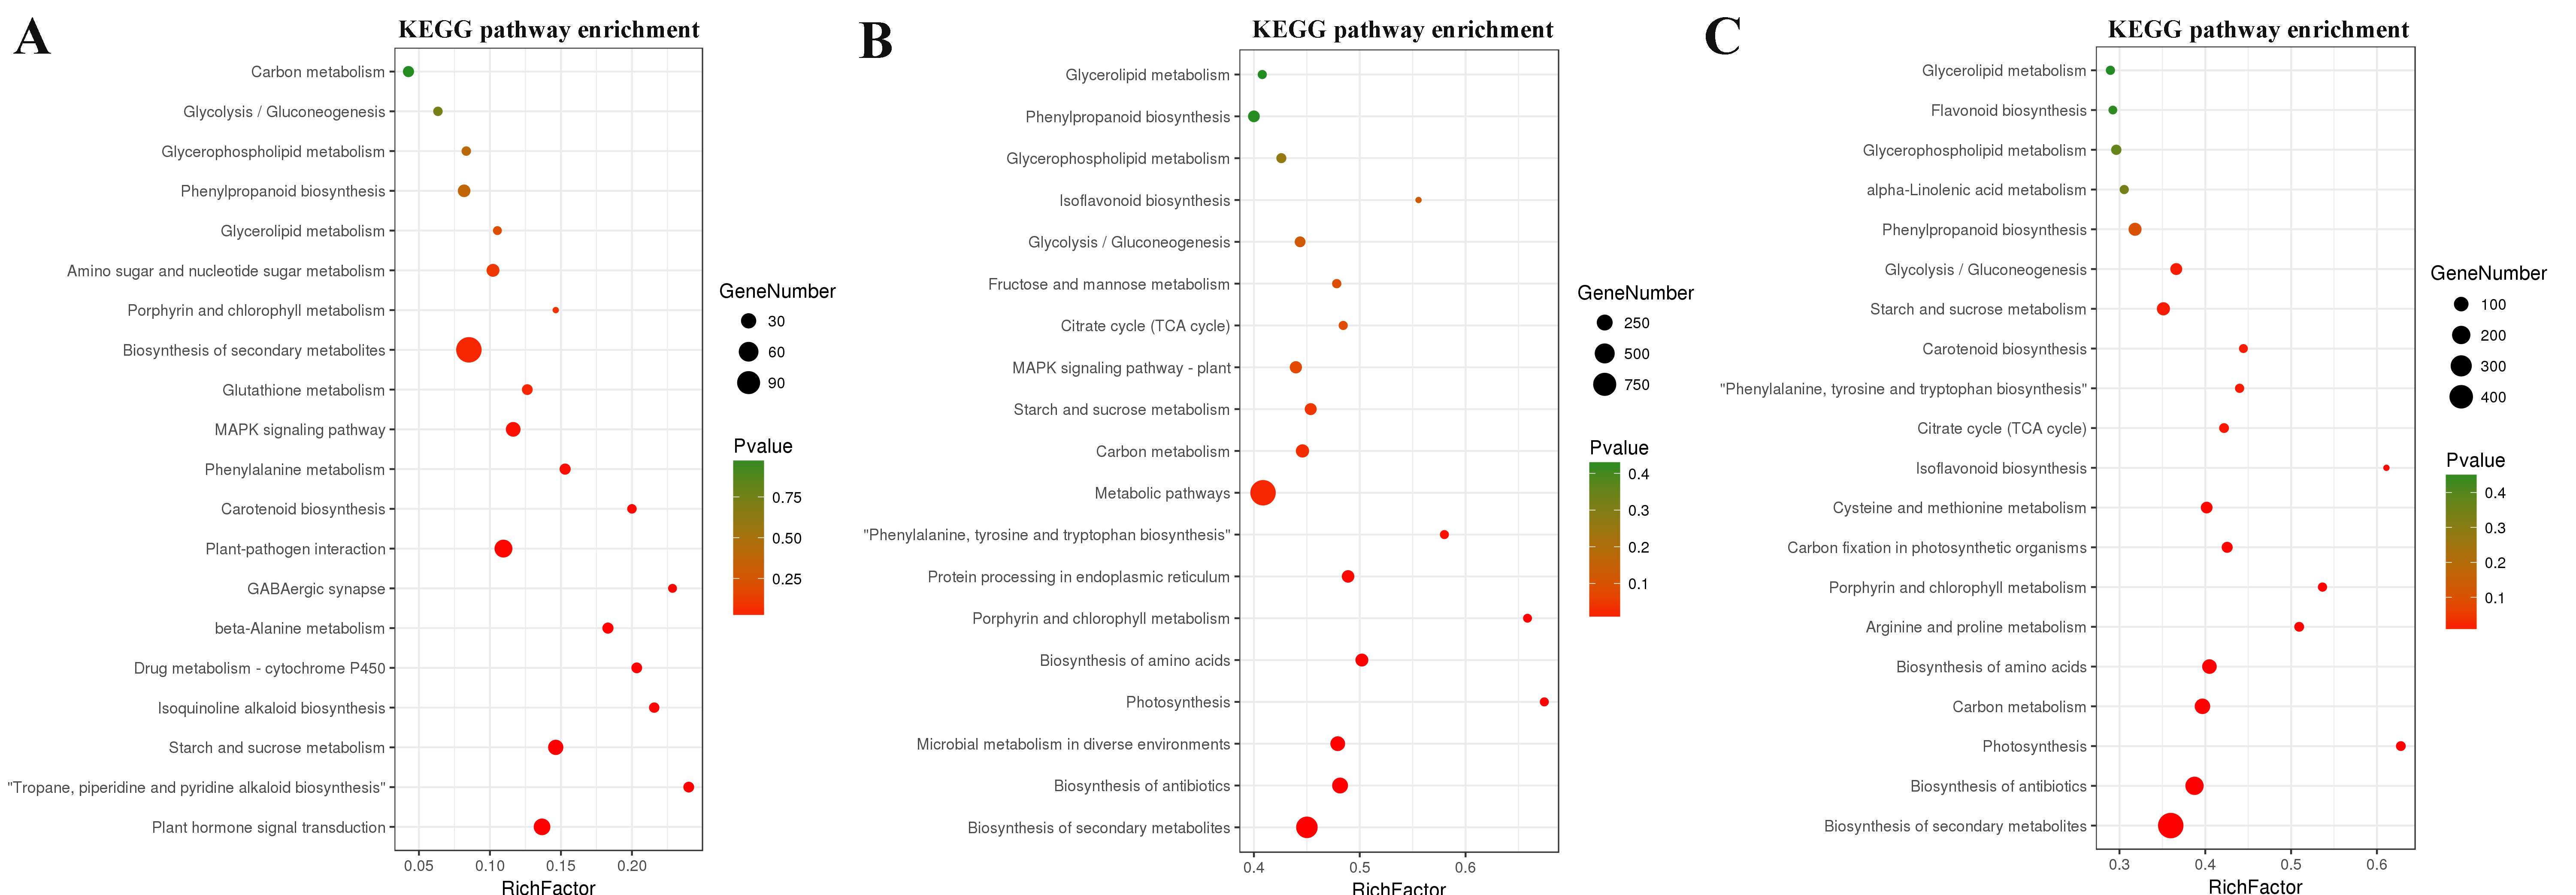
KEGG pathway enrichment analysis revealed that the DEGs in AT/MD were mainly enriched in starch and sucrose metabolism, porphyrin and chlorophyll metabolism, lipid metabolism,plant-pathogen interaction, plant hormone signal transduction. The DEGs in SD/MD were mainly enriched in photosynthesis, biosynthesis of amino acids, biosynthesis of secondary metabolites, starch and sucrose metabolism. And the DEGs in AT/SD were mainly enriched in starch and sucrose metabolism, lipid metabolism,glycolysis and citrate cycle (Supplementary Fig S2).
The effect of exogenous ABA on chlorophyll metabolism and photosynthesis of tea plants under drought stress
To investigate the effect of exogenous ABA on primary metabolism of tea plants under drought stress, we mainly analyzed the expressions of genes related to chlorophyll metabolism, photosynthesis, starch and sucrose metabolism, TCA cycle, glycolysis and lipid metabolism.
For chlorophyll metabolism, the expressions of genes involved in chlorophyll synthesis were down-regulated in SD/MD, but unchanged or slightly down-regulated in AT/MD. For example, CHLS (chlorophyll synthase), PPS (porphobilinogen synthase) and UPD (uroporphyrinogen decarboxylase) were significantly down-regulated in SD/MD, but unchanged in AT/MD. CAO (chlorophyllide a oxygenase) was down-regulated by 3.55-fold in SD/MD, but it was only down-regulated by 2.01-fold in AT/MD. For photosynthesis, the expressions of key genes related to photosynthesis showed similar trends between AT/MD and SD/MD. For example, Rubisco small subunit (CSA018690) were significantly down-regulated by 5.143-fold in SD/MD, but unchanged in AT/MD. Rubisco (CSA035231) was down-regulated by 2.824-fold in SD/MD, but it was only down-regulated by 1.337-fold in AT/MD (Supplementary Table S3).
The effect of exogenous ABA on energy metabolism and amino acid metabolism of tea plants under drought stress
As for starch and sucrose metabolism,the genes involved in starch synthase were significantly down-regulated in SD/MD, but unchanged or slightly down-regulated in AT/MD under drought stress, including AGPase (ADP-glucose pyrophosphorylase), SS (starch synthase), GBSS (granule-bound starch synthase), SBE (starch-branching enzyme). While the starch degradation-related genes were up-regulated in SD/MD, but unchanged or slightly up-regulated in AT/MD under drought stress, including AMY (α-amylase) and BAM (β-amylase). Similarly, four SPS genes (sucrose-phosphate synthase) involved in sucrose synthesis were down-regulated in SD/MD, but unchanged or slightly down-regulated in AT/MD. While the sucrose degradation-related genes were obviously up-regulated in SD/MD, but unchanged or slightly up-regulated in AT/MD, such as INV (invertase) (Figure 3, Supplementary Table S3).
Regarding the glycolysis and TCA cycle, most of genes involved in glycolysis and TCA cycle were significantly up-regulated in SD/MD, but unchanged or slightly up-regulated in AT/MD under drought stress, including HK (hexokinase), PK (pyruvate kinase), PFK (phosphofructokinase), PGAM (phosphoglycerate mutase) in glycolysis;ACLY (ATP citrate synthase), CS (citrate synthase), Aconitase (aconitate hydratase),IDH (isocitrate dehydrogenase), SCS (succinyl-CoA synthetase) in TCA cycle.
Regarding the amino acid metabolism, the expressions of most genes were significantly up-regulated in SD/MD, but unchanged or slightly up-regulated in AT/MD under drought stress, including TAT (tyrosine aminotransferase), ADH (arogenate dehydrogenase), GAD (glutamate decarboxylase), GOGAT (glutamate synthase), ASNS (asparagine synthase).
The effect of exogenous ABA on lipid metabolism of tea plants under drought stress
To investigate the effect of exogenous ABA on lipid metabolism of tea plants, we mainly analyzed the expressions of genes involved in lipid metabolism under drought stress. A total of 81 DEGs related to lipid metabolism were selected, of which 40 DEGs were clearly up-regulated in SD/MD, but unchanged or slightly up-regulated in AT/MD, including DGK (diacylglycerol kinase), FATB (fatty acyl-ACP thioesterase B), EKI (ethanolamine kinase), PLD1/2 (phospholipase D1/2). In addition, 39 DEGs were significantly down-regulated in SD/MD, but unchanged or slightly down-regulated in AT/MD under drought stress, including LOX2S (lipoxygenase), OPR (12-oxophytodienoic acid reductase), PSD (phosphatidylserine decarboxylase), PTDSS (phosphatidylserine synthase). In addition, the LYPLA (lysophospholipase) and LOX1_5 (linoleate 9S-lipoxygenase) were found to be only up-regulated in AT/MD.
The effect of exogenous ABA on phenylpropanoid and flavonoid metabolism of tea plants under drought stress
To investigate the effect of exogenous ABA on phenylpropanoid and flavonoid metabolism of tea plants, we analyzed the expressions of genes involved in phenylpropanoid and flavonoid biosynthesis under drought stress (Figure 4, Supplementary Table S3). The results showed that the vital genes related to phenylpropanoid biosynthesis were highly up-regulated in SD/MD, but unchanged or slightly up-regulated in AT/MD under drought stress,such as CAD(cinnamyl-alcohol dehydrogenase),4CL (4-coumarate-CoA ligase),F5'H (ferulate-5-hydroxylase), PAL (phenylalanine ammonia-lyase). While the key genes related to flavonoid biosynthesis were significantly down-regulated in SD/MD, but unchanged or slightly down-regulated in AT/MD under drought stress, including F3'H (flavanone-3-hydroxylase), CHS (chalcone synthase), CHI (chalcone isomerase), FLS (flavonol synthase), DRF (dihydroflavonol 4-reductase) and F3'5'H (flavonoid 3',5'-hydroxylase).
Analysis of drought-responsive transcription factors (TFs)
Transcription factors (TFs) play a key role in the regulation of gene expression under abiotic and biotic stresses in plants. The results showed that more than 50 TFs families were regulated in SD/MD and in AT/MD, implying their important roles in regulating genes involved in drought responses. In which, These TFs, including WRKY, AP2-ERF, NAC, MYB, HSF, bHLH and bZIP, were related to resistance to abiotic and biotic stresses. The result showed that the expressions of the genes encoding these TFs were significantly down/up-regulated in SD/MD, but unchanged or slightly down/up-regulated in AT/MD under drought stress (Supplementary Table S4).
To validate the accuracy and repeatability of transcriptome sequencing data,ten DEGs were randomly selected to validate the RNA-seq data by qRT-PCR (Figure 5). The results showed the similar expression patterns between RNA-seq and qRT-PCR, suggesting that the RNA-seq data are reliable.
Metabolic differences of flavonoids and lipid metabolism under AT and SD
To investigate the effects of exogenous ABA on metabolites of tea leaves in response to drought stress, the leaves of CK, MD, AT and SD were conducted to LC-ESI-MS/MS analysis. A total of 65 DEMs (43 up- and 22 down-regulated) were obtained in AT/MD, 90 DEMs (54 up- and 36 down-regulated) were obtained in SD/MD, and 81 DEMs (31 up- and 50 down-regulated) were obtained in AT/SD (Figure 6). Interestingly, the abundances of most flavonoids were markedly increased, while the abundances of most lipid metabolites were markedly decreased in AT/MD compared to those in SD/MD.
For the flavonoids, the most compounds (flavone, flavanone, flavonol, isoflavone and anthocyanins) were obviously increased in AT/MD (Figure 4). Especially, the abundances of sakuranetin in flavone showed 13.15- and 11.06-fold increase in AT/MD and SD/MD, respectively. The levels of prunetin, acacetin, laricitrin and syringetin were only increased in AT/MD. The levels of apigenin O-malonylhexoside, delphinidin 3-O-glucoside and cyanidin 3-O-rutinoside were significantly decreased in SD/MD. In addition, the levels of kaempferol, kaempferitrin, 4-methylcatechol, cyanin and fustin were higher in AT/MD than that in SD/MD. =3
For the lipid metabolites (Table 2), 38 metabolites involved in fatty acids, glycerolipids and glycerophospholipids metabolisms were markedly changed under drought stress. Especially, LysoPS 22:6 showed higher abundance with 11.57- and 10-fold increase in SD/MD and AT/MD, respectively. In addition, the levels of LysoPE 14:0, LysoPE 16:0, LysoPE 18:0, LysoPE 18:1, LysoPE 18:2 (2n isomer), LysoPC 15:1, LysoPC 16:0 and LysoPC 17:0 increased significantly in SD/MD. The levels of PC 16:1/14:1 and 13-HOTrE were only increased in AT/MD. In addition, 13 metabolites were only increase in SD/MD, such as, LysoPC 18:0 (2n isomer), LysoPC 18:2 (2n isomer) and MAG (18:1) isomer2.
Interaction network analysis between genes and metabolites
Gene-metabolite interaction networks could be used to help understand functional relationship and to aid in identifying new regulatory elements [13]. Here, Pearson correlation tests were carried out between differentially expressed genes and metabolites related to flavonoids and lipid metabolism.
For phenylpropanoid and flavonoid biosynthesis, both 113 DEGs and 22 DEMs related to phenylpropanoid and flavonoids biosynthesis were carried out pearson correlation analysis. The result showed that 43 DEGs had strong positive and negative correlation coeffcient values (R2 > 0.8 or < -0.8 and P-value < 0.05) with 12 metabolites (Supplementary Table S5). For example, there was significantly positive correlation between the gene expression (CCR, DFR, CHI3, PER42) and metabolite abundances (gallocatechin, apigenin O-malonylhexoside, delphinidin 3-O-glucoside), but there was significantly negative correlation between the gene expression (CAD) and metabolite abundances (apigenin O-malonylhexoside, gallocatechin, dihydromyricetin and mirtillin).
For lipid metabolism, both 81 DEGs and 38 DEMs related to lipid metabolisms were carried out pearson correlation analysis, the result showed that 56 DEGs had strong positive and negative correlation coeffcient values (R2> 0.8 or < -0.8 and P-value < 0.05) with 34 metabolites (Figure 7, Supplementary Table S6). Further analysis indicated that there was significantly positive correlation between the expressions of eight key genes and abundances of most lipid metabolite, including DGK1/2 (diacylglycerol kinase1/2), FATB (fatty acyl-ACP thioesterase B), EKI (ethanolamine kinase), ACAA1 (acetyl-CoA acyltransferase 1), GPX(glutathione peroxidase), EPHX2 (soluble epoxide hydrolase), LPT1(lysophospholipid acyltransferase1). There was significantly negative correlation between the expressions of two genes and abundances of most lipid metabolite, including LPCAT (lysophosphatidylcholine acyltransferase) and ALDH (aldehyde dehydrogenase).