Background: This study is aimed at identifying the factors associated with the self-management practices of type 2 diabetes among the middle-aged population of rural area of Pakistan. . Methods: The sample of participants was purposively recruited from the medical clinic of rural area of Pakistan. The participants (n=200) recruited were asked to complete the questionnaire following their informed consents. The study questionnaire consisted of three main sections: socio-demographics, the Urdu-version of Summary of Diabetes Self-care Activities (U-SDSCA), and the extended version of U-SDSCA. In addition, glycosylated hemoglobin (HbA1c) level results were obtained from the medical clinic. The study explored the factors associated with the self-management practices of type 2 diabetes among the middle-aged population of rural area of Pakistan. Results: The current study has demonstrated that self-management activities level among the patients of type 2 diabetes in the rural area of Pakistan was not achieved in majority of patients, and that glycemic control was unsatisfactory. The medications sub-scale mean (Mean: 6.17 ± 1.18 SD) was the highest among all the U-SDSCA instrument sub-scales. The results of blood glucose monitoring subscale revealed that longer duration of diabetes ≥8 years) was associated significantly with poor glycemic control (Diff= -.299; p = .120). The multivariate regression analysis revealed that the participants’ characteristics accounted for 21% of the variability in the total self-management score (R²=0.211). In addition, women were more inclined to undertake appropriate diabetes self-management activities (β .302; p = .001). Conclusion: This study has identified the factors associated with the self-management activities among the patients with type 2 diabetes in rural area of Pakistan. In order to overcome the influence of these factors, healthcare professionals should pay special attention to the patients of middle-aged population of rural area of Pakistan and provide them educational programme that emphasizes lifestyle modification with importance of adherence to treatment and encourage them to make diabetes self-management activities as part of their day to day life.
Research article
Factors associated with the self-management practices of Type 2 diabetes among the middle-aged population of rural area of Pakistan
https://doi.org/10.21203/rs.2.14605/v2
This work is licensed under a CC BY 4.0 License
Version 2
posted
You are reading this older preprint version
Diabetes mellitus is one of the leading chronic diseases which is causing a great deal of health issues to the population all over the world (1). The estimation of the International Diabetes Federation (IDF) in 2014 showed that there are 371 million people suffering from diabetes in the world (2) and Type 2 diabetes is more prevalent among people aged between 40 and 59 years (2, 3).
Type 2 diabetes is also a major public health problem in Pakistan especially among middle-aged population between 40 to 60 years. This population is at high risk of type 2 diabetes because people are more likely to be overweight or obese, physically inactive and have unhealthy eating habits with sedentary lifestyle (1, 2). In addition, the region of Pakistan has a population with many social and health disparities contributing to the high rates of diabetes and obesity (3 - 6).
The population of Pakistan has two levels of trends in morbidity namely the macro level and micro level which has triggered changes to primary health care in this population. At a macro level, the trends included an increase in ageing population with chronic and complex diseases and require comprehensive care. At a micro level, the trends increased in coordinating care, managing the comorbidity and teams and making the time to build trust and relationship. These patterns of morbidity have an overall impact on general practice in terms of maintaining the important characteristics of primary health care (3, 6).
The self-management of diabetes is an important activity for diabetes patients in their day to day life and is considered in the literature as the cornerstone of diabetes care (7). In literature several studies have highlighted the importance of self-management of diabetes and its association with the improved knowledge of diabetes, responsible behaviour of patients towards their disease and its clinical outcome (8-10).
The self-management of diabetes plays an important role in controlling and preventing the complications associated with the disease. However, knowing the facts that the self-management activities are very useful, the patients do not adhere to self-management recommendations (1-3). In the middle-aged population of Pakistan, the adherence to the recommendations and barriers are both posing a great deal of problems in the context of self-management of diabetes (4-6) due to unhealthy eating patterns and lack of physical activities in this population (6).
This study administered the Urdu version of SDSCA instrument and applied it to a wider study sample (n=200) to identify socio-demographic characteristics and the factors which are influencing the self-management activities in the middle-aged population of rural area of Pakistan with type 2 diabetes. The original Summary of Diabetes Self-care Activities (SDSCA) instrument developed by Dr. Toobert is widely used in diabetes-related studies and has been translated into various languages (11). The English version of SDSCA questionnaire was developed in two parts. The first part contains essential questions and the second part contains additional questions designed to provide more detailed knowledge of the patient’s self-care recommendations. The first part consists of 10 questions about self-care activities, which consist of five sub-scales or domains: diet (4 questions), exercise (2 questions), blood glucose testing (2 questions), and foot care (2 questions). In addition to these sub-scales, the first part includes one question on smoking sub-scale. We have included one sub-scale related to medication adherence with two more questions. So, there are 12 questions in Urdu version of SDSCA and one question related to smoking. The revised version of SDSCA was composed of 13 items for this study.
The outcome of this study is considered, to the best of our knowledge, the first approach which measures the frequency of self-management activities in rural area of Pakistan by using the Urdu version of the instrument (U-SDSCA) developed by the authors (11). Since we have considered equal samples of males and females in this study, the outcome of this study would provide an insight into gender-specific factors influencing the self-management of type 2 diabetes.
Participants
The sample of participants was purposively recruited from the medical clinics of Al-Rehman Hospital in rural area of Abbottabad, Pakistan which provide services related to primary healthcare and diabetes management services and guidelines. The middle-aged population aged 40-60 years were included in this sample with poorly controlled type 2 diabetes. The patients with diabetes having HbA1c > 7 %were included in this study and patients having coexisting liver, kidney or thyroid disorder were excluded. Initially about 250 patients were approached and 200 patients agreed to take part in this study. Informed consents were obtained from the participants (n=200) and a questionnaire was distributed to all the participants to complete after taking their consents.
Sample Size Calculation
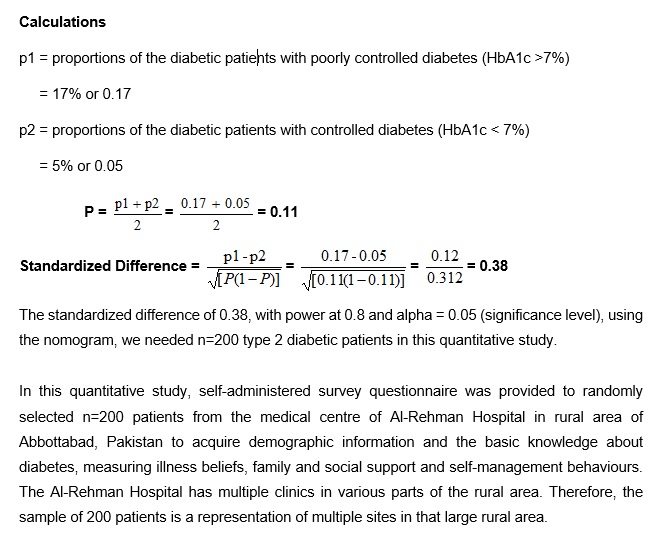
The sample size was powered at 80% with alpha, the significance level = 5% and sample size was calculated to detect a standardized difference with 80% power using nomogram. The following formulas were used to calculate the sample size based on the proportions of population in each group of type 2 diabetic patients for this quantitative study. First we calculated a standardized difference between the two populations which has enabled us to use nomogram to work out how many patients were needed for this study.
Calculations (see Calculations in the Supplementary Files)
Instruments
The study questionnaire had three sections to complete such as socio-demographics, the Urdu version of the Summary of Diabetes Self-care Activities Measure (U-SDSCA) and its extended version. In addition, glycosylated hemoglobin (HbA1c) results and Body Mass Index (BMI) measurements records of the patients were obtained from the medical centre of the hospital with the permission of the patients. The three sections of the questionnaire represented number of socio-demographic variables and subscales which are discussed below.
Age
This study defined the age group threshold for including participants in the middle-aged population of Pakistan with diabetes aged between 40-60 years. The reason is that it is the highest age-specific prevalence of diabetes in Pakistan and it is in line with the latest estimates of International Diabetes Federation (IDF) which suggested that the greatest number of people with diabetes in the world is between 40-59 years (11). Therefore, the current study sought to include type 2 diabetic patients between 40-60 years in the rural area of Pakistan. The study age categories were: 40-49; 50-59; and 60-65. Therefore, the variable “age” was re-categorized into < 60 and ≥ 60.
Gender
The variable “gender” was included in the analysis to investigate its effect on the self-management practices among the participants. This is mainly because diabetes self-management has a gendered dimension (12). This is in agreement with previous studies mentioning that gender has an effect on self-management practices among the patients with type 2 diabetes (13).
Education
The variable “education” was classified into five different categories representing the various education levels in Pakistan. However, for statistical analysis purposes these levels were categorized with two variables such “no formal education” (participants having no certificate or degree) and “formal education” (participants holding some certificates or degrees). The variable education (literacy) is important as it affects patients’ adherence to diabetes management plans and levels of self-management (14). Health literacy is defined as “the level of the individual’s ability to understand information, their competence to use the information provided, together with health services, to reach personal health-related decisions” (15).
Incidence of diabetes
In previous studies, there is an evidence of positive relationship between the type 2 diabetes duration and its complications (16, 17). This study has included in the analysis diabetes duration to investigate if the duration has any association with type 2 diabetes and consequently with the participants’ self-management practices. The diabetes duration was categorized as “< 8 years and ≥ 8 years”. This cut off point was selected based on the literature survey where this particular diabetes duration (˃ 5 to < 10 years) has a significant effect on the vascular deaths (RR=6.6; 95% CI: 6.1 – 7.1). That is the rate ratios for vascular deaths increases with longer duration of diabetes (18). In addition, the duration of diabetes is independently associated with microvascular events.
Blood glucose level
The HbA1c level of participants was considered to be less than or equal to 7% (≤ 7%) as having a controlled blood glucose levels as per the guidelines by the American Diabetes Association. (19). These results were obtained from the patients’ medical centre and the time frame for this test was three months prior to baseline. The glucose levels were considered as binary outcome variables as either “controlled or uncontrolled variables” for statistical analysis.
Statistical Analysis
The IBM SPSS version 21 and STATA version 15 software were used to do the statistical analyses. The authors carried out in details, the psychometric evaluation and validation of Urdu version of the summary of diabetes self-care activities measure (U-SDSCA) elsewhere (11). The instrument has shown acceptable psychometric properties throughout a consecutive reliability and validity evaluation (11).
The other statistical analyses carried out include descriptive, univariate and multivariate statistical analyses. The multivariate regression analysis performed between the independent variables or predictor variables using the characteristics of participants and their self-management scores. The binary logistic regression analysis was used to determine the factors associated with poor glycemic control (HbA1c (≥ 7%) while adjusting for covariates. In all the analysis, a p-value of ˂ 0.05 was considered significant.
Socio-demographic variables
The Urdu speaking participants understood and replied to the questions related to socio-demographic questions. The researcher, for the purpose of analysis, derived the variables which were related to cultural differences in the interpretation. The questions related to “socio-demographic” in the questionnaire are presented in Table 1.
Table 1 Socio-demographic variables and questions
|
Age (years) |
□ |
□ |
□ |
|
|
|
|
40-49 |
50-59 |
60-65 |
|
|
|
|
|
|
|
|
|
|
Gender |
□ |
□ |
|
|
|
|
|
Male |
Female |
|
|
|
|
Income/Year/Pak Rs |
□ |
□ |
□ |
□ |
□ |
|
|
1,000- |
50,001- |
75,001- |
120,001- |
> 200,000 |
|
|
50,000 |
75,000 |
120,000 |
200,000 |
|
|
Education background |
□ |
□ |
□ |
□ |
□ University |
|
|
None |
Elementary |
Secondary |
High |
University |
|
|
|
school |
school |
school |
level |
|
|
|
|
|
|
|
|
Duration of Type 2 |
□ |
□ |
□ |
□ |
□ |
|
diabetes (years) |
< 2 |
2-5 |
6-7 |
8-10 |
> 10 |
|
|
|
|
|
|
|
Patients’ demographic and characteristics
The characteristics of the patients related to diabetes and demographic are presented in Table 2 and used further for statistical analysis. In relation to age, 41.5% participants were aged between 40-49 years, 44.5% participants were aged between 50-59 years and 14% participants were aged between 60-65 years. For statistical purposes, only two categories of age were considered (40 - 59 years, ˂ 60) and (60-65 years, ≥ 60). The table 2 presents equal number of participants in each group (males and females). Table 2 shows that 33% of participants had no formal education and 70% had a yearly income of less than 120,000 Pakistani Rupees (< US$1200). Sixty-one percent (61%) of the recruited sample had been diagnosed with Type 2 diabetes for more than eight years. The blood glucose testing records indicated that only 9% of the participants had blood glucose level (HbA1c) in range recommended by the American Diabetes Association (19).
Table 2 Patient’s characteristics and variables for statistical analysis

Binary cut-offs.
In order to explore the self-management practices of the participants, the self-management activities were divided into two categories: satisfactory practice and the unsatisfactory practice. The Table 3 shows that the two activities were least practiced namely the testing of blood glucose levels (n = 178, 89% _4 days/week) and the foot care (n = 145, 73% _ 2 days/week). The other activities such as medication (n = 130, 65% = 7 days/week), diet (n = 148, 74% _ 3 days/week), and exercise (n = 127, 63% _ 3 days/week) found to be using self-management activities adequately.
Table 3 Self-management practices level as binary outcome (n=200 participants)
|
Scale |
Category |
Number (%) |
|
Medication |
≤ 6 days/week (un-satisfactory) = 7 days/week (satisfactory) |
70 (35) 130 (65) |
|
Diet |
≤ 2 days/week (un-satisfactory) ≥ 3 days/week (satisfactory) |
52 (26) 148 (74) |
|
Exercise |
≤ 2 days/week (un-satisfactory) ≥ 3 days/week (satisfactory) |
73 (37) 127 (63) |
|
Blood Glucose Test |
≤ 4 days/week (un-satisfactory) ≥ 5 days/week (satisfactory) |
178 (89) 22 (11) |
|
Foot care |
≤ 2 days/week (un-satisfactory) ≥ 3 days/week (satisfactory) |
145 (73) 55 (27) |
Summary of Diabetes Self-Care Activities (U-SDSCA)
Descriptive analysis
The table 2 above presents patients’ characteristics and using these variables in table 2, descriptive statistics was calculated for the independent and dependent variables including the frequencies for binary and categorical exposure variables of interest. It was also decided to include in the analysis the medication sub-scale extension of the U-SDSCA as medication self-care plays an important role in the self-management outcome.
The Urdu-version of SDSCA
The Table 4 shows the descriptive outcomes of Urdu-version of SDSCA items, the patients showed low to medium levels of self-management activities which are below the guidelines of ADB (19). The activities refer to the sub-scale of the instrument to record how many days patients performed the specified self-care activity, based on a seven-day interval. The minimum number of days is “0” while the maximum is “7”. It may be seen from the Table 4, that the items 1 ad 2, which represents healthy eating plan and eating plan over the past month, the means were in the middle of the scale between 1-7 (mean=3.36, σ =2.08; mean =3.33, σ = 1.71).
The results for Items 3 and 4 on the exercise sub-scale give mixed information – for 20 minutes exercise, the mean was 2.97 with σ = 1.43 as compared to the mean value of 2.59, σ = 0.80 for specific exercise. The items 5 and 6 represents blood glucose testing which showed overall low means results (mean =1.95, σ = 0.76; mean=1.66, σ = 0.56). This indicates that patients did not adhere to blood glucose testing plans and recommendations. The main reason may be that the blood glucose testing strips are very expensive and patients are not in a position to buy these.
The items 7 and 8 of Table 4 represents the means for foot-care which also indicate low responses (mean =1.87, σ = 1.63; mean = 1.84, σ = 0.86). The patients’ smoking status, recorded as Yes or No, women in this sub-sample (n=100) informed that they don’t smoke and only 5 male participants out of 100 male participants (5 %) indicated at the time of data collection that they were smokers but not smoking regularly. Therefore, smoking variable has been removed from any further analysis due its non-significance.
Table 4 The descriptive outcomes of Urdu version of SDSCA items
|
U-SDSCA Questionnaire items |
Description of the questions |
Mean |
Standard Deviation |
|
Q1 - gen diet 1 |
Healthy eating plan followed |
3.36 |
2.08 |
|
Q2 – gen diet 2 |
Eating plan over the past month followed |
3.33 |
1.71 |
|
Q3 – exercise 1 |
Participation in 30 min exercise |
2.97 |
1.53 |
|
Q4 – exercise 2 |
Participation in specific exercise session |
2.59 |
0.80 |
|
Q5 – blood glucose 1 |
Testing blood glucose level |
1.95 |
0.76 |
|
Q6 – blood glucose 2 |
Test your blood sugar recommended |
1.66 |
0.56 |
|
Q7 – foot care 1 |
Check your feet |
1.87 |
1.63 |
|
Q8 – foot care 2 |
Inspect the inside of the shoes |
1.84 |
0.86 |
The Table 5 presents the means for the instrument U-SDSCA sub-scales. The self-management activities are displayed from the least activity to the most practiced activity: blood glucose testing (mean: 2.25 ± σ = 1.11); foot-care activities (mean: 2.28± σ = 0.45); exercise activities (mean: 2.94 ± σ =0.82); diet activities (mean: 3.40 ± σ =1.06); and medication (mean: 6.17 ± σ =1.18).
Table 5 The descriptive outcomes of Urdu version of SDSCA sub-scales
|
|
Mean |
Std. Deviation |
Skewness |
Kurtosis |
||
|
Statistic |
Statistic |
Statistic |
Std. Error |
Statistic |
Std. Error |
|
|
Diet |
3.40 |
1.056 |
.060 |
.172 |
-1.217 |
.342 |
|
Exercise |
2.94 |
.815 |
.120 |
.172 |
-1.484 |
.342 |
|
BGlucose Test |
2.25 |
1.106 |
1.471 |
.172 |
1.643 |
.342 |
|
Footcare |
2.28 |
.448 |
1.015 |
.172 |
-.979 |
.342 |
|
Medication |
6.17 |
1.181 |
-.861 |
.172 |
-.932 |
.342 |
|
|
|
|
|
|
|
|
Table 6 provides the Urdu-version of SDSCA sub-scale categories for the participants whose practices were within the recommended guidelines of ADA (19) were coded as “1”, and those who were not were coded as “2”.
Table 6 The sub-scale categories of Urdu-version of SDSCA
|
Recommended Practice |
Code |
Diet |
Exercise |
Blood Test |
Foot care |
Medication |
|
Yes(days/week)
|
1 |
≥3 |
≥3 |
≥5 |
≥3 |
=7 |
|
No (days/week)
|
2 |
≤2 |
≤2 |
≤4 |
≤2 |
≤6 |
Bivariate Analysis
The association between the patients’ characteristics and the self-management activities in relation to the sub-scales means was investigated using independent t-test with two tailed significance level. Information from Table 2 were utilized to see the differences of the different exposure (independent) variables such as Age, Sex, formal education, income, diabetes Time and blood glucose (HbA1c) with the participant’s self-management activities such as medication adherence, diet, exercise, foot care and blood glucose monitoring as displayed in Table 5.
Medication Sub-scale
In previous analysis (table 5), the high mean value of the medication subscale (Mean: 6.17 ± 1.18 SD) suggested that people with diabetes in the rural area of Pakistan rely on medications to control their blood glucose level. A close review of independent sample t-test results in Table 7 on medication sub-scales for exposure variables age and sex revealed that adherence to medication was most evident among older participants (age ≥ 60 years) with (diff = -.306, p= 0.20) as compared to the participants with age group < 60 years. In addition, female participants have shown better outcome in relation to medication adherence (diff= .15, p= .370) as compared to male participants. The overall results of independent t-test on medication sub-scales are shown in Table 7.
Table 7 Independent sample t-test for all medication sub-scales
|
|
Mean |
Diff |
t -value |
p -value |
|
Age (years) |
|
|
|
|
|
< 60 |
6.12 |
|
|
|
|
≥ 60 |
6.43 |
-.306 |
-1.28 |
.204 |
|
Sex |
|
|
|
|
|
Male |
6.09 |
|
|
|
|
Female |
6.24 |
.15 |
.898 |
.370 |
|
Formal education |
|
|
|
|
|
No formal education |
6.21 |
|
|
|
|
Formal education |
6.14 |
.07 |
.39 |
.693 |
|
Income < 120,000 Rs |
6.23 |
|
|
|
|
≥ 120,000 Rs |
6.00 |
.236 |
1.29 |
.197 |
|
Type 2 diabetes Time |
|
|
|
|
|
< 8 years |
6.17 |
|
|
|
|
≥ 8 years |
6.16 |
.003 |
.016 |
.987 |
|
Blood Glucose (HbA1c) |
|
|
|
|
|
Controlled (≤ 7%) |
6.44 |
|
|
|
|
Uncontrolled (> 7%) |
6.14 |
.307 |
1.05 |
.294 |
|
|
|
|
|
|
Diet Sub-scale
It may be observed from the independent sample t test outcomes in Table 8 that there is a difference in dietary practices between the genders and blood glucose control. The table 8 shows that females are more likely to adhere to an appropriate diet than males (Diff .09; p =.548) and participants whose blood glucose was controlled also scored higher in dietary practice compared to those whose blood glucose was uncontrolled (Diff .29; p =.253). The overall results of independent sample t-test on diet sub-scales are shown in table 8. These differences are not statistically significant as p-vales >0.05.
Table 8 Independent sample t-test for all diet sub-scales
|
|
Mean |
Diff |
t -value |
p -value |
|
Age (years) |
|
|
|
|
|
< 60 |
3.43 |
|
|
|
|
≥ 60 |
3.14 |
.293 |
1.365 |
.174 |
|
Sex |
|
|
|
|
|
Male |
3.35 |
|
|
|
|
Female |
3.44 |
.09 |
.602 |
.548 |
|
Formal education |
|
|
|
|
|
No formal education |
3.29 |
|
|
|
|
Formal education |
3.45 |
-.160 |
-1.01 |
.315 |
|
Income < 120,000 Rs |
3.40 |
|
|
|
|
≥ 120,000 Rs |
3.38 |
.017 |
.102 |
.919 |
|
Type 2 diabetes Time |
|
|
|
|
|
< 8 years |
3.37 |
|
|
|
|
≥ 8 years |
3.41 |
-.038 |
-.248 |
.804 |
|
Blood Glucose (HbA1c) |
|
|
|
|
|
Controlled (≤ 7%) |
3.66 |
|
|
|
|
Uncontrolled (> 7%) |
3.36 |
.299 |
1.145 |
.253 |
|
|
|
|
|
|
Exercise Sub-scale
It may be observed from the independent sample t test outcome in Table 9 that there is a difference on exercise practices between the genders and blood glucose control. The table 9 shows that younger participants (< 60 years of age) are more likely to exercise than older participants (mean 3.28 vs mean 2.89). The means difference is almost statistically significant at p<0.05 (p=0.056). The participants diagnosed with type 2 diabetes for less than eight years seem to undertake regular exercise than those who diagnosed for a longer time period (diff .241; p= .328). The overall results of independent sample t-test on exercise sub-scales are shown in Table 9.
Table 9 Independent sample t-test for all exercise sub-scales
|
|
Mean |
Diff |
t -value |
p -value |
|
Age (years) |
|
|
|
|
|
< 60 |
3.28 |
|
|
|
|
≥ 60 |
2.89 |
.386 |
1.918 |
.056 |
|
Sex |
|
|
|
|
|
Male |
3.30 |
|
|
|
|
Female |
3.15 |
.15 |
-1.067 |
.287 |
|
Formal education |
|
|
|
|
|
No formal education |
3.30 |
|
|
|
|
Formal education |
3.19 |
.116 |
.778 |
.438 |
|
Income < 120,000 Rs |
3.26 |
|
|
|
|
≥ 120,000 Rs |
3.15 |
.107 |
.697 |
.487 |
|
Type 2 diabetes Time |
|
|
|
|
|
< 8 years |
3.27 |
|
|
|
|
≥ 8 years |
3.19 |
.072 |
.502 |
.616 |
|
Blood Glucose (HbA1c) |
|
|
|
|
|
Controlled (≤ 7%) |
3.44 |
|
|
|
|
Uncontrolled (> 7%) |
3.20 |
.241 |
.981 |
.328 |
|
|
|
|
|
|
Blood Glucose Monitoring Sub-scale
Table 10 shows that male participants are less inclined to do blood glucose monitoring than female participants (Diff= .22; p = .160). The participants who had a lower income tested blood glucose less often than participants who had a higher income (Diff= -.598; p = .003) which is statistically significant (p ˂ 0.05). The overall results of independent sample t-test on blood glucose monitoring sub-scales are shown in Table 10.
Table 10 Independent t-test for all blood glucose monitoring sub-scales
|
|
Mean |
Diff |
t -value |
p -value |
|
Age (years) |
|
|
|
|
|
< 60 |
2.24 |
|
|
|
|
≥ 60 |
2.32 |
-.083 |
-.367 |
.714 |
|
Sex |
|
|
|
|
|
Male |
2.14 |
|
|
|
|
Female |
2.36 |
.22 |
1.409 |
.160 |
|
Formal education |
|
|
|
|
|
No formal education |
2.30 |
|
|
|
|
Formal education |
2.22 |
.079 |
.475 |
.635 |
|
Income < 120,000 Rs |
2.29 |
|
|
|
|
≥ 120,000 Rs |
2.88 |
-.598 |
-2.969 |
.003 |
|
Type 2 diabetes Time |
|
|
|
|
|
< 8 years |
2.28 |
|
|
|
|
≥ 8 years |
2.58 |
-.299 |
-1.568 |
.120 |
|
Blood Glucose (HbA1c) |
|
|
|
|
|
Controlled (≤ 7%) |
2.67 |
|
|
|
|
Uncontrolled (> 7%) |
2.45 |
.221 |
.674 |
.501 |
|
|
|
|
|
|
It may be noticed in bi-variate analysis that there are differences on all the sub-scales but these are not statistically significant (p> 0.05). The exception is exercise sub-scale which shows that relatively younger participants (< 60 years of age) are more likely to exercise than older participants (mean 3.28 vs mean 2.89). The means difference is almost statistically significant (border line) at p<0.05 (p=0.056). The participants who had a lower income tested blood glucose less often than participants who had a higher income (Diff= -.598; p = .003) which is statistically significant (p ˂ 0.05).
Multivariate Regression Analysis
The multivariate regression analysis was carried out between the independent variables or predictor variables using participants’ characteristics and their total self-management score and the results are given in Table 11. Keeping in view, the research questions in mind and realizing that these variables are of theoretical importance so we kept these in the multivariate regression analysis despite their insignificance at bivariate analysis. The other reason was relatively small sample size (n=200) as these variables may have non-significance but may have substantial importance in diabetes self-management activities.
The participants’ characteristics accounted for 21% of the variability in the total self-management score (R²=0.211). In addition, women were more inclined to undertake appropriate diabetes self-management activities (β .302; p = .000). The other statistically significant associations were between income and the level of glucose control (HbA1c). The participants with higher income (> 120,000 Pak Rs) were more likely to undertake appropriate diabetes self-care activities (β = .118; p = .050) than those with lower income. This was also reflected on blood glucose monitoring as participants with uncontrolled glucose level (HbA1c >7%) were unlikely to undertake appropriate diabetes care activities than those with controlled glucose levels (β= -.119; p = .051).
As mentioned previously, the main reason may be the high cost of glucose testing strips which is beyond the reach of participants with low income. The other independent variables related to patients’ characteristics did not have much impact on the total self-management activities.
Table 11 The self-management practices model of participants (n=200)
|
Predictors |
B |
SE(B) |
β |
p- value |
|
Age ≥ 60 years |
-.250 |
.211 |
-.080 |
.251 |
|
Sex |
.723 |
.163 |
.302 |
.000 |
|
Income > 120,000 Rs |
.300 |
.145 |
.118 |
.050 |
|
Formal education |
-.060 |
.180 |
-.022 |
.702 |
|
DiabetesTime ≥ 8 years |
-.121 |
.151 |
-.052 |
.422 |
|
HbA1c (Uncontrolled) |
-.400 |
.201 |
-.119 |
.051 |
Note: F= 8.26, p-value = 000, R Square= .211
B= unstandardized co-efficient; SE (B) = standard error of B
β = standardized co-efficient
The current study has demonstrated that glycemic control (HbA1c) levels among the patients of type 2 diabetes in the rural area of Pakistan were not achieved in majority of patients, and that glycemic control was unsatisfactory. Similar results have been reported in other studies carried out by Khattab et al. (16) and Ahmad et al. (20). The main reasons identified in this study for low levels of glycemic control are local diet which is high in carbohydrates, poor eating habits, lack of physical activity, barriers to self-management and lack of knowledge about diabetes and its treatment. The four main variables found to influence the self-management activities and outcome of glycemic control in the current study were gender differences (Sex), duration of diabetes, medication adherence, diet and exercise.
The medications adherence in the population showed highly practiced among all other self-management activities, suggesting that the population in rural area of Pakistan is heavily depending on the medications. However, in other self-management activities, the participants showed low level of compliance indicating that there are challenges in rural area which are preventing them from undertaking recommended self-management activities.
The analysis showed that only 9 % of participants had controlled their glycemic level which gives strong evidence to support the requirements for an effective diabetes self-management. This finding reflected serious limitations on the self-management of type 2 diabetes activities, the way it has been promoted and practiced in rural area of Pakistan.
The blood glucose monitoring revealed that longer duration of diabetes was associated significantly with poor glycemic control. This finding is in agreement with other studies reported by Benoit et al. (21) and Verma et al. (22). This may be possible that the longer duration of diabetes is associated with poor glycemic control because of progressive impairment of insulin secretion with time due to β-cell failure, which does not respond to diet alone or to other oral agents (23).
In addition, the participants whose blood glucose was controlled (≤ 7%) were more motivated to monitor their blood glucose level as compared to those participants who had uncontrolled blood glucose levels. In this study, age was not found to be correlated with glycemic control, however, this finding is not consistent with the findings in other studies which reported that younger age was associated with poor glycemic control (24, 25).
The analysis also revealed the low percentage of the participants adhering to optimal healthy eating practice (seven days a week), that indicated how hard it is to maintain a healthy diet in that rural area of Pakistan. This finding is in agreement with the other studies carried out in Pakistan which have highlighted that the lack of physical activity and unhealthy eating habits were evident from the culture, tradition and lifestyle behaviour of the people of the rural area of Pakistan (26-29). The participants’ characteristics accounted for 21% of the variability in the total self-management activities but women were more inclined to undertake appropriate diabetes self-management activities as compared to men.
Strengths and Limitations
The main strength of the study is that the relatively larger sample (n=200) was adequate to identify the agreement between the theoretical concept of self-management and the U-SDSCA measures which can be used for further research assessing the self-management of type 2 diabetes in the population of Pakistan. The limitation of this study as well as other studies measuring the self-management activities is the lack of “gold standard” comparison (30). The reason may be that the measurement of self-management of diabetes poses difficulties because of the various aspects that are inherent within this concept.
This study has identified the factors influencing the self-management activities among the patients with type 2 diabetes in rural area of Pakistan. Of particular mention were the following factors associated with poor self-management activities such as long duration of diabetes, gender differences, not adherence to medications, poor eating habits and lack of physical activities and poor eating habits. It is therefore important for healthcare professionals to pay special attention to the patients of middle-aged population of rural area of Pakistan, those with a longer duration of diabetes and those who are not adherent to self-management practices, to ensure that this population is aware of diabetes and its complications. In addition, educational programme that emphasizes lifestyle modification with importance of adherence to treatment would be most beneficial to this population and to their self-management activities.
SDSCA: Summary of Diabetes Self-care Activities; U-SDSCA: Urdu-version of Summary of Diabetes Self-care Activities; SPSS: Statistical Package for the Social Sciences; IDF: International Diabetes Federation; HbA1c: Glycosylated hemoglobin; BMI: Body Mass Index.
Ethics approval and consent to participate: The study was approved by the ethics committee of University of New South Wales, Australia (ref: HC16882) and by the Ayub Medical Institution of Pakistan.
Consent for publication: There is no individual data involved in this article but the consent for publication was obtained from the participants in the study.
Availability of data and material: Please contact corresponding author for data requests.
Competing Interest: The authors declare that they have no competing interest in this research work.
Funding: No funding was received for this research work.
Authors' contributions: RM collected and analyzed and interpreted the patient’s data regarding the self-management of type 2 diabetes and performed the statistical analysis. HH and MH reviewed the work and commented to make the modifications required. NZ reviewed the manuscript and provided his comments to enhance the overall presentation of the results. All authors read and approved the final manuscript.
Acknowledgements: The authors are thankful to Dr. Deborah Toobert giving us permission to use the English version of The Summary of Diabetes Self-Care Activities (SDSCA). The authors are also thankful to the director of Al-Rehman hospital, Abbottabad, Pakistan facilitating the interviews and data collection activities. The main author is grateful to Australian government providing scholarship to study at UNSW for this research work.
Narayan, KMV. The Diabetes Pandemic: Looking for the silver lining: Clinical diabetes 2005, Volume 23, 2, p: 51-52.
International Diabetes Federation. Diabetes prevalence 2014, available online from: http://www.idf.org/home/index.cfm
Whiting DR, Guariguata L, Weil C et al. IDF Diabetes Atlas: Global estimates of the prevalence of diabetes for 2011 and 2030. Diabetes Res Clin Pract. 2011; 94: 311-321. Available online from: http://www.idf.org/home/index.cfm
World Health Organization. STEPS surveillance manual: WHO STEP wise approach to chronic disease risk-factor surveillance. Geneva (CH): World Health Organization; 2003
Jafar TH, Chaturvedi N, Pappas G. Prevalence of overweight and obesity and their association with hypertension and diabetes mellitus in an Indo-Asian population. CMAJ 2006, 175(9):1071-7.
Ansari RM. Effect of physical activity and obesity on type 2 diabetes in middle-aged population. Journal of Environmental and Public Health 2009, vol 2009. Pages: 4-9.
Chin MH, Auerbach SB, Harrison JF et al. Quality of diabetes care in community health centers. Am J Public Health 2000, 90:431– 434.
Mensing C, Boucher J, Cypress M et al. National standards for diabetes self-management education. Diabetes Care 2007, Suppl 1: S96-S103.
Norris SL, Lau J, Smith SJ et al. Self-management education for adults with type 2 diabetes: a meta-analysis of the effect on glycemic control. Diabetes Care 2002, 25: 1159-1171.
Glasgow RE, Strycker LA, Toobert DJ et al. The Chronic Illness Resources Surveys: A social-ecologic approach to assessing support for disease self-management. Journal of Behavioural Medicine 2000, 23, 559 –583.
Ansari RM, Harris M, Zwar N, Hosseinzadeh H. Psychometric Evaluation and Validation of an Urdu-version of the Summary of Diabetes Self-care Activities Measure (U-SDSCA). Prim Health Care 2017, 7: 272. doi: 10.4172/2167- 1079.1000272
Chun, KM & Chesla, C. A. Cultural issues in disease management for Chinese Americans with type 2 diabetes. Psychology and Health 2004, 19 (6), 767-785.
Biderman, A, Noff, E, Harris, S B et al. (2009). Treatment satisfaction of diabetic patients: What are the contributing factors? Family Practice, 26(2), 102-108.
White, R. O., Beech, B. M., & Miller, S. (2009). Health-care disparities and diabetes care: Practical considerations for primary care providers. Clinical Diabetes, 27(3), 105.
Rothman, R., Housam, R., Weiss, H. et al. (2006). Patient understanding of food labels: The role of literacy and numeracy. American Journal of Preventive Medicine, 31, 391-398.
Khattab, M, Khader, YS, Al-Khawaldeh et al. (2010). Factors associated with poor glycemic control among patients with Type 2 diabetes. Journal of diabetes and its complications, 24(2), 84-89.
Stratton, IM, Adler, AI, Neil, HAW et al. (2000). Association of glycaemia with macrovascular and microvascular complications of type 2 diabetes (UKPDS 35): Prospective observational study. British Medical Journal, 321(7258), 405.
Herrington, WG, Alegra-Diaz, J, Wade, R et al. (2018). Effect of diabetes duration and glycemic control on 14-year cause-specific mortality in Mexican adults: a blood-based prospective cohort study. Lancet Diabetes Endocrinol; 6: 455-63.
American Diabetes Association. (2008). Executive summary: Standards of medical care in diabetes- 2008. Diabetes Care, 31(1), S5-S11.
Ahmad, NS, Islahudin, F, Paraidathathu, T (2014). Factors associated with good glycemic control among patients with type 2 diabetes mellitus. J Diab Invest, 5: 563-569.
Benoit S.R., Fleming R., Tsimikas A.P et al. Predictors of glycemic control among patients with Type 2 diabetes: A long study, BMC Public Health, 5 (2005), pp. 36-45
Verma M., Paneri S., Badi P et al. Effect of increasing duration of diabetes mellitus Type 2 on glycated hemoglobin and insulin sensitivity, Indian Journal of Clinical Biochemistry, 21 (1) (2006), pp. 142-146
UK Prospective Diabetes Study (UKPDS) Group. Intensive blood-glucose control with sulphanylureas or insulin compared with conventional treatment and risk of complications in patients with Type 2 diabetes, Lancet, 352 (1998), pp. 837-853
EL-Kebbi I.M., Cook C.B., Ziemer D.C., et al. Association of younger age with poor glycemic control and obesity in Urban African Americans with Type 2 diabetes. Archives of Internal Medicine, 163 (2003), pp. 69-75
Nichols G.A., Hillier T.A., Javor K., et al.. Predictors of glycemic control in insulin using adult with Type 2 diabetes. Diabetes Care, 23 (3) (2000), pp. 273-277
Ali M, Khalid GH, Pirkani GS. Level of health education in patients with type 2 diabetes mellitus in Quetta. J Pak Med Assoc 1998, 48: 334-6.
Jabbar A, Contractor Z, Ebrahim MA et al. Standard of knowledge about their disease among patients with diabetes in Karachi, Pakistan. J Pak Med Assoc 2001, 51: 21, 6-8.
Sabri AA, Qayyum MA, Saigol NU et al. Comparing knowledge of diabetes mellitus among rural and urban diabetics. McGill J Med 2007, 10: 87-9.
Ansari RM, Hosseinzadeh H, Zwar N. Systematic Review of Type 2 diabetes self-management: focusing on the middle-aged population of rural area of Pakistan. Global Advanced Research Journal of Medicine and Medical Sciences 2016, vol. 5, no. 6, pp.170 – 182.
Kamradt, M, Bozogmehr, K, Krisam, J et al. Assessing self-management in patients with diabetes mellitus type 2 in Germany: validation of a German version of the Summary of Diabetes Self-Care Activities measure (SDSCA-G). Health and Quality of Life Outcomes 2014, 12: 185.