3.1 DEG screening
We analyzed the DEG of GSE142083 by using the limma package with the threshold of |log2(fold-change)| > 1.5 and adjust p < 0.05. A total of 432 DEGs, including 199 up-regulated genes and 233 down-regulated genes were screened in LSCC samples and adjacent normal samples. The heatmap and the volcano plot showed the expression pattern of those DEGs (Figure 2A-B).
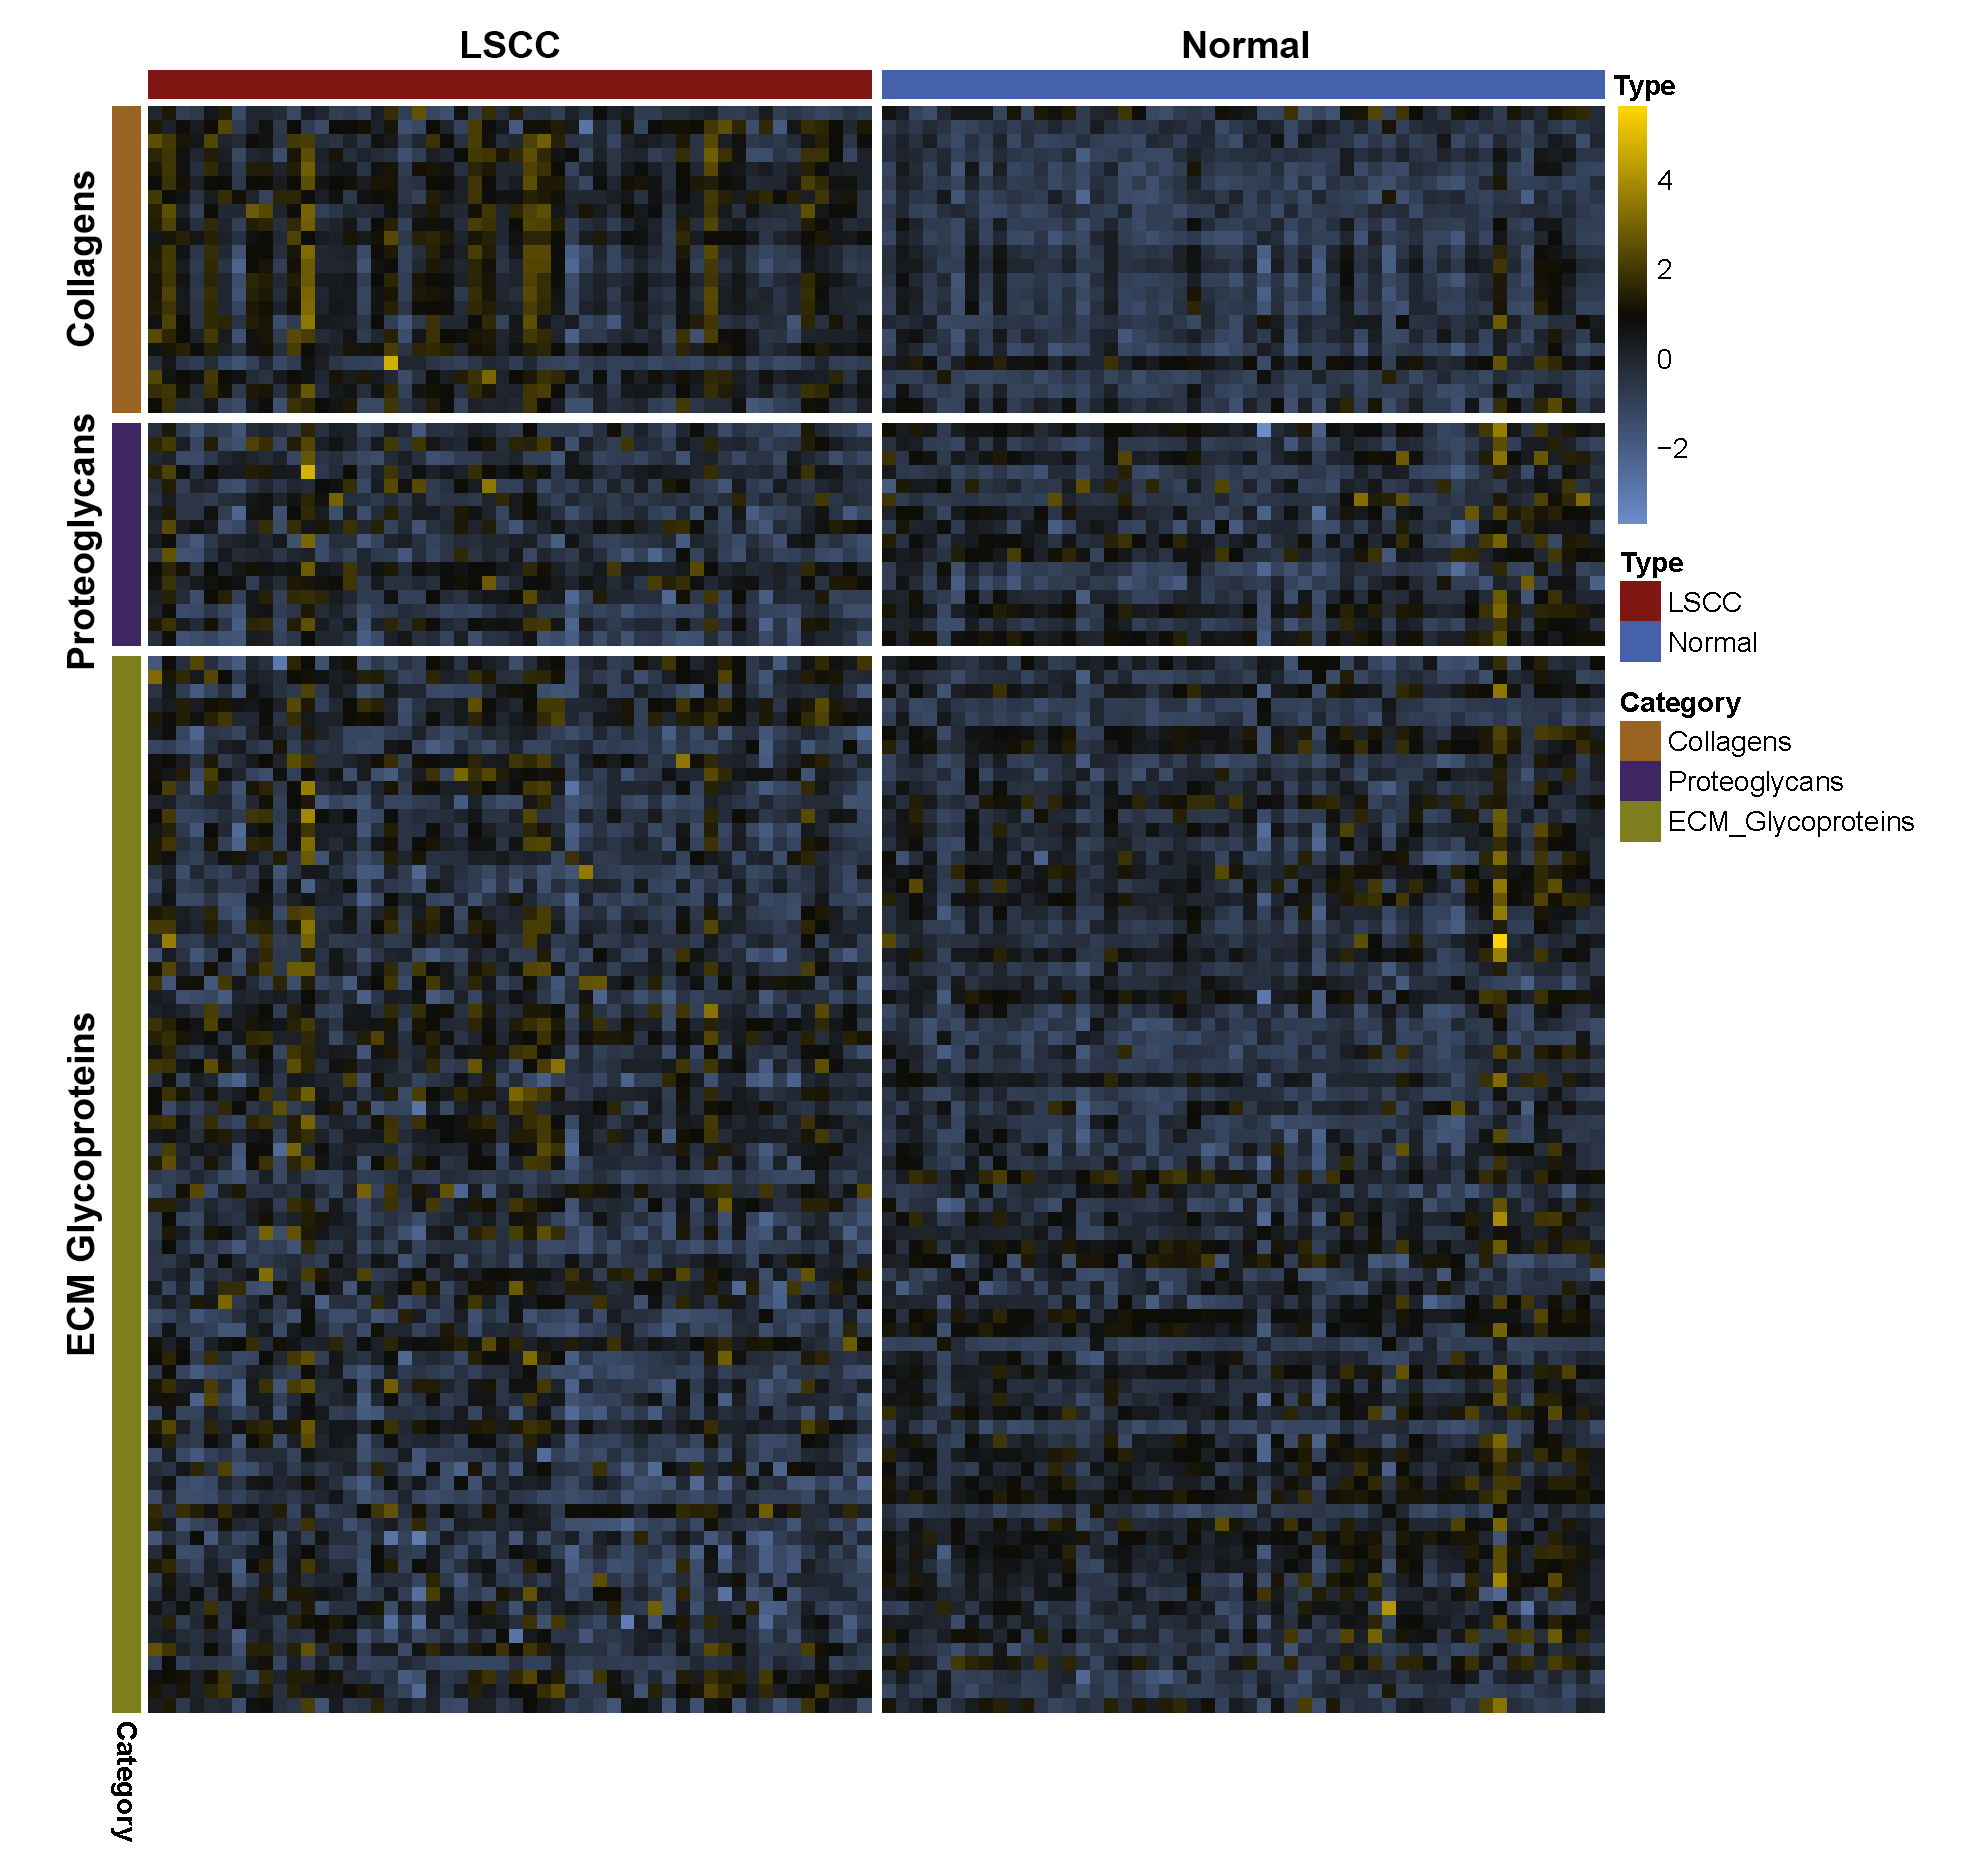
The clusterprofiler package was then applied to uncover the role of DEGs in the pathogenesis of LSCC with a cutoff criterion of p < 0.05. For biological process group, epidermis development, cornification, skin development, keratinization and keratinocyte differentiation were significantly enriched. The genes in the cellular component group were significantly enriched in cornified envelope, collagen-containing extracellular matrix (ECM) and ECM component. In the molecular function group, the DEGs were mainly enriched in ECM structural constituent, chemokine and cytokine activity. For KEGG analysis, IL-17 signaling pathway, salivary secretion, amoebiasis, cytokine-cytokine receptor interaction and ECM-receptor interaction were significantly enriched (Figure 2C). Interestingly, except for immune-related genes, we also noticed that ECM-associated genes were enriched in the DEGs and most of them were high-expressed in LSCC samples (Figure S2). Moreover, hsa04970:Salivary secretion is one of few terms which have decreasing Z-scores. That may indicate a significantly decrease of function of salivary secretion in LSCC patients.
We then obtained 848 DEGs using a cohort of Head and Neck squamous cell carcinoma (HNSC) from TCGA using GEPIA with a same threshold. After compared with DEGs in GSE142083, 211 common DEGs were identified both in DEGs of TCGA-HNSC and GSE142083 (Figure 2D).
3.2 Weighted co‑expression network construction and analysis
In order to detect the functional module in LSCC, we applied WGCNA package based on the GSE142083 dataset to establish the gene co-expression networks. In order to ensure the network was scale-free, empirical analysis was run to choose an optimal parameter β. Both the scale-free topology model fit index (R2) and mean connectivity reach steady status when β is equal to 9 (Figure 3A-B).
A total of 28 modules were identified via average linkage hierarchical clustering and each module is represented in different color (Figure 3C). Among the modules, module midnightblue, module darkgrey, module blue, module salmon and module greenyellow have high correlation with cancer traits (Figure 3D). Accordingly, they were selected as the clinically significant modules for further analysis. A set of 400 selected genes were identified for the network heatmap (Figure S3).
GO and KEGG analysis were used to assess the biological function, molecular function, cellular component and KEGG pathways of genes for modules. The midnightblue module was mainly related to glycosylation events and glycosphingolipid biosynthesis, while the blue module was mainly associated with separation of sister chromatids and cell cycle pathway. The darkgrey module is associated with thermogenesis. The salmon module was mainly associated with extrinsic apoptotic signaling and ECM-receptor interaction. The greenyellow module was for biogenesis of ribosomes and mitochondrial gene expression (Figure 4, Table S1).
3.3 Identification of hub genes
Candidate genes were screened using the cut-off criteria: the absolute value of module membership (MM) score > 0.8 (|MM| > 0.8) and the absolute value of gene significance (GS) score > 0.2 (|GS| > 0.2). Based on this cut-off criteria, we subsequently sorted the genes according to their connectivity to select candidate genes (Figure 3E-I). 41 genes in midnightblue module, 14 genes in darkgrey module, 120 genes in blue module, 31 genes in salmon module and 99 genes in greenyellow module were screened out.
In order to identify the “real” key genes, we then compared those hub genes with the 211 common DEGs. A total of 41 “real” key genes from midnightblue module, blue module, salmon module and common DEGs were screened out (Figure 5).
3.4 Validation of key genes
In order to validate and explore the prognostic values of these “real” key genes in LSCC, we conducted univariate Cox regression analysis of overall survival using the TCGA-HNSC database. Only six genes with high expression, including FSCN1, INHBA, MYO1B, PLAU, SERPINH1 and TNFRSF12A, were found to be significantly associated with shorter overall survival time among patients with cancer, while two genes (CEACAM6, TJP3) with lower expression were detected to be significantly associated with shorter overall survival time (Figure 6A). Furthermore, we also observed that higher expression of FSCN1, INHBA, MYO1B, PLAU, SERPINH1 and TNFRSF12A, as well as lower expression of CEACAM6 and TJP3, were significantly correlated with worse disease specific survival among HNSC patients (Figure 6B). The scatter plot showed the same expression pattern of those eight key genes in TCGA-HNSC and GSE142083 databases (Figure 6C).
The distribution of TICs is an important indicator of patients’ lymph node status and prognosis. In order to explore the relationship of the eight key genes expressed differently expression with the tumor immune microenvironment, we analyzed the correlation of genes and tumor-infiltrating immune subsets in TCGA-HNSC database based on GSVA package. The results showed that 24 types of TIC in tumor samples are illustrated (Figure 7). For the expression of FSCN1, INHBA, MYO1B, PLAU, SERPINH1 and TNFRSF12A, most of them have a high correlation with infiltration degree of T helper cells 1 (Th1), T gamma delta cells (Tgd), neutrophils, natural killer (NK) cells and a high negatively correlation with NK CD56bright cells, B cells, Th17 cells. While most of these TICs were inversed with the expression of CEACAM6 and TJP3.