Fiber trait evaluation
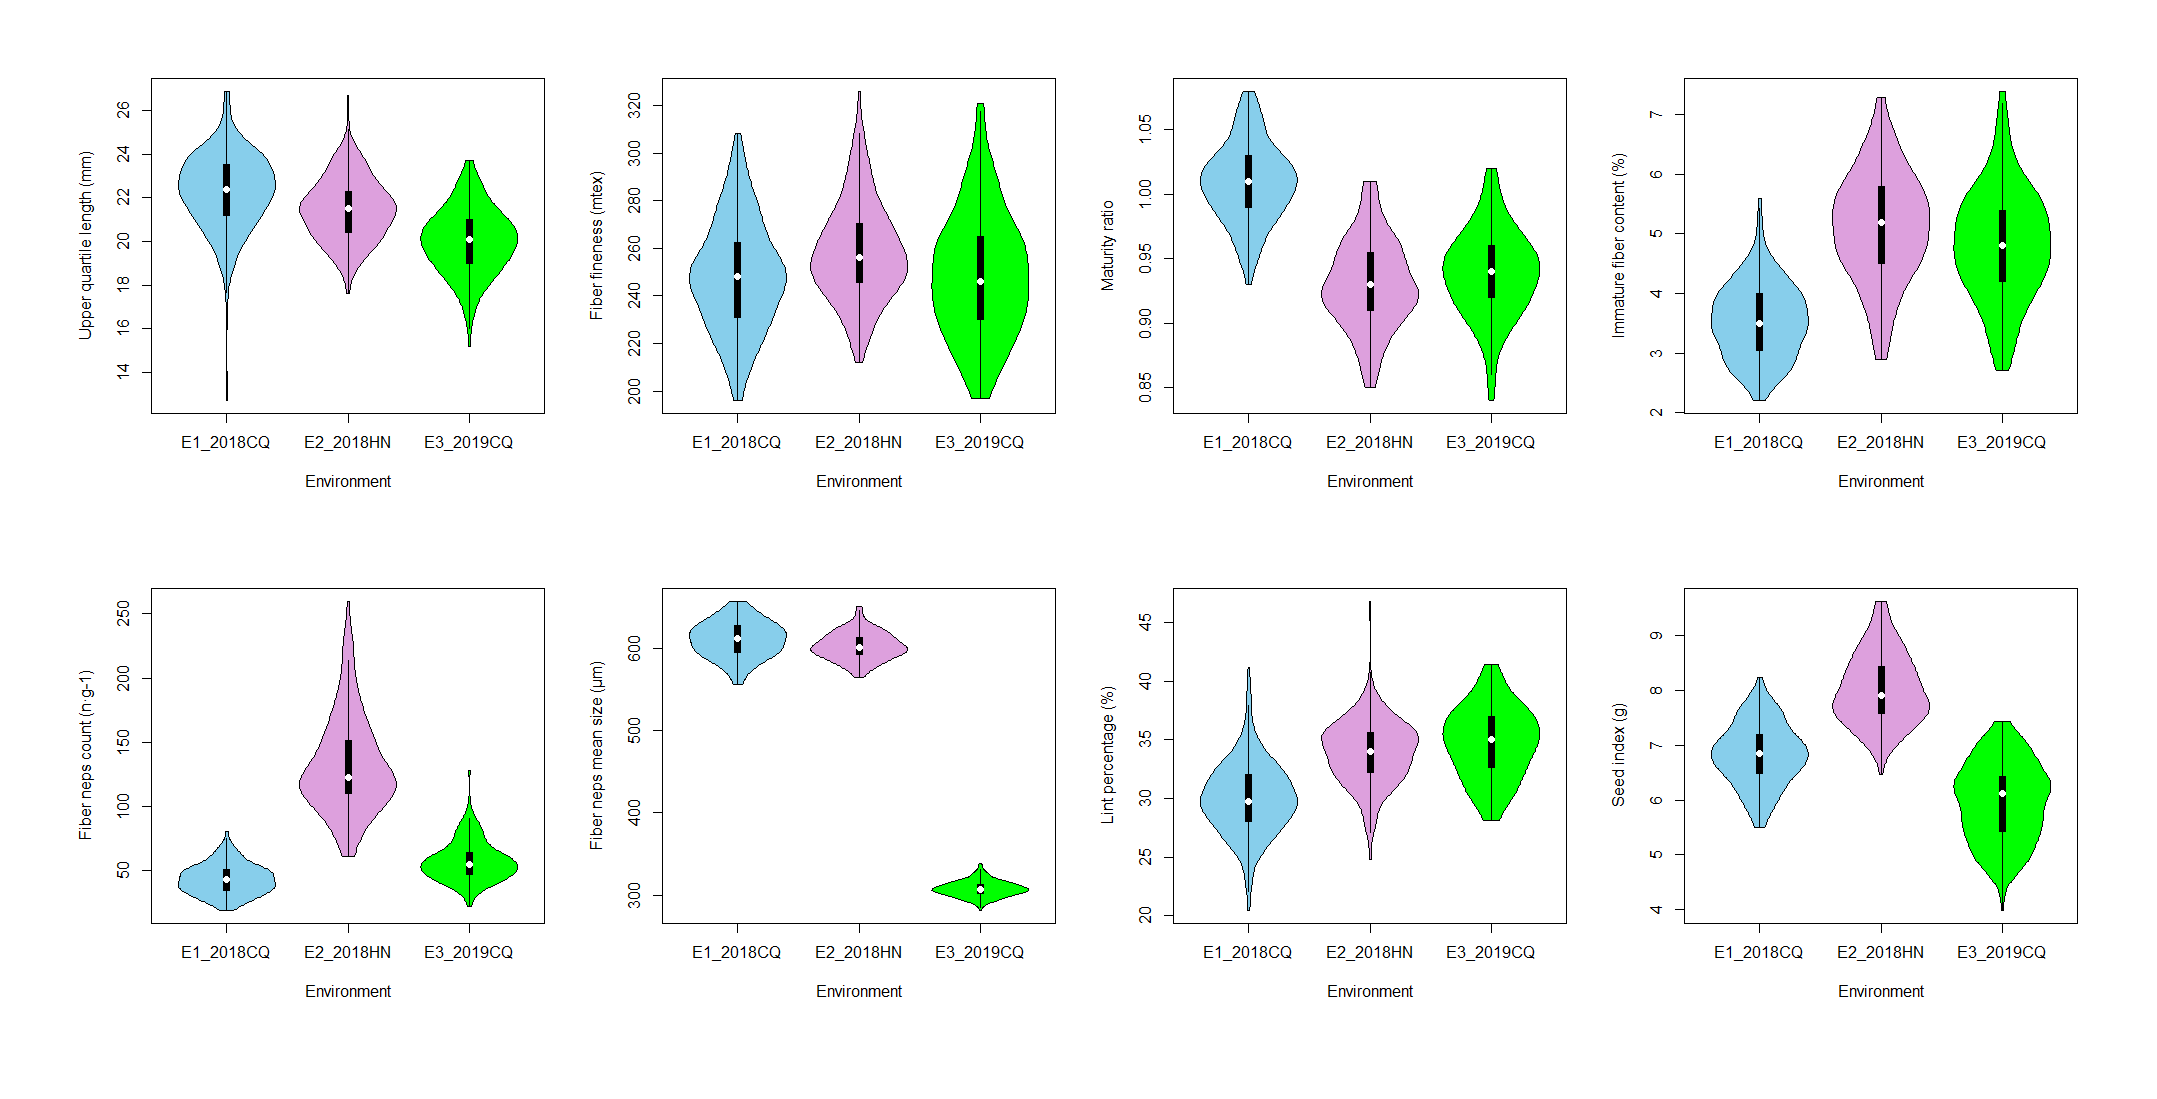
Because there were missing data for some lines across three environments, we finally used trait data of 179 lines for phenotypic analysis and subsequent QTL mapping. Descriptive statistics for all key fiber traits i.e. upper quartile length (UQL), fiber fineness (FF), maturity ratio (MR), immature fiber content (IFC), fiber neps count (FNC), fiber neps mean size (FNMS), lint percentage (LP) and seed index (SI) across three environments were summarized in Additional file 9: figure S1 and Additional file 1: Table S1. The absolute values of kurtosis and skewness for most traits were <1.0 in three environments, except for the kurtosis values for UQL-2018CQ, FNC-2019CQ, LP-2018CQ and LP-2018HN, suggesting that most traits were normally distributed. Besides, all eight traits of population showed transgressive segregation.
Correlation analysis was conducted among the eight traits (Additional file 2: Table S2). Most traits showed significant correlations with other traits except for UQL-FNMS, FF-LP, FNMS-LP. One-way ANOVA showed that most traits had significant genetic and environmental effects (p < 0.01) except for genetic effect of FNMS (Additional file 3: Table S3).
Whole-genome sequencing and SNP identification
Sequencing data were generated from two parents and their RIL population. In total, 3808.40 million clean reads were obtained including 255.62 million clean reads for parent SXY No.1, 233.81 million clean reads for parent CSLZ, and 3318.97 million clean reads for their offspring respectively. The average sequencing depth of SNP markers were 21-fold for SXY No.1, 19-fold for CSLZ and 2-fold for their progeny. Among these reads data, the percentages of reads properly mapped on reference genome for SXY No.1, CSLZ and RILs were 98.48, 98.20 and 98.16% respectively (Additional file 4: Table S4). A total of 594, 416 SNPs were detected between two parents in our study. According to the character of RILs, 130,696 (21.99% of) SNPs with genotype aa ´ bb was used for further analysis and 62,593 SNPs were retained after subsequent multiple filtering. After final segregation filtration of bins, 45,468 SNPs which were divided into 3286 recombinant bins were employed to construct the high-density genetic map (Additional file 5: Table S5).
Genetic map construction
By genetic linkage analysis, a high-density genetic map containing 3286 bin markers was constructed, which covered 1980.17 cM with an average distance of 0.61 cM between adjacent bin markers (Fig. 1; Table 1; Additional file 10: Supplement S1). 13 linkage groups were corresponding to 13 chromosomes respectively in this genetic map. The largest chromosome was Chr07, consisting of 392 bins covering 207.11 cM, with an average bin interval was 0.53 cM. The shortest chromosome was Chr02, containing 135 markers spanning 106.5 cM, with an average bin interval of 0.79 cM. Chr09 harbored the largest gap that was 12.62 cM. Besides, 99.41% of the intervals between adjacent bins were less than 5 cM, indicating that bin markers were well-distributed on the genome (Fig. 1; Table 1).
Segregation distortion analysis
Among 3286 mapped loci, 446 (13.57%) showed segregation distortion (p < 0.05) (Table 1). The segregation distortion markers (SDMs) were unevenly distributed over the genome, forming 26 segregation distorted regions (SDRs) (Fig. 1). Chr09 had the largest number of distorted loci (97), accounting for 37.75% of the total markers of Chr09. While Chr04 contained only 4 SDMs with the smallest proportion of 1.89%. A total of 323 SDMs (72.42%) favored SXY No.1 alleles while 123 SDMs (27.58%) favored CSLZ.
Table 1 Characteristics of the genetic map
|
Linkage Groups
|
Total Bin Marker
|
Total SNP Marker
|
Total Distance (cM)
|
Average Distance (cM)
|
Max Gap (cM)
|
Gap < 5 cM (%)
|
SDM
|
SDM rate (%)
|
SDR
|
|
LG01
|
227
|
3386
|
128.95
|
0.57
|
6.97
|
99.12
|
50
|
22.03
|
3
|
|
LG02
|
135
|
1324
|
106.5
|
0.79
|
5.28
|
99.25
|
18
|
13.33
|
2
|
|
LG03
|
285
|
3574
|
115.55
|
0.41
|
4.32
|
100.00
|
24
|
8.42
|
2
|
|
LG04
|
212
|
2277
|
136.67
|
0.64
|
6.27
|
99.53
|
4
|
1.89
|
0
|
|
LG05
|
323
|
3622
|
202.93
|
0.63
|
6.47
|
99.69
|
15
|
4.64
|
2
|
|
LG06
|
249
|
2736
|
173.74
|
0.70
|
10
|
99.60
|
67
|
26.91
|
3
|
|
LG07
|
392
|
6661
|
207.11
|
0.53
|
8.41
|
99.74
|
11
|
2.81
|
1
|
|
LG08
|
217
|
2892
|
141.17
|
0.65
|
5.83
|
99.54
|
5
|
2.30
|
0
|
|
LG09
|
244
|
3388
|
176.9
|
0.72
|
12.62
|
98.77
|
97
|
39.75
|
4
|
|
LG10
|
331
|
5262
|
156.38
|
0.47
|
3.93
|
100.00
|
63
|
19.03
|
2
|
|
LG11
|
274
|
4720
|
155.21
|
0.57
|
6.62
|
99.27
|
31
|
11.31
|
4
|
|
LG12
|
244
|
3728
|
151.32
|
0.62
|
7.69
|
99.18
|
12
|
4.92
|
1
|
|
LG13
|
153
|
1898
|
127.74
|
0.83
|
7.94
|
98.68
|
49
|
32.03
|
2
|
|
Total
|
3286
|
45468
|
1980.17
|
0.61
|
12.62
|
99.41
|
446
|
13.57
|
26
|
LG linkage group, SDM segregation distorted marker, SDR segregation distorted region
Collinearity between the genetic and the physical map
In order to assess the quality of the genetic map, collinearity between genetic and physical map was conducted (Figure 2). Most genetic loci were in accordance with their positions on the reference genome sequence of G. arboreum [16] except that 5 loci of LG08 corresponded to the 5 loci on Chr02 and 60 loci located on chrtig which were not mapped to chromosomes (Additional file 6: Table S6). Furthermore, 1980.17 cM corresponded to 1.46 GB, which covered 99.24% of the genome and all chromosomes showed more than 95% coverage (Additional file 7: Table S7).
QTL mapping
A total of 177 QTL for key fiber traits were identified in this study (Additional file 8: Table S8). 136 QTL for 6 fiber quality traits (UQL, FF, MR, IFC, FNC and FNMS) were detected. Phenotypic variance explained (PVE) by these QTL was 5.0-17.7%, and LOD scores ranged from 2.01-7.59. 72 QTL which had positive additive effects derived from SXY No.1, while 64 QTL which had negative additive effects derived from CSLZ.
41 QTL for 2 fiber yield traits (LP, SI) were detected. Their LOD scores ranged from 2.04-18.2, and they explained 5.1-37.4% phenotypic variance. SXY No.1 contributed 30 favorable alleles while CSLZ contributed 11. Besides, 48 QTL were detected with stability more than one environment including 38 fiber quality related QTL and 10 fiber yield related QTL (Table 2).
Upper quartile length QTL
Thirty-seven upper quartile length QTL were found on 12 chromosomes, with LOD scores ranging from 2.02 to 6.32 and explaining 5.1-15% of the phenotypic variance (Additional file 8: Table S8). The favorable alleles of 25 QTL came from SXY No.1, and 12 came from CSLZ. Fifteen QTL were identified in two or more environments, but only two (qUQL04.3, qUQL11.3) were identified in all three (Table 2; Fig. 1). Six QTL (qUQL01.4, qUQL03.1, qUQL05.2, qUQL06.3, qUQL11.1 and qUQL11.3) explained more than 10% of the phenotypic variance.
Fiber fineness QTL
Thirty-two fiber fineness QTL were also identified on 12 chromosomes, with LOD scores ranging from 2.03 to 7.59, and PVE values ranging from 5.1 to 17.7% (Additional file 8: Table S8). Among these QTL, the favorable alleles derived from two parents were all 16. Eighteen QTL were identified in two or more environments and eight QTL (qFF02.1, qFF02.4, qFF05.1, qFF05.2, qFF05.3, qFF10.2, qFF11.1, qFF13.2) were detected in three environments (Table 2; Fig. 1). Ten QTL (qFF02.4, qFF02.5, qFF03.4, qFF05.3, qFF05.4, qFF06.1, qFF07.1, qFF10.2, qFF11.2 and qFF13.2) explained more than 10% of the phenotypic variance.
Maturity ratio QTL
Eighteen maturity ratio QTL were found on 12 chromosomes, with LOD scores ranging from 2.15 to 5.6, and explaining 5.4-13.4% of the phenotypic variance (Additional file 8: Table S8). SXY No.1 contributed 10 favorable alleles for maturity ratio while CSLZ contributed 8. Four QTL (qMR02.1, qMR 04.1, qMR07.2, qMR13.1) explained more than 10% of the phenotypic variance.
Immature fiber content QTL
Twenty immature fiber content QTL were found on 12 chromosomes, with LOD scores ranging from 2.01 to 5.86, and explaining 5-14% of the phenotypic variance (Additional file 8: Table S8). The favorable alleles of 9 QTL originated from SXY No.1, and 11 originated from CSLZ. However, only one QTL (qIFC13.1) with stability was detected in two environments (Table 2; Fig. 1). Two QTL (qIFC04.3 and qIFC13.1) explained more than 10% of the phenotypic variance.
Fiber neps count QTL
Sixteen fiber neps count QTL were detected on 10 chromosomes, with LOD scores ranging from 2.09 to 5.87, and explaining 5.2-14% of the phenotypic variance (Additional file 8: Table S8). Among them, favorable alleles for 6 QTL were contributed by SXY No.1, and the rest were from CSLZ. Four QTL (qFNC01.1, qFNC07.1, qFNC07.5, qFNC11.1) were identified in two or more environments but only one QTL (qFNC07.1) was detected in all three, explaining 14% of the phenotypic variance (Table 2; Fig. 1).
Fiber neps mean size QTL
Thirteen fiber neps mean size QTL were identified on 9 chromosomes, with LOD scores ranging from 2.03 to 5.35, and explaining 5.1-12.9% of the phenotypic variance (Additional file 8: Table S8). Favorable alleles of 6 QTL were conferred by SXY No.1. and the others by CSLZ. Only one QTL qFNMS04.1 explained more than 10% of the phenotypic variance.
Lint percentage QTL
Fourteen lint percentage QTL were identified on 8 chromosomes, with LOD scores ranging from 2.08 to 18.2, and explaining 5.2-37.4% of the phenotypic variance (Additional file 8: Table S8). SXY No.1 contributed 8 favorable alleles for lint percentage whereas CSLZ contributed 6. Three QTL (qLP11.1, qLP12.1, qLP13.1) were identified in two or more environments. However, only QTL qLP13.1 was identified in three environments, explaining 37.4% of the phenotypic variance (Table 2; Fig. 1).
Seed index QTL
Twenty-seven seed index QTL were detected on 11 chromosomes, with LOD scores ranging from 2.04 to 7.59, and explaining 5.1-17.7% of the phenotypic variance (Additional file 8: Table S8). The favorable alleles of 22 QTL derived from SXY No.1, and the rest 5 QTL were from CSLZ. Seven QTL (qSI01.3, qSI04.1, qSI07.1, qSI07.2, qSI07.3, qSI08.3, qSI09.4) were found in two or more environments whereas only QTL qSI04.1 was identified in three environments, explaining 5.7% of the phenotypic variance (Table 2; Fig. 1). Six QTL (qSI01.3, qSI07.2, qSI07.3, qSI08.3, qSI09.4, qSI12.1) explained more than 10% of the phenotypic variance.
QTL clusters and hotpots
QTL clusters and hotpots were defined as regions contained multiple QTL within approximately 20 cM, for different and same traits, respectively [24, 31]. In this study, a total of 47 QTL clusters comprising 131 QTL were identified across 13 chromosomes whereas no hotpot was detected (Table 3). Chromosome 7 had the highest number of clusters (8 clusters for Chr07-cluster-1, Chr07-cluster-2, Chr07-cluster-3, Chr07-cluster-4, Chr07-cluster-5, Chr07-cluster-6, Chr07-cluster-7, Chr07-cluster-8). In addition, every QTL cluster included at least two QTL for different traits and Chr12-cluster-1 possessed the highest number of QTL (6 QTL for qFF12.1, qMR12.1, qIFC12.1, qLP12.1, qUQL12.2, qSI12.1). Notably, twenty-six clusters contained stable QTL which could be key regions of fiber traits regulatory genes.