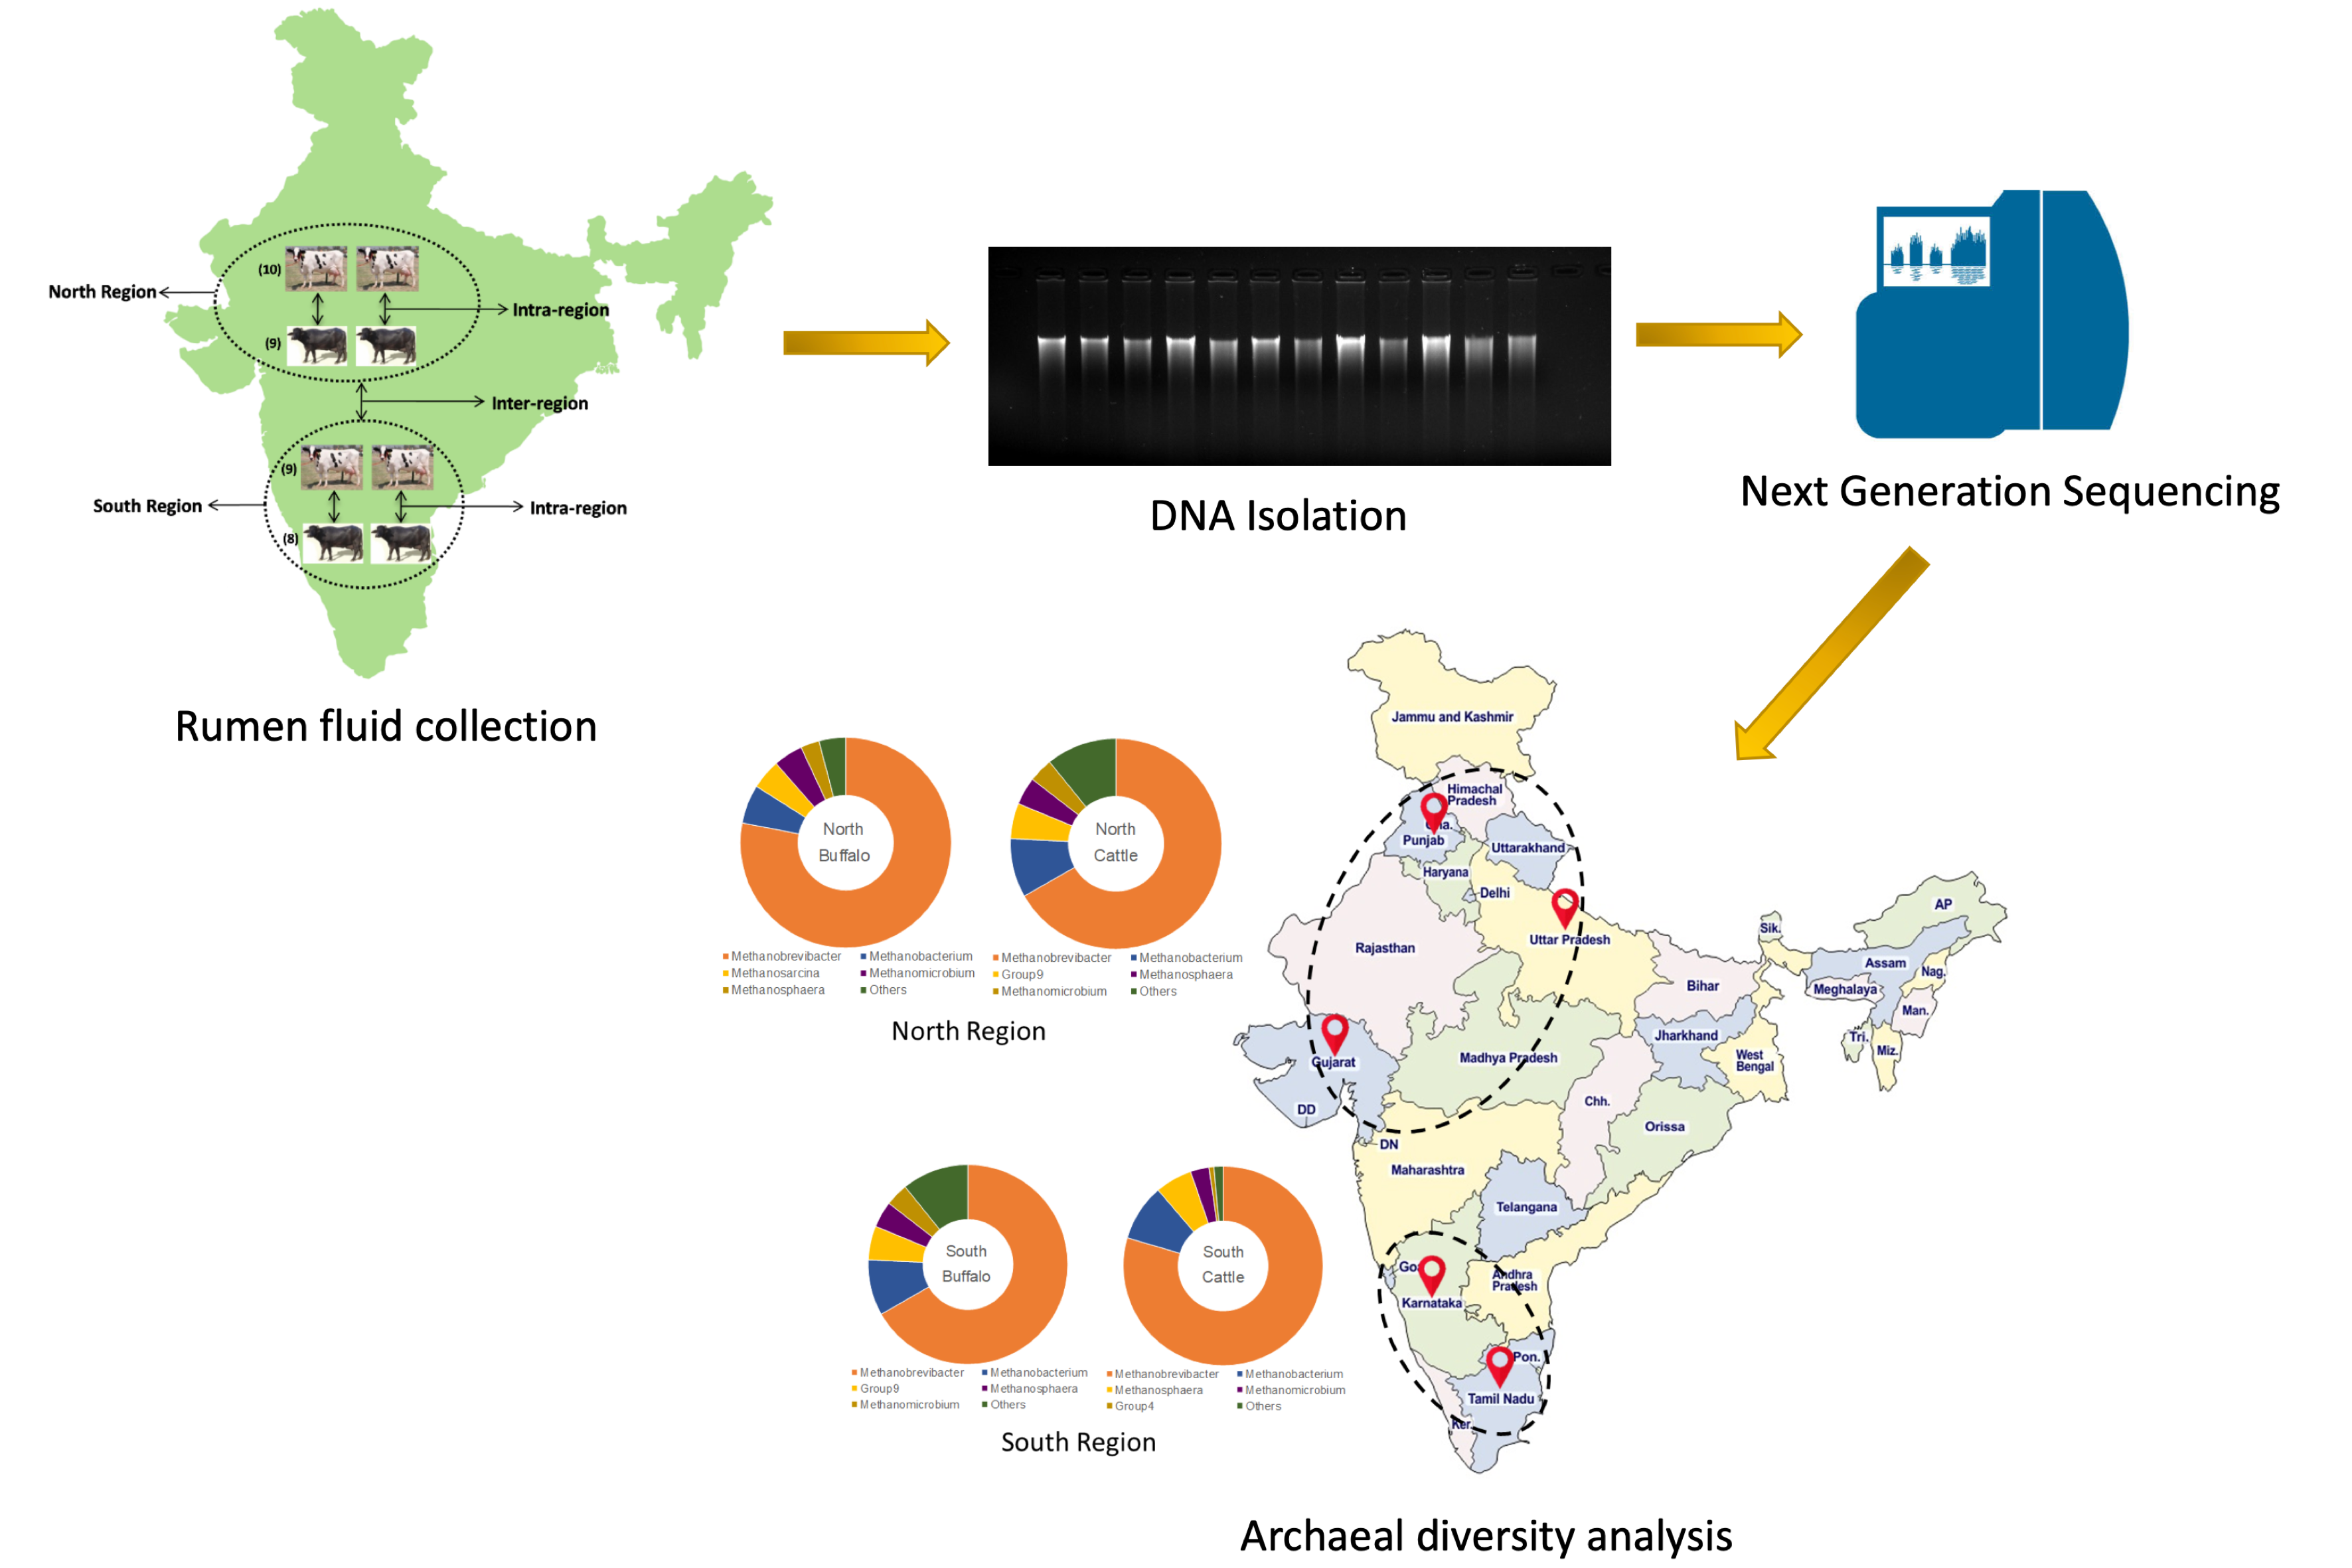
A total of 11.3 million paired end reads were generated from 36 rumen fluid DNA samples collected from cattle (N = 19) and buffaloes (N = 17) native to two distinct geographical regions of India. The corresponding paired end reads in cattle and buffaloes were 6.99 and 4.31 million, respectively. Following the stringent quality filtering, about 1.55 million sequences (Table 1) were retrieved from both the cattle (0.8 million) and buffaloes (0.74 million). The sample wise filtering details and number of sequences retained at each step are provided in Additional file 1, Table S1. Rarefaction curve for Shannon index and observed OTUs confirmed that the archaeal diversity was adequately covered (Additional file 1, Fig. S1a and b). The non-chimeric sequences were clustered into 2,583 ASVs.
Table 1
Summary of raw and filtered sequences
| Host species | Region | Raw sequences | Filtered sequences | % Filtered sequences |
| Cattle | North | 4551909 | 445492 | 9.79 |
| | South | 2445566 | 363215 | 14.85 |
| Total | | 6997475 | 808707 | 11.56 |
| Buffaloes | North | 2984245 | 457068 | 15.32 |
| | South | 1331570 | 287090 | 21.56 |
| Total | | 4315815 | 744158 | 17.24 |
| Total (Cattle + Buffalo) | | 11313290 | 1552865 | 13.73 |
| Filtering of reads involved quality based filtering, denoising, merging of paired end reads and removal of chimeric sequences. |
The current study presents the findings on the comparative analysis of methanogen diversity in cattle and buffaloes at the country as well as intra- and inter-region level.
Country Level Diversity
Results from the study confirmed that the methanogens belonging to Methanobacteriales, Methanomicrobiales and Methanomassiliicoccales orders were present in the rumen of cattle and buffaloes (Fig. 2). Among the Methanobacteriales, Methanobrevibacter (Mbr.) constituted largest fraction of the rumen archaeal community in both cattle ( ̴ 55%) and buffaloes ( ̴ 62%), although the difference in its abundance between the two bovine species was statistically insignificant. Mbr. gottschalkii clade was the most prominent species in both cattle and buffaloes, however, their abundance was significantly higher (P = 0.015) in cattle. Methylotrophic methanogens (Methanomassiliicoccales) represented approximately 2–4% of the total rumen archaeal community; nevertheless, they were significantly different between cattle and buffaloes (Additional file 2). Particularly, the abundances of Group 8 and Group 12 genera were significantly higher in cattle (P = 0.0011 and 0.0002, respectively), whereas, the distribution of Methanomicrobium (Mm.) Methanobacterium (Mb.) was higher in buffaloes, but not statistically significant. Among the Methanobrevibacter species, Mbr. wolinii was exclusively identified in the cattle. As expected, a large fraction of the rumen archaea (20–30%) remained unclassified in the current study.
Inter-region Diversity
Similar to the country level, Methanobrevibacter was the most dominant genus in the cattle from both north and south regions (Fig. 3a and Additional file 3), although their distribution was statistically insignificant. However, Mbr. gottschalkii clade was significantly higher (P < 0.00016) in the cattle from the southern region. The diversity of methanogens affiliated to Methanobacterium, Methanomicrobium and Methanosphaera was not significantly different in cattle across the geographical regions. Moreover, the distribution of methylotrophic methanogen species, including Group 4 (P = 0.001), Group 8 (P = 0.011), Group 10 (P = 0.001) and Group 9 (P < 0.001) was higher in the cattle from the northern region (Additional file 2). Mbr. wolinii and Group 12 sp. ISO4 H5 methanogens were exclusively identified in cattle from the south and north regions, respectively (Fig. 3a).
Comparative analysis of methanogen diversity between the two geographical regions revealed a significantly higher abundance (P = 0.024) of Methanobacterium in the buffaloes from the southern region. Unlike in cattle, the Group 12 affiliated methanogens were identified in the buffaloes of both the regions (Fig. 3b and Additional file 3), but with a significantly higher (P < 0.001) abundance in the northern region (Additional file 2). The distribution of prominent rumen methanogen species, such as Mbr. gottschalkii clade, Mbr. ruminantium clade, and Mb. alkaliphilum was not significantly different between the two regions (Additional file 2). In contrast to cattle, the distribution of Mm. mobile was significantly higher (P = 0.022) in buffaloes from the southern region. Similarly, the abundance of Group 4 sp. MpT1 was higher in the buffaloes of southern region (P = 0.001), whereas, that of Group 12 sp. ISO4 H5 was more in the northern region (P = 0.017).
Intra-region Diversity
Comparison of methanogen diversity between the bovine species within the geographical regions indicated a higher abundance of Methanobrevibacter (P = 0.0003) and Methanomicrobium (P = 0.0002) in buffaloes in the northern region. However, Group 8 (P = 0.003) and Group 9 (P = 0.009) were comparatively higher in cattle (Fig. 4a and b, Additional file 2). Furthermore, at species level, the distribution of Methanosphaera sp. ISO3 F5, Group 4 MpT1, Group 8, Group 12 sp. ISOH5 and Group 9 sp. was higher in cattle than buffaloes (Fig. 4a and b, Additional file 2). On the contrary, the prominent methanogen species, such as Mbr. gottschalkii clade and Mbr. ruminantium clade did not differ significantly between the two host species within the geographical regions.
Unlike in the north region, Group 4 was the only genus that showed significant differential abundance between cattle and buffaloes (P = 0.013) in southern region (Fig. 4b, Additional file 2). Furthermore, in the southern region, Mbr. gottschalkii clade had a higher abundance (P = 0.035) in cattle than in buffaloes, whereas, the abundance of Group 10 sp. was two times more in the buffaloes (P = 0.0047).
Methanogens, such as Mbr. wolinii and Group 9 sp. were exclusively present in the cattle; while Group 12 sp. ISO4 H5 was exclusive to buffaloes from the southern region. However, all the identified methanogen genera and species in the northern region were found in both cattle and buffaloes. The abundance of methanogens between the two regions and host species has been presented in Additional file 1, Figure S2 and S3, respectively. Additional file 4 and 5, respectively provide the number of sequences classified at genus and species level for the individual samples.
Core Microbiome Analysis
Core microbiome analysis revealed that five genera were shared between cattle and buffaloes at a minimum detection threshold of 0.001%. The prevalence of Group 4, Group 9 and Methanimicrococcus was observed only in cattle (Fig. 5a). Mbr. gottschalkii clade, Mbr. ruminantium clade and Mb. alkaliphilum were the most prevalent species in both cattle and buffaloes (Fig. 5a). Furthermore, the core microbiome analysis showed Methanobrevibacter and Methanobacterium to be prevalent in cattle and buffaloes across northern and southern regions (Fig. 5b-e). Interestingly, Methanomassiliicoccales related methanogens were not prevalent in south buffaloes (Fig. 5e), whereas, the prevalence of Methanosphaera was not observed specifically in the northern counterpart (Fig. 5d). At species level, Mb. alkaliphilum and Mm. mobile were core microbiome members in both the bovine species and regions except in south cattle and south buffaloes, respectively.
Diversity Index
Alpha diversity for methanogen abundance assessed through Shannon index/ Pielou’s eveness for country, inter-region and intra-region analysis has been presented in Fig. 6. Shannon diversity index (Fig. 6a-c) revealed a significant difference in the methanogen abundance at country level (P = 0.014), inter-region (P = 0.002) and within the geographical region (P = 0.001). Similarly, the Pielou’s evenness analysis (Additional file 1, Table S2) established a significant difference (Fig. 6d-f) in the methanogen diversity in bovine species between the northern and southern regions (P = 0.008) and across the bovine species between the two regions (P = 0.0005).
The beta-diversity analysis showed a distinct pattern for the clustering of samples from northern and southern regions on qualitative (Fig. 7a) and quantitative (Fig. 7b) distance matrices. Furthermore, the samples from the same species (cattle or buffalo) were more closely clustered.
Network Analysis
Network analysis (Fig. 8a-d) revealed a strong correlation across the different genera of the rumen methanogens. In the northern region (Fig. 8a), Group 9 and Group 4 were positively correlated (r = 0.93, P = 7.56E-06) in cattle; whereas, Group 9 showed a negative correlation with Methanobrevibacter (r = -0.7, P = 0.010). Methanomicrobium and Group 8 were positively correlated (r = 0.96, P = 1.66E-06) in buffaloes (Fig. 8b); however, Methanomicrobium and Methanobrevibacter were negatively correlated (r = -0.93, P = 2.02E-05) within the northern region. A positive correlation between Methanimicrococcus and Group 4 (r = 0.95, P = 4.41E-06) as well as Group 4 and Methanomicrobium (r = 0.87, P = 5.83E-04) in cattle was evident in southern region (Fig. 8c and d). Furthermore, a negative correlation between Methanomicrobium and Methanobrevibacter was reported in buffaloes (r = -0.94, P = 5.68E-05). Heatmap also established a similar correlation among the methanogens between the two host species and regions (Fig. 8e).