Baseline clinical characteristics of patients with IgAN
There were 16 males and 14 females with average age of 39.5 years. The median of proteinuria was 1.32 g/d and mean eGFR was 85.45 mL/min/1.73 m2 of IgAN patients on biopsy. And the grading of the pathological lesions by Oxford classification is shown in Table 3.
Patients with IgAN had low expression level of C1GALT1
The expression levels of C1GALT1 in B cells were detected in IgAN patients and healthy control. We found C1GALT1 expression levels were remarkably downregulated in IgAN patients (IgAN vs. controls: 1.01 ± 0.19 vs 1.43 ± 0.11, p = 0.04, Figure 1).
Expression of C1GALT1 related with the Gd-IgA1 levels
Using the GalNAc-specific monoclonal antibody KM55, we examined the plasma levels of Gd-IgA1 in patients with IgAN and healthy control. In our cohorts, the plasma level of Gd-IgA1 in patients with IgAN ranged from 8.55 to 14.48 U/mL, whereas it ranged from 3.97 to 12.15 U/mL in healthy control. We found that Gd-IgA1 levels were remarkable high in IgAN patients compared with healthy control (p < 0.001, Figure 2). And the mRNA levels of C1GALT1 were inversely correlated to Gd-IgA1 levels (r = -0.33, p < 0.001, Figure 3).
Meta-analysis
The literature search yielded 1052 articles, and eventually, six studies with 316 patients were included in our meta-analysis according to the inclusion criteria (Additional Figure 1). We included studies whose primary purpose was to elucidate the expression level and activity of C1GALT1 and the expression level of C1GALT1C1 in IgAN patients[5, 8-12]. Peripheral B lymphocyte was selected as target cell in 5 articles, and mononuclear cell in one article. Five studies compared the C1GALT1 and C1GALT1C1 mRNA expression levels and two measured the activity. Five studies were conducted in adult and one conducted in children. Of the contained six trials, four enrolled patients with IgAN and healthy control, two enrolled patients with IgAN, patients with non-IgAN glomerulonephritis and healthy control. The characteristics of the included studies were summarized in Table 2. These studies were performed from 1997 to 2016, with sample sizes ranging from 10 to 126.
Quality Assessment of Included Studies
The qualities of included studies, assessed with NOS (Newcastle-Ottawa Scale), are provided in Table 4. The mean total score was 5 with a range from 4 to 6.
C1GALT1 mRNA expression
We added own results to the final meta-analysis to elucidate the mRNA expression data of C1GALT1. Six articles including 316 participants that analyzed the expression of β1, 3Gal-T were included. There was no significant difference between IgAN patients and the total control group (weighted mean difference, -0.48 [95% CI -1.29 to 0.32], p = 0.24; I2 = 93%, p for heterogeneity < 0.001) (Figure 4). Subgroup analysis was performed according to different control group and different cell source. Four studies compared mRNA expression level of C1GALT1 in 106 IgAN patients and 44 disease controls and five studies conducted in 160 IgAN patients and 139 healthy controls. There was no apparent disparity between IgAN patients and non-IgAN patients (weighted mean difference, 0.26 [95% CI -0.08 to 0.60], p = 0.14; I2 = 0%, p for heterogeneity = 0.89) and healthy controls (weighted mean difference, -0.62 [95% CI -1.59 to 0.36], p = 0.21; I2 = 93%, p for heterogeneity < 0.001) (Figure 5).
In circulation, B lymphocytes are the major cells for IgA1 production. To explore the causal factor of the lymphocytes abnormality in patients with IgAN, in terms of β1, 3 galactosyltransferase induced Gd-IgA1 production, we detected the mRNA expression of C1GALT1 in B lymphocytes. A total of 4 studies enrolled 81 patients and 88 controls. Finding for this outcome was that patients with IgAN had low levels of C1GALT1 gene expression in the B lymphocytes compared to control (weighted mean difference, 0.39 [95% CI 0.08 to 0.69], p = 0.01; I2 = 96%, p for heterogeneity < 0.001) (Figure 6).
β1, 3Gal-T activity
Comparison of β1, 3Gal-T activity was reported in 2 trials including 46 persons, the result showed patients with IgAN had low levels of β1, 3Gal-T activity in the B cells compared to control (weighted mean difference, -2.43 [95% CI -4.33 to -0.52], p = 0.01; I2 = 80%, p for heterogeneity = 0.03) (Figure 7).
C1GALT1C1 expression
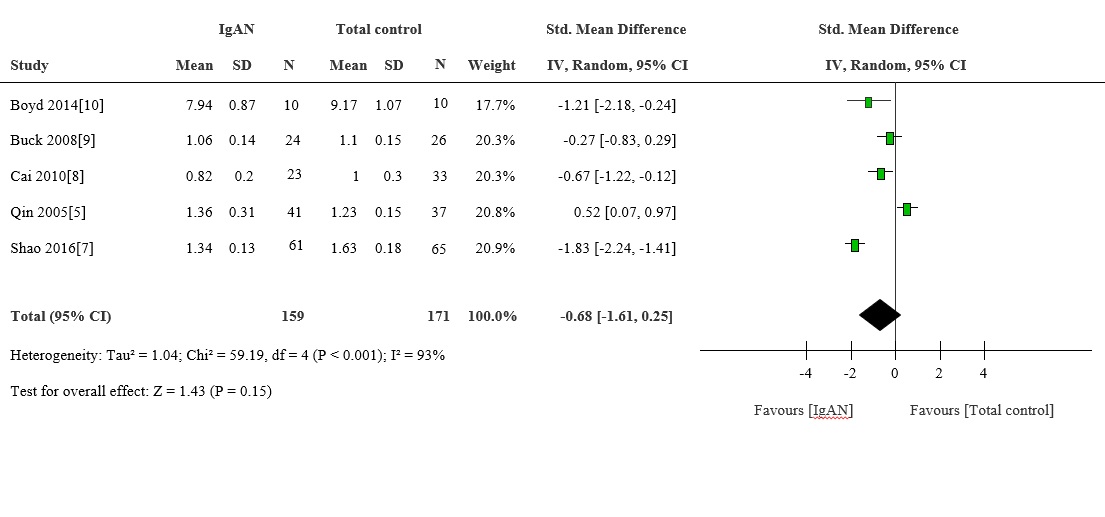
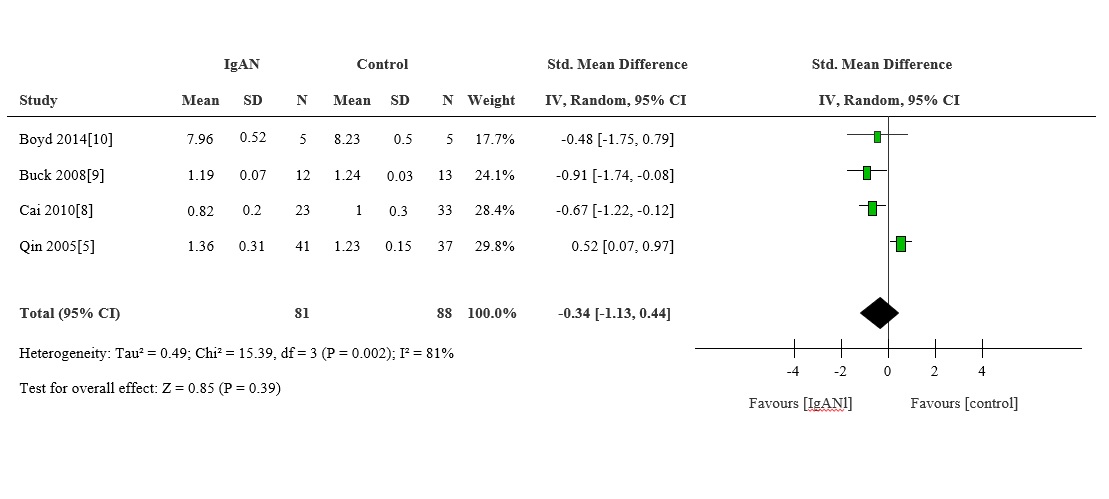
We also explored the expression of C1GALT1C1 in different groups. There was no significant difference between IgAN patients and the total control group (weighted mean difference, -0.68 [95% CI -1.61 to 0.25], p = 0.15; I2 = 93%, p for heterogeneity < 0.001) (Supplement Figure 1). And the same result occurred between IgAN patients and non-IgAN patients (weighted mean difference, 0.20 [95% CI -0.99 to 0.59], p = 0.62; I2 = 80%, p for heterogeneity = 0.007) and healthy control (weighted mean difference, -0.80 [95% CI -1.90 to 0.29], p = 0.39; I2 = 81%, p for heterogeneity = 0.002, Supplement Figure 2). Even in the B lymphocytes the levels of C1GALT1C1 gene expression that between IgAN and the control group had no significant difference (weighted mean difference, -0.34 [95% CI -1.13 to 0.44], p = 0.39; I2 = 81%, p for heterogeneity = 0.002, Supplement Figure 3). In the meantime, subgroup meta-analysis was conducted between Chinese and UK subjects. The result showed there were no different from the levels between different ethnic population (weighted mean difference, -0.66 [95% CI -2.09 to 0.77] vs -0.65 [95% CI -1.55 to 0.25], p for heterogeneity = 0.99, Supplement Figure 4).
Risk of bias
Formal statistical test showed that there was no publication bias in the expression of C1GALT1 compared between IgAN patients and total control (Begg’s test p = 0.452), which was showed in Additional Figure 2.