Design and Setting
This study utilized gene expression data to examine gene interactions in human adipose tissue of kidney transplant recipients. Tissue samples were obtained from investigators at a regional MidSouth transplant center, who recruited 153 transplant recipients from 2006-2011 to study the genetic and environmental factors associated with weight gain following kidney transplantation. Written informed consent was obtained from all participants, and some patients also signed an optional repository consent. The parent study was approved by the Institutional Review Board of the University of Tennessee Health Science Center. The additional analyses on the repository samples was approved by the Office of Human Subjects Research and the Institutional Review Board of the National Institutes of Health.
All adults, regardless of race and sex, were eligible for participation. To control for the effect of pre-transplantation immunosuppressant therapy on gene expression profiles, exclusion criteria included prior treatment with prednisone or other immunosuppressant therapies. Other exclusion criteria included underweight status (i.e., BMI <18.5 kg/m2) and pre-existing conditions that may impact weight, including gastrointestinal, pulmonary, neurologic, or gynecological diseases. Of the 153 transplant recipients, thirty signed a repository consent and also had RNA microarray data. Of these thirty participants, three were excluded due to excessive weight loss, which was determined to be a potential indicator of an abnormal recovery. An additional participants’ sample was excluded as it did not meet quality control criteria. A total of 26 participant samples were included in the current study.
Demographic and Clinical Variables
Demographic data (age, race, and sex) were collected from electronic medical records (Table 1). Clinical laboratory values were collected at the time of transplantation and at 3, 6, and 12 months post transplantation. Clinical variables were analyzed including height, weight, BMI, body fat, creatinine levels, and glucose levels. Body weight and height were used to calculate BMI (weight in kilograms divided by height in meters squared). Weight categories were selected as recommended by the Centers for Disease Control, with greater than 30 kg/m2 indicating obesity. Body fat was determined using DEXA scans. Blood samples were collected to determine laboratory values (e.g., fasting glucose and creatinine). Reference values of normality for creatinine and fasting glucose levels were 0.5-1.2 mg/dL and 70-100 mg/dL respectively.
The baseline clinical variables included weight (WT_BL), height, total subcutaneous body fat (SubTot_Fat_BL), percent of subcutaneous body fat (SubTot_Pfat_BL), whole-body fat percent (WB_Tot_Pfat_BL), body mass index at baseline (BMI_BL), blood creatinine (CREATININE_BL), and blood glucose (GLUCOSE_BL). The following variables were also measured at 3, 6, and 12 months after kidney transplantation: blood creatinine (CREATININE_3M, CREATININE_6M, CREATININE_12M) and blood glucose (GLUCOSE_3M, GLUCOSE_6M, GLUCOSE_12M). Other variables were measured at 12 months, including SubTot_Fat_12M, SubTot_Pfat_12M, and BMI_12M.
Additionally, other pre-existing conditions (i.e. hyperlipidemia, hypertension, diabetes and depression) were also collected from the medical charts and controlled for in our analysis. Adipose tissue samples were collected for all eligible participants at the time of transplant surgery. Participants followed similar immunosuppressant therapy for six months following transplantation, 80% received 20 mg prednisone, 8% received 10 mg of prednisone, and 4% received 50 mg of prednisone. Six months after undergoing a kidney transplant 92% received 5 mg of prednisone, and 8% did not take prednisone.
Microarray data processing and annotation
As a part of the parent study, RNA was extracted from adipose tissue samples and gene expression values were obtained by the authors and Cashion et al (18). For RNA extraction procedures please refer to Cashion et al (18). The expression values were generated by Affymetrix Human Gene 1.0 ST Array (GEO platform ID: GPL6244) and results were made available via GEO (https://www.ncbi.nlm.nih.gov/geo/, Dataset ID: GSE33070; annotation file: GPL6244.annot). These microarray data are publicly available, although due to privacy concerns only limited amount of demographic and clinical data for these subjects are publicly available. Such data are available to the authors on this paper through this current collaboration, though are still limited to the repository dataset (specific available variables are described above).
The microarray data were annotated using custom programs to process the annotation file and to generate mapping between genes and transcript IDs. For each gene, we selected the transcript with the highest average expression level to represent the expression of that gene. Using this process, we obtained a total of 19,192 gene expression profiles.
Constructing gene co-expression networks
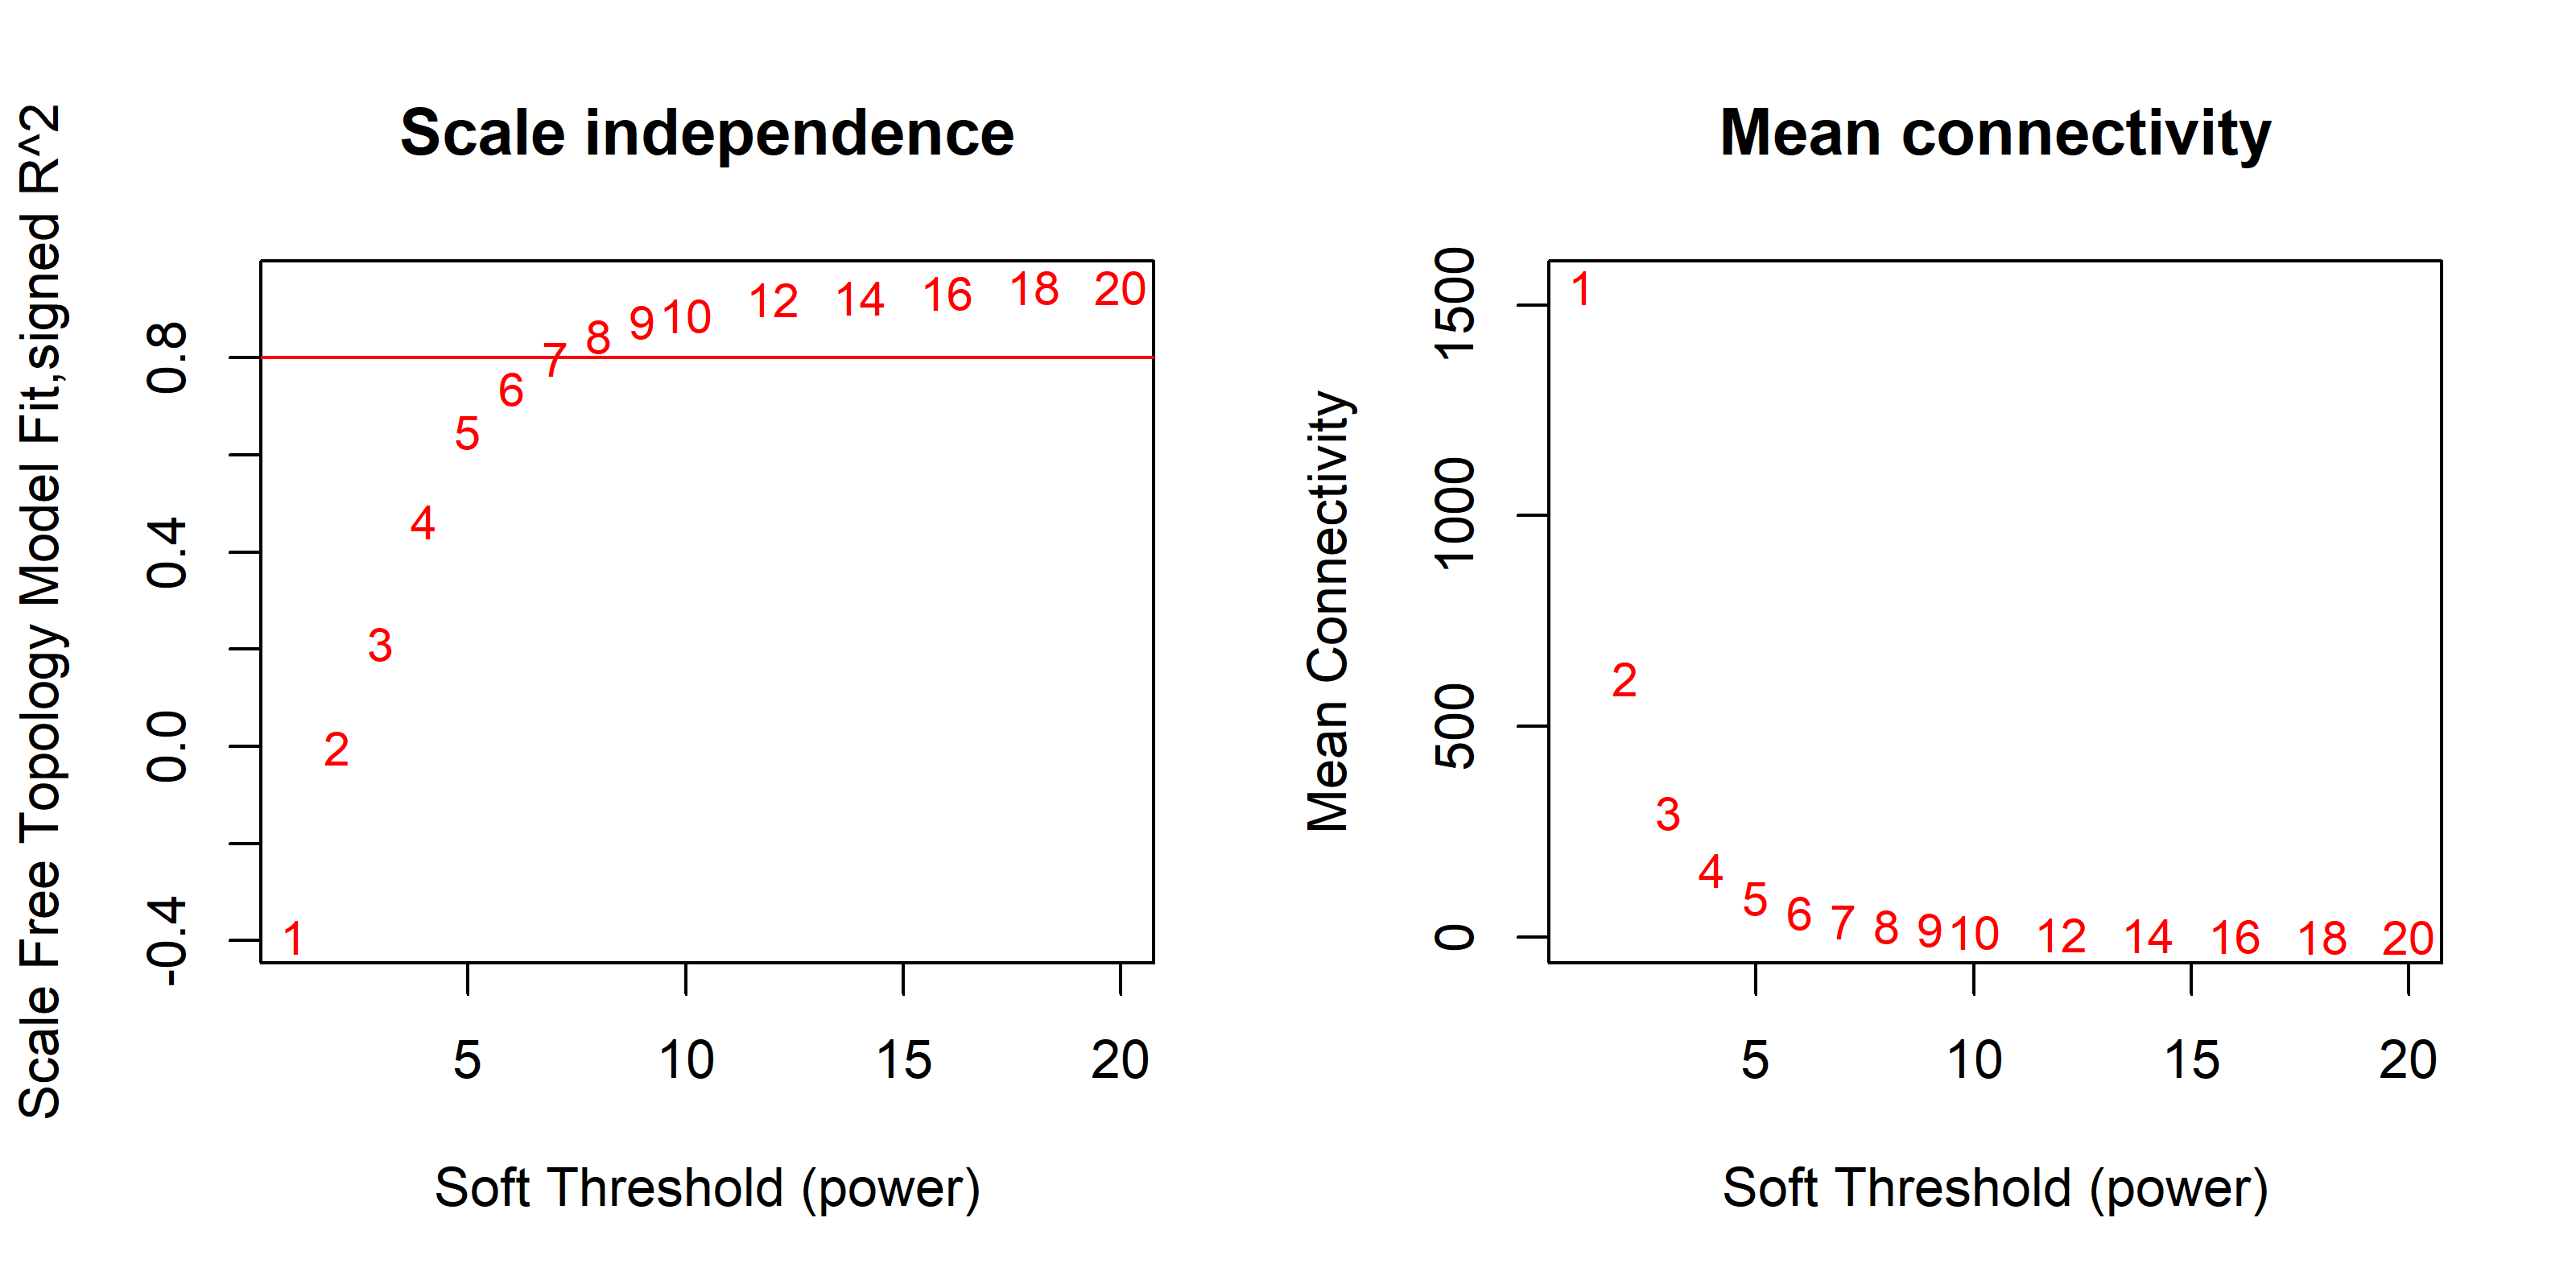
A total of 5,758 (30%) highly expressed genes were selected for co-expression network analysis. The WGCNA package was used to construct gene co-expression networks and examine their associations with clinical variables (20). A soft-threshold power of 7 was used as it met scale-free topology criteria (R2≈0.8) while generating reasonable module sizes (mean=37) (Figure S1). Then, one-step network construction and module detection were performed with the following parameters: TOMType = "unsigned", minModuleSize = 10, reassign Threshold = 0, and mergeCutHeight = 0.25. Next, for each detected gene module, its eigenvector (vectors associated with linear system equations) was computed. Module-trait associations were assessed based on the Pearson’s correlation between the eigenvector of each module and each clinical variable. Original P-values of module-trait associations were adjusted for multiple testing using the Benjamini-Hochberg (i.e. False Discovery Rate, or FDR) approach (21).
Enrichment analysis
Functional enrichment analysis was performed using the online version of GOStat (http://gostat.wehi.edu.au/cgi-bin/goStat.pl) (22). Parameters were chosen as follows: database: goa_human; minimal length of considered GO paths: 3; maximal p-value: 0.05; maximum number of GOs: 30; cluster GOs: 5; direction: over-represented; correct for multiple testing: false discovery rate. The 5,758 highly expressed genes were used as a genomic background to examine enrichment of co-expression gene modules.
Identification of hub genes in co-expression gene modules
Hub genes were identified using topology similarity as described previously by Joseph et. al. (17). Briefly, we used topology similarity to measure the comparability between gene expression profiles, and computed the topological matrix for the 5,758 highly expressed genes. Subsequently, 95% quantile of the topological matrix was used as the cutoff for determining whether two genes were connected. The connectivity of a gene was the number of genes connected with it in the same gene module. This hub gene identification method was custom built using R software. In our analysis, hub genes in co-expression gene modules were defined as genes with high connectivity (ranked at the top 10%) in the candidate modules.
Pathway analysis
Ingenuity pathway analysis (IPA), https://www.qiagenbioinformatics.com/products/ingenuity-pathway-analysis/ was used for functional analysis, integration, and interpretation of the biological role of the magenta and darkgreen modules. 129 genes within the magenta module and 36 genes within the darkgreen module were input separately into IPA and a “Core Analysis” was used to construct canonical pathways and networks. Canonical pathways were constructed to examine the role of genes within each module (i.e. their role in cell signaling and metabolic pathways). Networks were constructed to identify and visualize gene-gene interactions, each connection representing known relationships between genes. Identified networks were scored based on the degree of relevance (i.e. -log(Fisher's Exact test)) of their genes with a list of biological functions stored in the Ingenuity Knowledge Base. The Human Gene 1.0 ST Array was used as the reference background in order to reduce bias towards pathways identified in the default of option which uses the entire “Ingenuity Knowledge Base (Genes Only)” as a reference set. Additionally we ran the 5,758 highly expressed genes separately and compared the results. We report the findings, canonical pathways and networks, for the module results.