Data source and study population
This study used claim data from the National Health Insurance Service (NHIS) National Sample Cohort, a population-based cohort. The cohort had been first sampled in 2002 NHIS database and had been followed up until 2017. The NHIS enrolees cover approximately 97% of all Koreans, and with a random sampled rate of 2%, this sample cohort includes 1,000,000 individuals. We used data collected from 2014 to 2015, including 22,275,040 outpatient attendances across 29,912 office-based clinics. From this pool, we selected patients who had attended outpatient clinics for diabetes mellitus based on diagnosis records. The NHIS data contains diagnosis record for each attendance per subject in the form of ICD-10. To calculate continuity of care index without outliers, we excluded patients who attended less than 4 times and also eliminated those who attended more than 100 times during the follow up period12.
For these attendances, we identified the primary care provider for each patient, the most frequently visited clinic by the subject. We selected patients whose primary care provider was clinic-based (N=39,130) to focus on the continuity in primary care environment. Lastly, patients under age 20 were excluded (N=39,096). For example, if a known diabetic patient who attended local clinics 5 times between 2014-2015 for their diabetes care had a primary care provider based in a general hospital, they would be excluded from the analysis.
Measures
Continuity of care
To measure the continuity of care, we calculated three continuity care indices for each variable; most frequent provider continuity (MFPC), the modified-modified continuity index (MMCI), and the continuity of care index (COC). These three indices must have a value between 0 and 1 intrinsically according to the formula below.
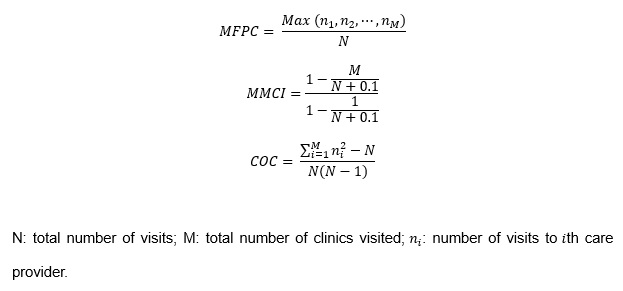
MFPC is the ratio of number of visits to primary care physician to total number of visits to all physicians, which shows the concentration of visits to the primary physician13. When calculating MMCI, the number of clinics the patient had visited is included. Therefore, MMCI also reflects the distribution across clinicians, which is not accounted in MFPC 14. COC combines both characteristics of MFPC and MMCI, but also takes the degree of concentrated visits to each clinic into consideration15. Thus, if COC value was 0, it would indicate that the patient had visited a different clinician each time. If COC index was 1, it would mean the patient only visited a single physician for all their diabetes care.
Patient factors
The data includes basic patient information; age, sex, residential area, average monthly insurance premium, and the presence of disability. We defined the patients’ ages as those at 2014 and divided the ages into four groups with ranges of 20 years each. Residential area was provided according to the administrative division-Gu, not the specific geographical information. We allocated the residential area into one of four groups: Seoul (capital city), Gyeonggi-do (province), Metropolitan city, and other areas. Average monthly insurance premium was also included in the data because it is correlated to household income. Although initially insurance premiums were graded from 1 to 10, lowest to highest, we further categorized the 10 grades into three groups: 1–3, 4–7, and 8–10. The presence of disabilities was arranged into three groups: absence, mild disability, and severe disability.
Clinic factors
We analyzed the most frequent care provider for each patient, established them as the primary care provider, and combined it with the given clinic information: specialty of primary physician, number of hired physicians and nurses, hospitalization facility, and geographical location. Although clinics may employ doctors with various specialities, only the single, main medical specialty that they report to the government was taken into account. For instance, even though an internist employed a dermatologist and a general practitioner, they would report as an internal medicine clinic. Medical specialities that were accountable for diabetes treatment of more than 1% of selected patients were included in our multivariable model.
Geographical relationship
This variable indicates whether the patient’s residential area and their primary physician’s clinic are located in the same Gu (Korean administrative district), and therefore, represents the geographical proximity of the two factors.
Statistical analysis
For each continuity index, patients were first categorized into two groups of high and low continuity group. The lower quartile (25th percentile) was used as the cut-off value to divide the groups. The median of all indices was equivalent to 1, an inappropriate value to discern the disparity of continuity between the groups. We employed the chi-squared test to evaluate the differences between low and high continuity groups for each baseline characteristic.
We applied multivariable logistic regression to investigate the association between level of continuity and each factor. There are three geographical variables: patient’s residential area, clinic location, and concurrence of both factors. When performing multivariate analyses adjusted for patient factors and clinic factors, we excluded the primary physician’s clinic location factor to ensure minimal confounding effect. Because there is no confirmed standard in continuity of diabetic patients, the most common group in each variable was selected as the reference group.
Odds ratios (OR) and their 95% confidence intervals (CI) were measured. All analyses were performed with SAS Enterprise Guide 7.1 (SAS Institute Inc., Cary, NC, USA), and two-sided P values <0.05 were considered statistically significant.