Characteristics of the population
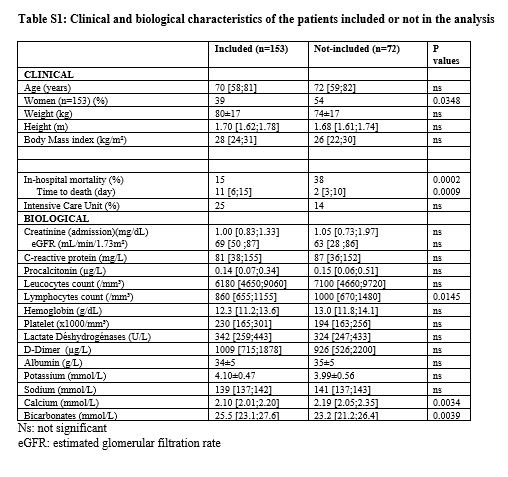
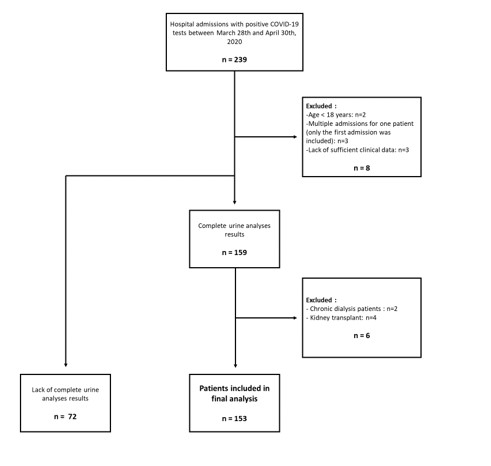
The final cohort included 153 patients (flowchart of patients’ inclusion in Figure S1). The median time period between admission and D0 was 3 [2;5] days. The patients excluded from the analysis because of the lack of urine samples (n=72) were more frequently women and had a higher and earlier mortality rate (Table S1). The median age of our cohort was 70 [58-81] years old, and 39% were women (Table 1). COVID-19 patients were characterized by high serum CRP and LDH concentrations and low lymphocyte number (Table 1). Eighty-two % of patients were staged as severe pneumonia. Twenty-three (15%) patients died during the hospitalization and 4 deaths occurred after the patient left the hospital leading to a mortality rate of 18% during the study period. At the end of the follow-up, 17 were still hospitalized.
Renal parameters
On D0, serum creatinine concentration was higher than normal in 27% of patients. A decreased renal function on D0 was observed in 24% of patients.
Proteinuria
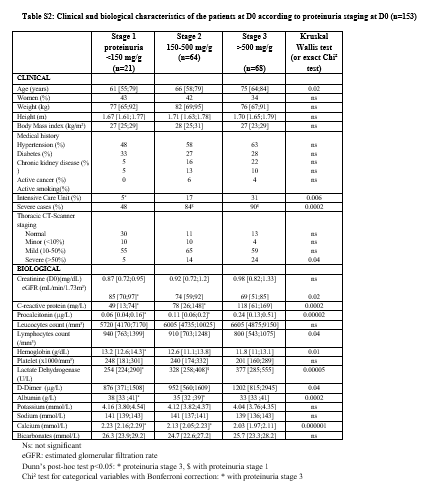
The median proteinuria in our 153-patient cohort was 455 [238;834] mg/g at D0. Fourteen percent (n=21) had stage 1 proteinuria, 42% (n=64) had stage 2 and 44% (n=68) had stage 3. Two patients had heavy proteinuria (over 3500 mg/g). Clinical and biological characteristics according to proteinuria stages are shown in Table S2. Among the 153 patients, a pre-admission value of proteinuria was available for 51 patients within a median preceding time of 383 [161;836] days. Among the 32 patients with prior abnormal proteinuria, only 2 had normal proteinuria at D0. Conversely, among the 19 patients with prior normal proteinuria, only 4 remained within the normal range during the study period. One of the two patients with heavy proteinuria during COVID-19 had a normal proteinuria documented 57 days before D0. Limiting analysis to 112 patients with less than 10 RBC per field, abnormal proteinuria was still found in 81% of patients. Among the 114 patients without UC, 82% had proteinuria (38% with stage 3). Among the 122 patients without decreased eGFR on D0, 83% had abnormal proteinuria (43% with stage 3).
The median urinary concentrations of α1-microglobulin and β2-microglobulin (n=94) were 54 [27;122] mg/g and 2.65 [0.40;14.15] mg/L, respectively. α1-microglobulin concentration was higher than 10 and 15 mg/g in 94% and 89% of patients, respectively. Urine β2-microglobulin was higher than 0.19 mg/L in 85% of patients. Among the 114 patients without UC, urine α1-microglobulin over 15 mg/g and urine β2-microglobulin over 0.19 mg/L were found in 86% and 84%, respectively. Among the 122 patients without decreased eGFR on D0, 87% and 83% had α1-microglobulin and β2-microglobulin concentrations over 15 mg/g and 0.19 mg/L, respectively.
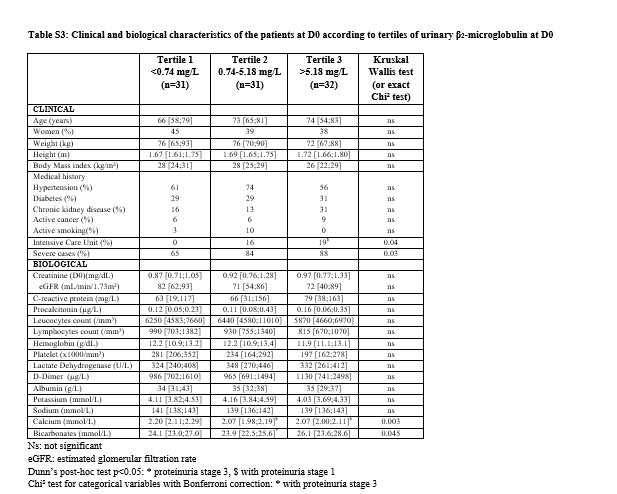
Table 2 describes the clinical and biological characteristics of the patients according to tertiles of urine α1-microglobulin and Table S3 describes the clinical and biological characteristics of the patients according to tertiles of urine β2-microglobulin.
Hematuria
The incidence of hematuria in the 153-patient cohort was 36% and 26% if the threshold of 5 or 10 RBC per field was considered, respectively. In patients without UC (n=114), the prevalence of hematuria (>10 RBC per field) was 13%.
Factors at D0 associated with mortality
Mortality was assessed for all patients on May 7th 2020 with a median follow-up of 27 [14;30] days, D0 being the reference date. During the follow-up, 27 patients died (18%). The median time period between D0 and date of death was 7 [4;12] days.
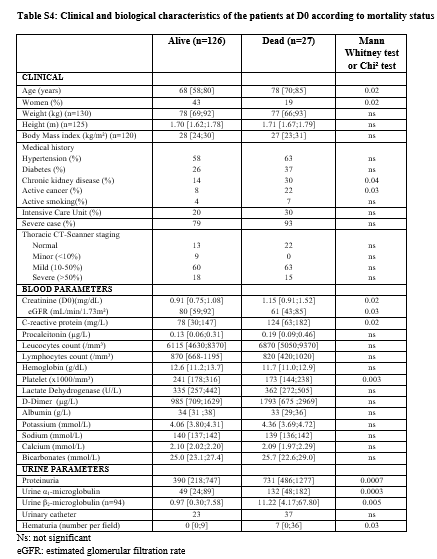
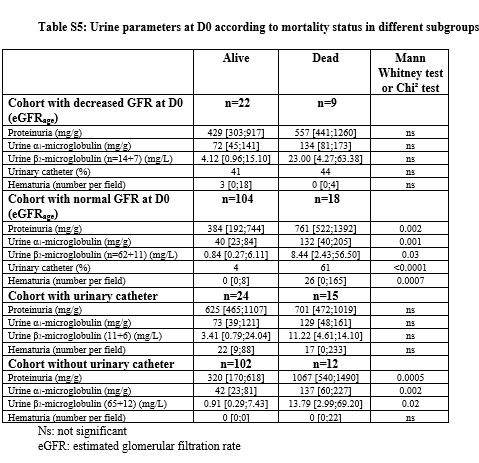
Comparison of variables at D0 between patients who died versus survived is shown in Table S4. The patients who died were older, more frequently men and had more frequently a history of CKD and known active cancer. They had lower eGFR, lower platelet counts and higher CRP concentrations. For urine parameters, proteinuria, urine α1-microglobulin, urine β2-microglobulin, number of RBC per field and UC were also significantly higher in deceased patients. Urine analyses were also performed in sub-groups and showed similar results (Table S5).
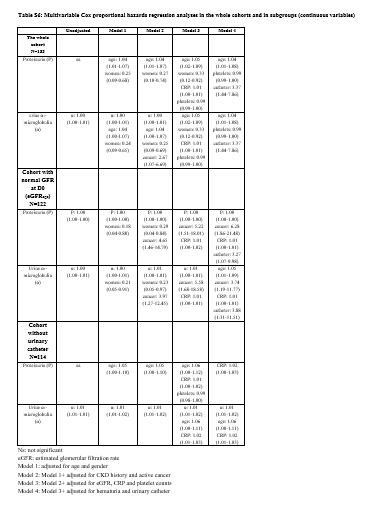
In univariate Cox proportional hazards regression analysis, the following parameters were associated with mortality: age (HR 1.03 95% CI: 1.00-1.06, p=0.03), male gender (HR 2.94 95% CI: 1.22-7.69, p=0.02), history of CKD (HR 2.35 95% CI: 1.03-5.38, p=0.04), active cancer (HR 2.95 95% CI: 1.19-7.34, p=0.02), eGFR (for 10 unit decrease: HR 1.16 95% CI: 1.01-1.34, p=0.03), CRP (for 10 unit increase: HR 1.04 95% CI: 1.00-1.08, p=0.04), platelet counts (for 10.000 unit decrease: HR 1.01 95% CI: 1.00-1.01, p=0.004), stage 3 proteinuria (versus stage 2: HR 2.83 95% CI: 1.19-6.72, p=0.02), urine α1-microglobulin as a continuous variable (for 10 unit increase: HR 1.03 95% CI: 1.01-1.05, p=0.004) or categorical variable (tertiles 3 versus 1: HR 5.41 95% CI: 1.83-16.00, p=0.002 and tertiles 3 versus 2: HR 4.40 95% CI: 1.63-11.90, p=0.004), hematuria (HR 2.82 95% CI: 1.32-6.01, p=0.007) and bladder catheterization (HR 4.18 95% CI: 1.95-8.95, p=0.0002). Kaplan Meier survival curves for proteinuria stages, urine α1-microglobulin tertiles and hematuria (RBC more than 10 per field) as strata are shown in Figure 1. High tertiles of proteinuria and urine α1-microglobulin and hematuria were associated with lower survival (logrank test, p=0.008, 0.0001 and 0.005, respectively). Focusing on urine variables, multivariable Cox adjusted analyses are shown in Table 3 for categorical variables and in Table S6 for continuous ones. Urine α1-microglobulin (when considered as a categorical variable) was still associated with mortality in the adjusted models, except when the variable UC was included. Hematuria as a continuous variable was not associated with mortality (data not shown) but well as a categorical variable in the adjusted models. However, such association was not observed in the subgroup of patients without UC. The presence of UC was highly predictive of mortality in all models. In patients with normal eGFR on D0, proteinuria (as a continuous and a categorical variable) and urine α1-microglobulin (as a categorical variable) were still associated with mortality in the full-adjusted model. The same results were observed in the sub-group without UC at D0. Forcing variables like score severity and hospitalization in ICU at D0 in the Cox models did not modify the results.
Follow-up results at day 7
Among the 153 patients, 76 left the hospital less than 7 days after D0. Among the 77 patients still hospitalized at D7, 48 had a second measurement of proteinuria. Among them, the median concentration of proteinuria and urine α1-microglobulin at D0 was 493 [307;929] mg/g and 76 [37;144] mg/g, and 280 [170;521] mg/g and 60 [34;125] mg/g at D7, respectively. The median decrease in proteinuria and α1-microglobulin concentration was -178 [-531;-52] mg/g (relative decrease of 43%) and -17 [-56;32] mg/g (relative decrease of 21%), respectively. Excluding the patients who died during the study period (n=8) and those who were still hospitalized on May 7th (n=6), it leaves 34 patients who left the hospital alive with a median concentration of proteinuria and α1-microglobulin on D0 of 483 [302;1062] mg/g and 60 [33;138] mg/g, and of 203 [109;328] mg/g and 34 [14;84] mg/g on D7, respectively. The median decrease in proteinuria and α1-microglobulin concentration was -256 [-717;-98] mg/g (relative decrease of 58%) and -20 [-91;-3] mg/g (relative decrease of 43%), respectively. Among these patients, proteinuria stage 1, 2 and 3 was observed in 9%, 44% and 47% respectively on D0. The prevalence was 32%, 50% and 18%, respectively on D7. Among the 3 patients with stage 1 on D0, 2 progressed to stage 2 at D7. Among the 15 patients with stage 2 on D0, 8 decreased to stage 1, one progressed to stage 3 and 6 remained at stage 2 on D7. Among the 16 patients with stage 3 on D0, 2 decreased to stage 1, 9 to stage 2 and 5 remained at stage 3 on day 7.