Identification of the ADK family in tomato
To identify the ADK family in tomato, unigenes were searched in the SOL Genomics Network and a hidden Markov model search was used to scan probable proteins. After confirming the existence of the ADK core sequences according to the description in tomato genome database and the Pfam and SMART programs, a total of 11 ADK genes were identified. Based on their chromosomal locations, the genes were assigned as SlADK1-11. Gene information of each ADK gene and physicochemical properties of matched proteins were predicted with tomato gene database and ExPASy online tool, respectively. The names and IDs of genes, chromosomal and strand locations, open reading frame lengths, exon numbers, amino acid numbers, molecular weights (MWs), isoelectric points (pIs) are listed in Table 1. Predicted subcellular location of SlADK proteins are listed in Table 2. The coding sequence (CDS) and gene sequence of the SlADK family are found in Table S1. The lengths of the SlADK proteins ranged from 630 (SlADK1) to 1989 amino acids (SlADK11) and the corresponding range for MWs was 22872.10- 74110.62 Da (Table 1). The 11 SlADK genes were distributed on nine tomato chromosomes, with SlADK3 and 4 located in forward strands and the others in reverse strands. The predicted pI values of SlADKs ranged from 5.76 (SlADK1) to 8.83 (SlADK4). Prediction results of subcellular localization based on four different online tools revealed that most SlADK proteins were presumably located in mitochondria (e.g. SlADK2, 3, 4 and 6); SlADK1 and 5 may located in cytoplasmic; and SlADK8 and 11 may located in chloroplast. Interestingly, SlADK9 may located in cytoplasmic or nuclear, and SlADK10 may located in chloroplast or mitochondria.
Phylogenetic analysis and multiple sequence alignment of SlADK genes
The phylogenetic relationship of tomato SlADK proteins, together with seven Arabidopsis AtADKs, twelve potato StADKs and seven rice OsADKs were examined by multiple sequence alignment with full lengths of the amino acid sequences. Then the phylogenetic analysis was conducted by MEGA7 based on the aligned results, and the neighbor-joining method was used with bootstrap replications of 1000. The ADK family was divided into six groups (Fig. 1A). SlADK6 and 10 together with two potato homologs (Sotub09g006620 and Sotub04g013920), two Arabidopsis homologs (AT2g39270 and AT2g37250) and one rice homolog (Os03t0130400) were phylogenetically distinct and formed the predicted first branch of plant ADKs. The second branch contained two isoforms of potato (Sotub02g037180 and Sotub03g005270), one isoforms of Arabidopsis (AT3g01820), two isoforms of rice (Os08t0118900 and Os07t0412400) and two of tomato (SlADK2 and 3). The third branch contained three evolutionarily similar subbranches: SlADK1 and Sotub01g028550; SlADK4 and Sotub03g020180; and SlADK9 and Sotub08g022760. The fourth branch contained two isoforms of potato (Sotub06g024300 and Sotub11g015570), one isoforms of Arabidopsis (At5g47840), one isoforms of rice (Os08t0109300) and one of tomato (SlADK8). The fifth branch contained four subbranches: At5g50370 and At5g63400, SlADK5 and Sotub03g023880; SlADK7 and Sotub05g016010; and Os12t0236400 and Os11t0312220. At last, SlADK11 together with Sotub12g00740, Os08t0288200 and AT5g35170 were formed as branch VI. Multiple sequence alignment of SlADK proteins was performed using ClustalX 1.83 and DNAMAN software (Fig. 1B). Because the amino acid sequence of SlADK11 was much longer than other proteins, the last comparison part which only contained ADK11 C- terminal amino acids is not shown in Fig. 1B.
Motif analysis
According to the amino acid sequences, the MEME web server was used to search the conserved motifs that were shared with the SlADK proteins. A total of 10 distinct conserved motifs were found and the number of the motif residues ranged within 38- 50 amino acids; details of the conserved motifs are shown in Fig. 2A. Each SlADK protein contained five to eight conserved motifs. It is worth noting that motifs 1, 2 and 4 were fundamental in the ADK domains because they were shared by all SlADKs (Fig. 2B). Among the three motifs, motif 2 has been marked in Fig. 1A because the conserved domain belonged to it. As shown in Fig. 2B, some SlADKs (e.g. SlADK1 and 9, SlADK2 and 3, and SlADK5 and 7) shared common motif compositions which supported the grouping results. In addition, motif 7 was unique to SlADK5 and 7 at the N-terminal, and motif 9 was unique to SlADK2 and 3 at the C-terminal. The specific motifs may contribute to the functional divergence of SlADK genes. In order to better annotate function of genes, the sequence of each motif has been performed blast in pfam and SMART database, the prediction result showed that except motif 7 to10 were too short to predict, motif 1 to 6 all contained ADK domain (Table S3).
Gene structure and chromosomal location analysis of SlADKs
Gene organization plays a vital role in the evolution of multiple gene families [36]. The neighbor-joining phylogenetic tree constructed with MEGA7 is shown in Fig. 3A, which was consistent with the result in Fig. 1A. Corresponding to each gene, the genomic sequence and cDNA sequence information were submitted to the Gene Structure Display Server together to show the gene structure. Among these genes, the average gene length was 1610-9218 bp. SlADK 11 had the maximum number of exons and the longest gene length, while SlADK2 was the shortest genes. Each gene had 4-19 exons and the majority of SlADKs harbored four exons (SlADK2, 3, 6 and 10) (Fig. 3A, Table 1). The result also revealed that genes closed to each other in phylogenetic tree had similar gene structure, such as SlADK2 and 3, SlADK6 and 10, SlADK5 and 7, and SlADK1 and 9. Tomato contained 12 chromosomes, the 11 SlADKs were distributed on nine of them randomly (Fig. 3B). The majority of SlADKs were located on the proximate or distal ends of the chromosomes. Chromosome 03 had the greatest number of predicted SlADKs, with three (SlADK3-5), and no SlADK existed on chromosomes 07, 10 and 11. Only one SlADK existed on each of the other eight chromosomes.
Cis-regulatory elements in SlADK promoters
To pave the way for further study of potential gene function and regulatory mechanism of the SlADK family, especially during abiotic stress responses and hormone treatment, the 1500-bp upstream sequences from the translation start sites of SlADKs were submitted to PlantCARE to detect cis-regulatory elements (CRE). After screening, CRE related to stress and hormone were retained and detailed information could be found in Table S4. Also, the location and number of representative 17 CRE (ABRE, ARE, AuxRE, Box4, CGTCA-motif, G-box, GATA-motif, LTR, MRE, MYB, MYC, P-box, TATC-box, TC-rich, TCA-element, TGA-element, TGACG-motif) were visualized on each gene with GSDS software (Figure 3C). The upstream regulatory sequence of promoters contained multiple elements that respond to hormones (such as Box 4 and G-box, TGACG-motif) and stress signals (such as TC-rich, LTR, MYB- and MYC-binding sites), which indicated that expressions of SlADKs were associated with abiotic stresses and hormone signal transduction response. It is worth noting that from the promoter region of -1500 bp to -700 bp, cis-regulatory elements of SlADK11 and 1 were less distributed and almost nonexistent, respectively.
Synteny analysis of SlADK genes
Synteny analysis of SlADK genes were conducted to investigate the duplication event occurring in the tomato ADK family (Fig. 4A). Three duplication events were observed between chr01 and chr08 (SlADK1 and SlADK9), chr02 and chr03 (SlADK2 and SlADK3), and chr04 and chr09 (SlADK6 and SlADK10), which evolved from segment duplication. Interestingly, each gene pair existed duplication events belonged to the same subfamily in the phylogenetic tree (Fig. 3A). To further infer the phylogenetic mechanisms of tomato ADK gene family, we constructed two comparative syntenic maps of tomato associated with two representative species, rice and potato (Fig. 4B). The homology between tomato and potato are closer because they both belong to solanaceae while rice belongs to gramineae. Our result revealed that ten SlADK genes showed syntenic relationship with potato genes (SlADK1 and Sotub01g028550, SlADK2 and Sotub02g037180, SlADK3 and Sotub03g005270, SlADK5 and Sotub03g023880, SlADK6 and Sotub04g013920, SlADK7 and Sotub05g016010, SlADK8 and Sotub06g024300, SlADK9 and Sotub08g022760, SlADK10 and Sotub09g006620, SlADK11 and Sotub12g007490), while no collinear relationship existed of ADK genes between rice and tomato.
Expression patterns analysis of SlADKs
Comprehensive transcriptomic profiling of 11 SlADKs in tomato vegetative and reproductive tissues was carried out using the online TomExpress platform and associated data mining tools (http://gbf.toulouse.inra.fr/tomexpress) (Fig. 5A and Fig. S1). Gene SlADK1 was seldom expressed in all tomato tissues. Genes SlADK5 and 10 showed higher expression in seed and root than other genes; SlADK10 showed increased expression in flower and fruit, peaking at bud in 3 mm and stage of mature green fruit (35 DPA). Expression of SlADK5 was enhanced at the onset of fruit development and reached its peak at mature green fruit (35 DPA); however, during ripening, its expression decreased until increasing again during the red fruit stage. Some genes such as ADK2 and 6 exhibited relative moderate expression in all tissues. Of particular interest, SlADK3, 8 and 9 were the most highly expressed during late fruit ripening, displaying a net up-regulation at the onset of ripening starting after the mature green stage. This pattern of expression suggests a potential role of these genes in regulating the ripening process.
To assess the potential roles of SlADKs throughout tomato development, we conducted detailed quantitative real-time PCR (qRT-PCR) to examine transcription in different tissues (Fig. 5B and C). In non-fruit tissues, including root, stem, leaf, bud and flower, SlADK1 and 4 showed similar expression patterns. Notably, the expression levels of most SlADKs was drastically enhanced in bud compared to other tissues and expression of SlADK2 was much higher in bud. Genes SlADK2, 3, 6, 7, 8 and 10 also showed similar expression patterns, possibly indicating redundancy of gene function. Interestingly, SlADK11 expression was higher in leaves than other tissues. Additionally, expression of SlADK5 and 9 showed little difference among tissues (Figure 4B). During the critical stages of fruit development, including immature green stage (IMG), mature green stage (MG), breaker stage (BR), orange stage (O), red ripe stage (RR) and overripe stage (OR), the expression levels of SlADK4, 7 and 10 were relatively high at BR stage and those of SlADK3 and 6 were relatively high at O stage. It was remarkable that the mRNA level of SlADK9 was significantly up-regulated at RR stage, and interestingly, expression of almost all detected genes was relatively low in OR stage. Due to the quite low expression abundance and amplification efficiency of SlADK1, 2 and 11, it was difficult to get satisfactory qPCR results for analysis of gene expression (Fig. 5C).
Expression characteristics of SlADKs under diverse abiotic stresses
To identify potential functions of SlADKs in response to different abiotic stresses, their transcript profiles were assayed under drought, salt and cold treatments (Fig. 6). Following 3 h of treatment with PEG6000, the expression of most SlADKs was obviously up-regulated except for SlADK1, 3 and 8. Interestingly, expression of most SlADKs decreased rapidly during 9-12 h after treatment, but increased rapidly during 24-48 h. Especially, the transcript levels of SlADK1 and 11 almost linearly increased with time under PEG6000 treatment during 12-72 h. Under salt treatment, expression levels of most SlADKs were obviously down-regulated at the early stage. It should be noted that almost all SlADKs contained two expression peaks at 9 and 48 h; however, the two expression peaks for SlADK7 were at 6 and 24 h. Under cold stress, there was obvious up- and down-regulation in expression levels of SlADK3 during 12-24 h and 24-48 h, respectively. For SlADK7, expression showed no significant differences for all time points before 24 h of treatment, but expression rose rapidly during 24-72 h. Notably, SlADK7 exhibited unique changes under multiple stress treatments, suggesting that it may have a unique role in stress responsiveness. Moreover, the result of gene clustering showed that homologous genes always had similar expression patterns especially under PEG6000 treatment, such as SlADK2 and 3, and SlADK5 and 7 (Fig. 3A and Fig. 6).
Expression profiles of SlADKs in response to diverse hormone treatments
Previous evidence indicated that different hormones play important roles in stress signal transduction and cell responses [37-39]. Here, we investigated the expression profiles of SlADKs in response to Eth, IAA, ABA, SA and MeJA treatments (Fig. 7). With Eth treatment, in general, the expression of most SlADKs showed little difference, but that of SlADK1, 2 and 7 increased gradually to different levels during 0-2 h. With IAA treatment, the expression peaks of SlADK1, 2 and 4 were at 2, 0.5 and 6 h, respectively. Interestingly, SlADK11 showed decreased transcription at the early stage and almost no expression at later time points. At 0.5 h after ABA treatment, expression of SlADK5, 7 and 10 showed no significant differences; however, expression of SlADK3, 4, 6, 8, 9 and 11 decreased, and that of SlADK1 and 2 increased at the first time point. Moreover, most SlADKs did not change significantly after 1-12 h of treatment. SlADK6 showed decreased transcription at the early stage and almost none at following time points. With SA treatment, transcription of most SlADKs was repressed in the first 0.5 h. Expression of most SlADKs showed mild change under SA treatment, except for SlADK2, 6 and 7. Especially, SlADK2 and 7 showed similar expression patterns throughout all time points, with peak expression at 12 h. The plant regulator MeJA mediates diverse developmental processes and defense responses. It rapidly induced up-regulation of SlADK4 and 2 during 1-6 h and 3-12 h time points, respectively. Expression of SlADK6 increase gradually during 1-6 h, with opposite results for expression of SlADK9 during 0-3 h. Similar to IAA treatment, SlADK11 also showed decreased transcription at the early stage and almost no expression for later time points. Hence, transcription of SlADKs was responsive to most of the applied stress treatments. Interestingly, SlADK2 and 4 exhibited significant changes under multiple hormone treatments, suggesting that they may have unique roles in hormone regulation. Notably, the result of gene clustering showed that the homologous genes of SlADK6 and 10 had similar expression patterns with the treatment of Eth and IAA; and SlADK8 and 11 had similar expression patterns with the treatment of Eth and ABA (Fig. 3A and Fig. 7).
SlADKs expression patterns under stress based on RNA-seq data
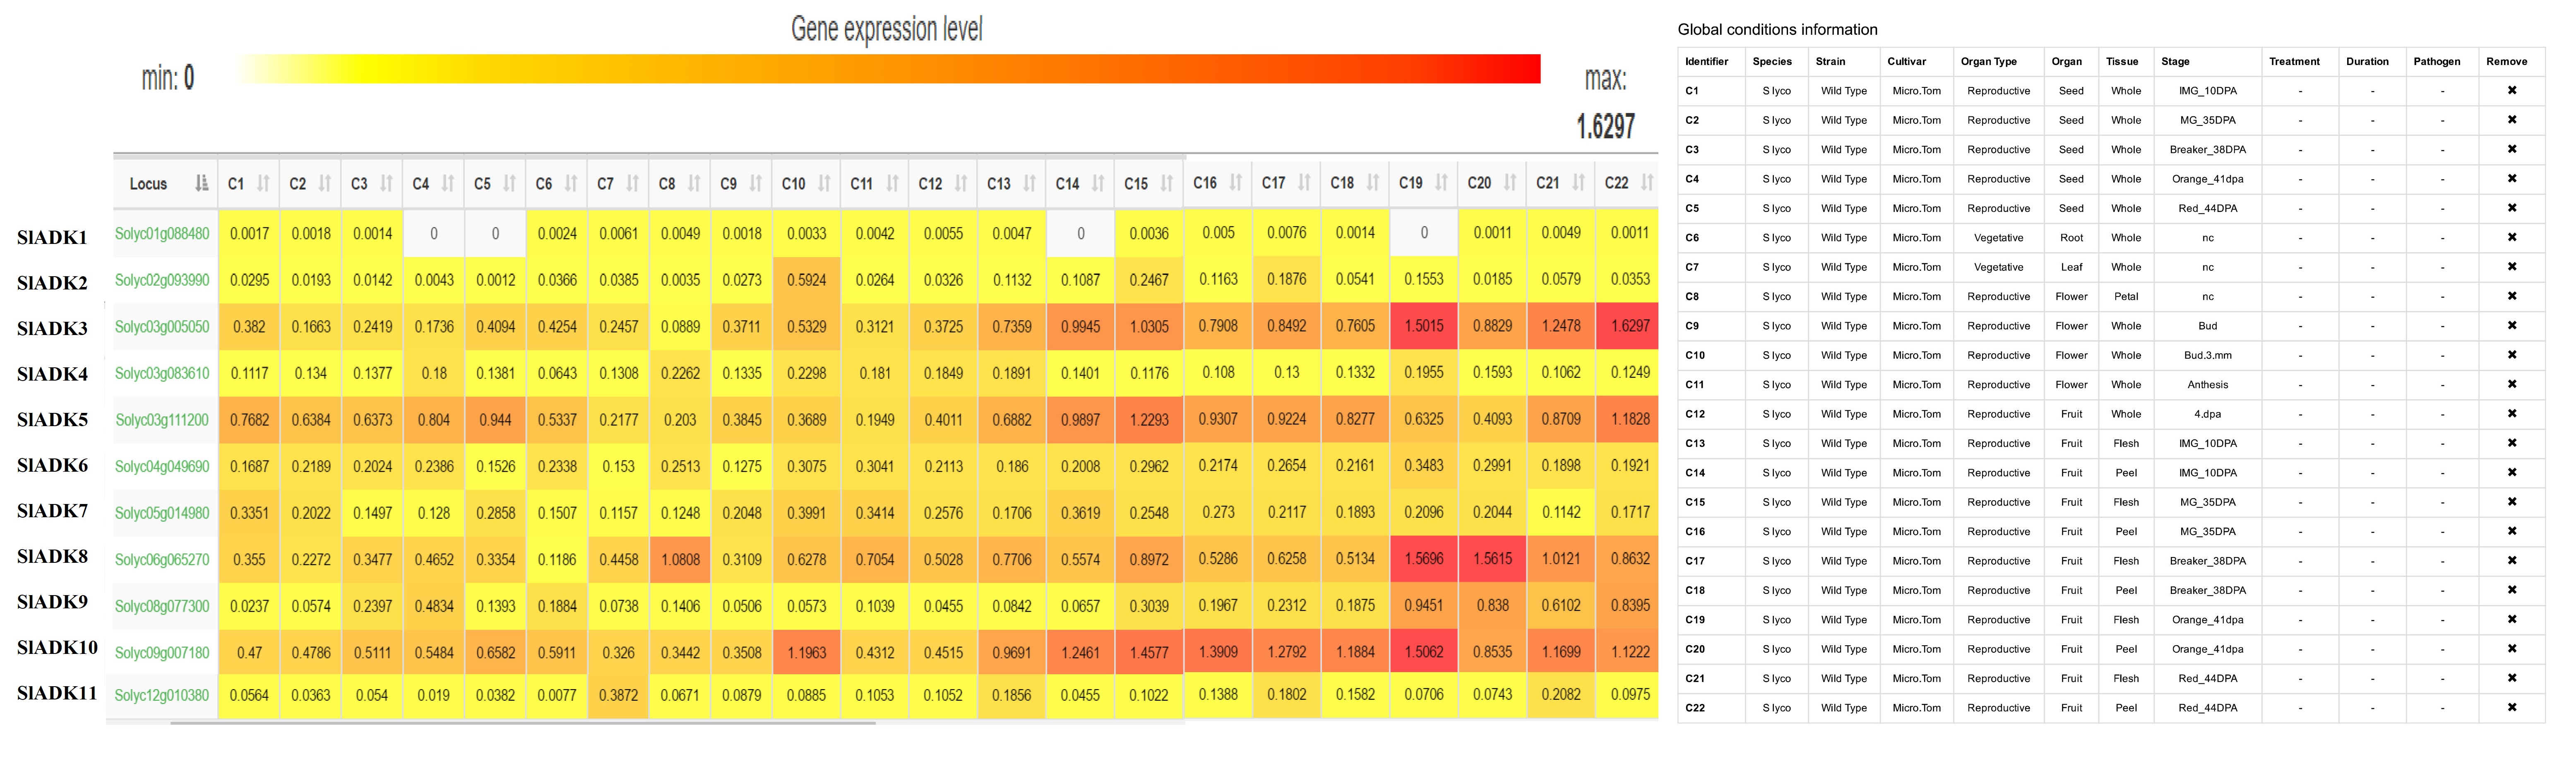
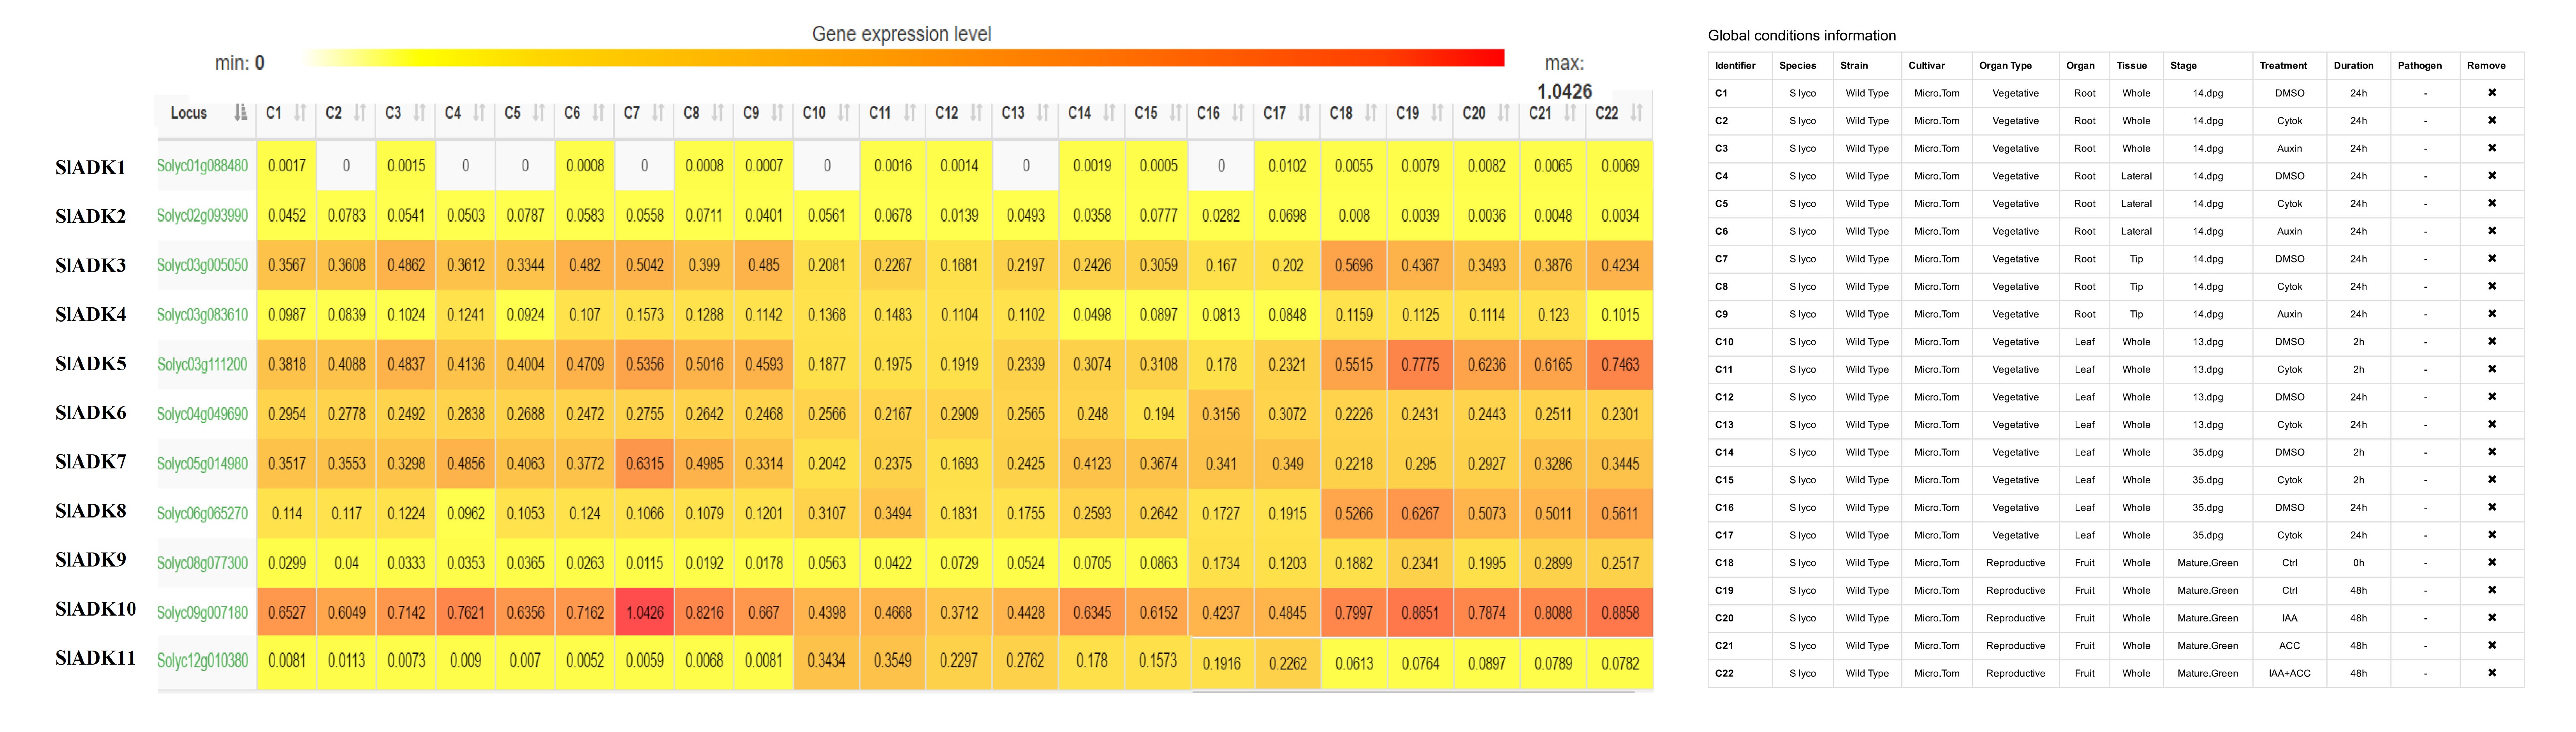
As introduced above, TomExpress provides a unified and standard method to judge tomato gene expression from released RNA-Seq data sets. Here, SlADKs expression patterns under treatment with different plant hormone and multiple hormones were analyzed (Fig. 8 and Fig. S2). In general, the expression of most SlADKs (SlADK3, 5, 6, 7 and 10) were lower in leaves (C10 to C17) than in roots (C1-C2, C4-C5, C7-C8) whether these tissues were treated with cytokinin or not. Also, the expression of SlADK1 was lower in many tissues, and even could not be detected in roots (C2, C4, C5, C7) and leaves (C10, C13, C16) under special stress conditions. With the treatment of auxin in tip of roots, the expression of SlADK7 and 10 were down-regulated significantly. In fruit, several SlADK genes such as SlADK3, 5, 8 and 10 displayed higher expression levels. Compared with treatment of ACC in fruit, multiple hormones treatment of ACC+ IAA could up-regulated the expression of SlADK3 and 5 (Fig. S2). Heatmap can be very convenient to show gene clustering. As shown in Fig. 8, under treatment with different plant hormone and multiple hormones, SlADK3, 4, 5, 7 and 10 showed similar expression patterns in many tissues, so were the group of SlADK2, 6 and 11 and the group of SlADK1, 8 and 9 (Fig. 8).
Co-expression and correlation networks analysis.
Based on expression data of SlADKs under 44 global conditions of different development and stress treatment derived from TomExpress platform, co-expression and correlation networks were analyzed (Table S6 and Fig. 9). The correlation values of co-expressed genes pairs were calculated and the correlation threshold was set as 0.92. Then, the pairs of co-expressed genes of which the correlation coefficient was more than |0.92| were displayed (Table S6). The results showed that SlADK5, 8, 9 and 11 possessed the number of 17, 3, 4 and 6 co-expressed genes, respectively. Among the 17 genes existed correlation with SlADK5, 16 showed positive correlation and 1 showed negative correlation; Among the 3 genes existed correlation with SlADK8, 1 showed positive correlation and 2 showed negative correlation. However, the 6 co-expressed genes of SlADK11 and the 4 co-expressed genes of SlADK9 showed only positive and negative correlation, respectively. Furthermore, these correlation data were visualized as a heatmap after a hierarchical clustering to highlight the positively and negatively correlated groups. The result showed that SlADK8 (Solyc06g065270) and 9 (Solyc08g077300) showed similar co-expression patterns, while SlADK5 (Solyc03g111200) and 11 (Solyc12g010380) showed quite different co-expression patterns (Fig. 9).