3.2. Tumor tissue biomarker assessment
In the previous report(10), we showed that the PD-L1 expression on ICs and TCs before therapy was not correlated with ORR or PFS. The infiltration of CD8+ T cells and PD-1 expression on ICs before therapy also did not correlate with clinical outcomes. Nevertheless, a high percentage of baseline TILs (> 10%) was associated with higher ORR and favorable PFS (P = 0.029 and 0.054, respectively)(10).
In this study, the updated follow-up data were used to explore the correlations between clinical outcomes and immune parameters in tumor including PD-L1 expression on TCs or ICs, stromal TILs and CD8+ T cells, and PD-1 expression on immune cells. A high percentage of baseline TILs (> 10%) was still associated with longer PFS (P = 0.035, Figure S1). No significant correlation between clinical outcomes and baseline PD-L1 expression on ICs/TCs or PD-1 expression on ICs was observed (P > 0.05 for all)(10). Moreover, we explored the associations between clinical outcomes and changes of these immune parameters at eight weeks after treatment. A greater increase (> 15%) of tumor-infiltrating CD8+ T cells at eight weeks after treatment was associated with ORR (Fig. 1, P = 0.040), but not with longer PFS or OS (P = 0.181, and 0.563, respectively). There was no correlation between clinical outcomes and changes of PD-L1 expression on ICs/TCs, TILs or PD-1 expression on ICs at eight weeks after treatment (P > 0.05 for all), indicating the response to this combinational immunotherapy is independent of the expression of PD-L1/PD-1 in tumor.
3.3. Peripheral blood biomarker assessment
We evaluated the association between germline BRCA1/2 status and ORR. Among the 28 evaluable patients, 26 patients have known germline BRCA1/2 status, with two BRCA1 mutations and one BRCA2 mutation. There was no statically significant correlation between germline BRCA1/2 status and ORR (P = 0.449).
Using the ProcartaPlexHuman Cytokine/Chemokine/Growth Factor Panel and the Immuno-Oncology Checkpoint Panel assay, the peripheral blood samples from 25 evaluable patients were measured for the amount of 59 cytokines/chemokines, growth factors, or soluble checkpoint-related proteins. The baseline plasma levels of HGF and IL-8 were significantly lower in responders (partial response, PR) than in non-responders (stable disease, SD or progressive disease, PD) (HGF: 74.37 pg/ml vs. 110.99 pg/ml, P = 0.005; IL-8: 0 vs. 2.15 pg/ml, P = 0.001; Fig. 2a and 2b). Patients with lower baseline HGF or IL-8 showed a significantly longer PFS and OS compared with those with higher baseline HGF or IL-8 (HGF: PPFS<0.0001, POS<0.0001; IL-8: PPFS<0.0001, POS=0.009; Fig. 2c-2f). Moreover, the fold changes of plasma IL-8, NGF-beta, FGF-2, TIM-3 and CD152 at 8 weeks after treatment from baseline were significantly correlated with the response to camrelizumab plus apatinib therapy (P = 0.008, 0.019, 0.005, 0.040, and 0.014, respectively, Fig. 3).
Next, we assessed the correlations between baseline plasma protein levels and incidences of different treatment-related adverse effects (TRAE). Details of TRAE of the enrolled patients were reported previously(10). We divided TRAE into 10 categories, including hematological, neuropsychiatric, skin, gastrointestinal, urinary, cardiovascular, hemorrhagic, respiratory, endocrine, and other adverse effects. We observed that the patients with lower baseline plasma IL-18, or IFN-γ levels were more likely to suffer from gastrointestinal TRAEs (P = 0.007 and 0.031, respectively, Fig. 4a and 4b), whereas patients with higher baseline plasma VEGF-A or MIP-1ß were more likely to have respiratory TRAEs (P = 0.043 and 0.049, respectively, Fig. 4c and 4d). Additionally, patients with higher baseline plasma TIM-3, IL-18, IFN-γ, CD152, or CD28 levels were more likely to suffer from skin side effects (P = 0.025, 0.014, 0.021, 0.030 and 0.043, respectively, Fig. 4e-4i).
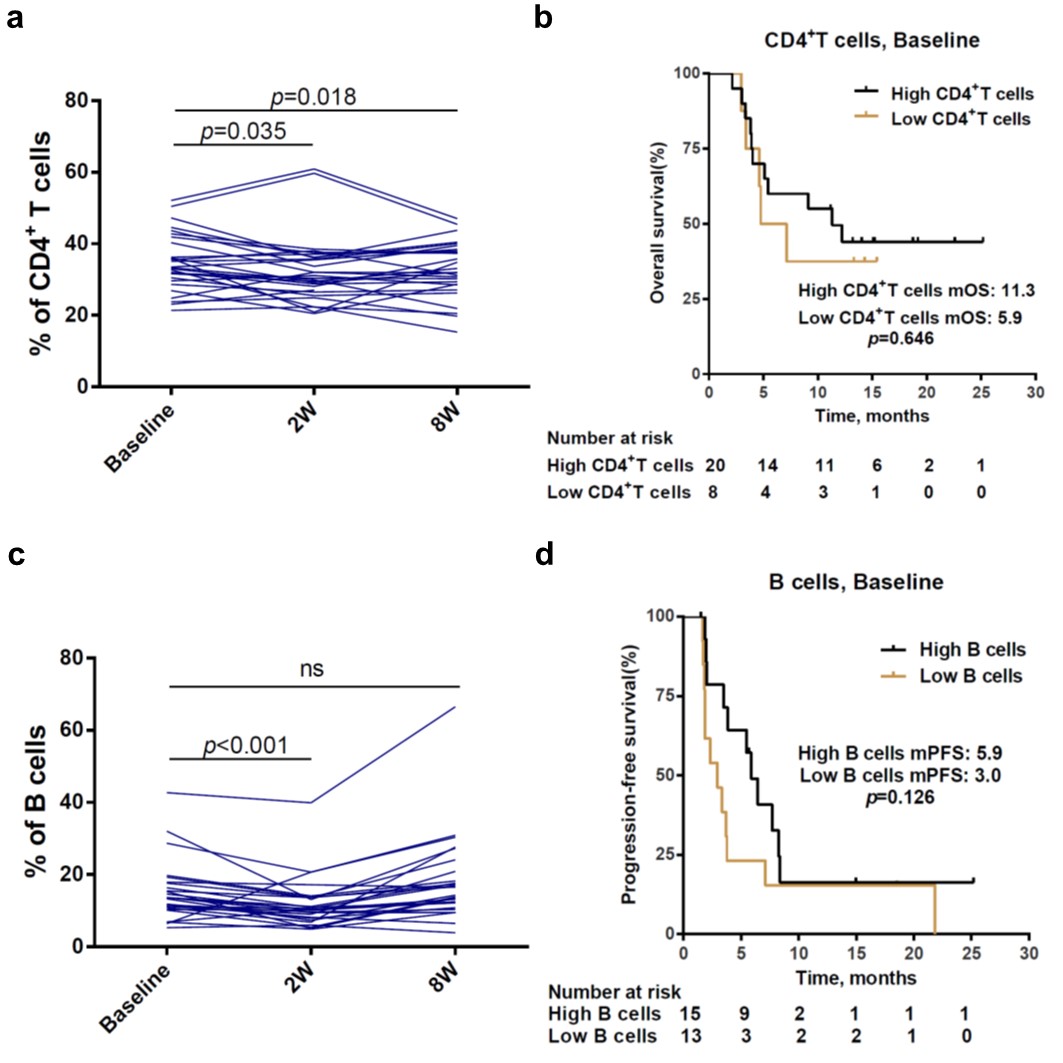
The immune cell subpopulations in peripheral blood were examined at baseline for all 28 evaluable patients, and at both 2 and 8 weeks after treatment for 26 of them. The proportions of CD4+ T cells in blood decreased significantly at 2 and 8 weeks after treatment compared with that at baseline (P = 0.035, 0.018, respectively, Figure S2a). All PR patients displayed a CD4+ T cells percentage > 31% at baseline, while only 46.7% of SD/PD patients displayed a CD4+ T cells percentage > 31% at baseline (P = 0.002, Fig. 5a). Moreover, the patients with higher CD4+ T cells proportions at baseline showed a significantly longer PFS than those with lower proportions of CD4+ T cells (5.9 vs. 2.0 months, P < 0.001, Fig. 5b), although the difference of OS was not statistically significant (11.3 vs. 5.9 months, P = 0.646, Figure S2b). The proportion of B cells in blood significantly decreased at 2 weeks after treatment compared with that at baseline (P < 0.001, Figure S2c). 76.9% of PR patients displayed a B cells percentage > 13% at baseline, while 33.3% of SD/PD patients displayed a B cells percentage > 13% at baseline (P = 0.030, Fig. 5c). Patients with higher baseline B cells proportions showed a statistically longer OS than those with lower baseline proportions of B cells (not reached vs. 4.6 months, P = 0.030, Fig. 5d), although the difference of PFS was not statistically significant (5.9 vs. 3.0 months, P = 0.126, Figure S2d). Together, these results indicate that higher percentage of CD4+ T cells or B cells in blood at baseline could serve as biomarkers to predict the response to combinational immunotherapy and better prognosis.
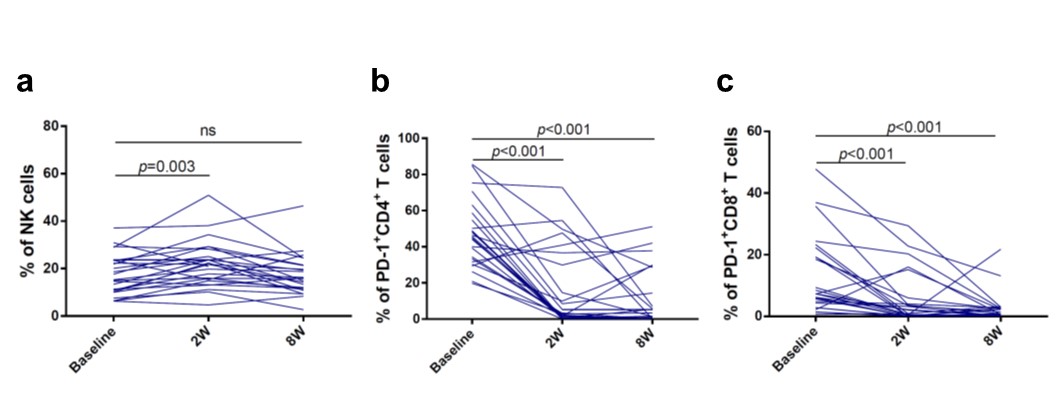
The proportion of NK cells in blood significantly increased at 2 weeks after treatment compared with that at baseline (P = 0.003, Figure S3a). However, there were no significant correlations between the response and the baseline proportions of NK cells, Tregs and CD8+ T cells (P > 0.05 for all).
To explore the impact of PD-1 expression on immune cells, the subpopulations of CD4+PD-1+ T cell, CD8+PD-1+ T cell and PD-1+ B cell was measured in 25 evaluable patients. The proportions of CD4+PD-1+ T cells or CD8+PD-1+ T cells at 2 or 8 weeks after treatment significantly decreased compared with those at baseline (P < 0.001, Figure S3b-3c). Nevertheless, none of the baseline proportions of CD4+PD-1+ T cells, CD8+PD-1+ T cells and PD-1+ B cells was found to be associated with the response to combinational immunotherapy (P > 0.05 for all). Additionally, the response to immunotherapy was not associated with the fold changes of any immune cell subpopulations at 2 or 8 weeks after treatment from baseline (P > 0.05 for all).