Transcriptional Levels of IGF2BPs in Patients with Pancreatic Cancer
Three IGF2BP factors were identified in mammalian cells, and the expression levels of the IGF2BPs in various cancers were compared via the GEPIA database. The IGF2BP1 mRNA expression level was not upregulated in pancreatic cancer, but the IGF2BP2 and IGF2BP3 mRNA expression levels were upregulated in pancreatic cancer to varying degrees (Figure 1).
The GEPIA database was utilized to further analyse whether there was a difference in the expression of IGF2BP factors between pancreatic cancer and normal pancreatic tissues. According to ONCOMINE, the expression of IGF2BP1 in pancreatic cancer tissue was not significantly different from that in normal pancreatic tissue. However, in the pancreatic cancer datasets described by Segara, Pei, and Badea, IGF2BP2 was overexpressed in pancreatic carcinoma tissue compared with normal tissue, with fold changes of 3.446, 2.657, and 2.01, respectively (Table 1) [12-14]. Regarding IGF2BP3, all four pancreatic cancer datasets indicated overexpression in both pancreatic carcinoma and pancreatic ductal adenocarcinoma (Table 1) [12-16].
Expression Levels of IGF2BPs in normal and Pancreatic Cancer tissues
We utilized the TCGA database to compare the expression levels of the IGF2BP family in normal pancreatic and pancreatic cancer tissues. Among the family members, the expression levels of IGF2BP2 and IGF2BP3 were significantly increased in pancreatic cancer tissues (Figure 2A). With the GEPIA (Gene Expression Profiling Interactive Analysis) dataset (http://gepia.cancer-pku.cn/), we compared the mRNA expression levels of the members of the IGF2BP protein family between pancreatic cancer and normal tissues. The results showed that the expression of the IGF2BP1 gene in pancreatic cancer tissue was not different from that in normal pancreatic tissue. However, the expression levels of IGF2BP2 and IGF2BP3 were higher in pancreatic cancer tissue than in normal pancreatic tissue (Figure 2B).
Clinical correlation analysis in Pancreatic Cancer Patients
Furthermore, we performed a prognostic analysis of IGF2BP1, IGF2BP2, and IGF2BP3 in pancreatic cancer with the LinkedOmics and GEPIA datasets. In the LinkedOmics dataset, the high expression of IGF2BP1, IGF2BP2, and IGF2BP3 was significantly associated with the poor overall survival of pancreatic cancer patients (Figure 3A). Interestingly, regarding IGF2BP1 and IGF2BP2, consistent results were obtained from the prognostic analysis of the GEPIA dataset (Figure 3B).
The association between IGF2BP1-3 and each subset based on grade and stage was analysed with R software via the Wilcox test. A P-value<0.05 was considered statistically significant. We found that the expression levels of IGF2BP2 and IGF2BP3 continuously increased in each subgroup of grade except for grade 4 (Figure 4A). Concerning the clinical stage, IGF2BP1-3 gradually increased in each subgroup, but there was no significant difference (Figure 4B).
Univariate and multivariate Cox regression analyses
Cox's proportional hazards model was applied to analyse related factors that may affect the overall survival of pancreatic cancer patients, in which IGF2BP2 and IGF2BP3 were identified as independent prognostic factors (Figure 5A, B). In both univariate and multivariate analyses, low expression of IGF2BP2 and 3 suggested improved OS. In the multivariate analysis, the HR of IGF2BP2 was 1.415, with a 95% CI of 1.133–1.768, and the HR of IGF2BP3 was 1.052, with a 95% CI of 1.017–1.019. Furthermore, based on the results of the multivariate Cox regression analysis, we established a nomogram model that may predict patient survival (Figure 5C).
Gene mutation information
cBioPortal was utilized to calculate the gene mutation rate in pancreatic cancer samples from the TCGA database. In general, missense mutations were the most frequent mutation type in pancreatic cancer. Collectively, SNP and C>T were confirmed to be the most fundamental variant type and SNV class, respectively. The median variation in each sample was approximately 26. Finally, we determined the top 10 mutated genes in pancreatic cancer as follows: TP53, KRAS, TTN, MUC16, SMAD4, CDKN2A, RYR1, RNF43, PCDH15 and ARID1A (Figure 6A). Then, by performing a comparison with the top 10 mutation types, we determined the most frequent mutation types of IGF2BP1-3, which were missense mutations and silent mutations (Figure 6B).
Gene set enrichment analysis of IGF2BP2-3
To fully understand the biological attributes of IGF2BP2 and IGF2BP3, we conducted gene set enrichment analysis. Based on the results of the GSEA, the top three upregulated enriched pathways associated with IGF2BP2 were as follows: adherens junction, pentose phosphate pathway and pentose and glucuronate interconversions. The principal downregulated biological pathways enriched in IGF2BP2 were as follows: primary bile acid biosynthesis, neuroactive ligand receptor interaction and glycosphingolipid biosynthesis ganglio series (Figure 7A). The top three upregulated pathways associated with IGF2BP3 were as follows: pathogenic Escherichia coli infection, thyroid cancer and adherens junction. The principal downregulated biological pathways enriched in IGF2BP3 were as follows: glycine serine and threonine metabolism and neuroactive ligand receptor interaction (Figure 7B).
Gene functional enrichment analysis
To fully understand the biological attributes of IGF2BP2 and IGF2BP3, we performed Kyoto Encyclopedia of Genes and Genomes (KEGG) and Gene Ontology (GO) analyses. We determined the biologically enriched genes, based on the results of DAVID, that are positively related to the expression levels of IGF2BP2 and IGF2BP3. In the GO analysis, the three biological processes in which genes positively related to IGF2BP2 expression are involved were as follows: regulation of cytoskeleton organization, neutrophil activation and neutrophil degranulation. The three cell components involved in these co-expressed genes were as follows: adherens junction, cell-substrate junction and focal adhesion. In addition, the three main molecular functions of these co-expressed genes were as follows: cell adhesion molecule binding, cadherin binding and actin binding (Figure 8A). In the pathway analysis of genes that were positively related to IGF2BP2 expression, the top three enriched terms were as follows: salmonella infection, shigellosis and pathogenic Escherichia coli infection (Figure 8A). In the GO analysis, the three biological processes in which genes positively related to IGF2BP3 expression are involved were as follows: viral life cycle, regulation of chromosome organization and regulation of mRNA metabolic process. The three cell components involved in these co-expressed genes were as follows: adherens junction, cell-substrate junction and focal adhesion. In addition, the three main molecular functions of these co-expressed genes were as follows: cell adhesion molecule binding, cadherin binding and transcription coregulator activity (Figure 8B). In the KEGG pathway analysis of genes that were positively related to IGF2BP2 expression, the top three enriched terms were as follows: human papillomavirus infection, endocytosis and salmonella infection (Figure 8B). Finally, the GO and KEGG analyses of biologically enriched genes that were positively correlated with IGF2BP2 and IGF2BP3 expression revealed the top 10 relevant biological processes, including cell junction organization, salmonella infection, mitotic nuclear division, and cell cycle (Supplement Figure 1).
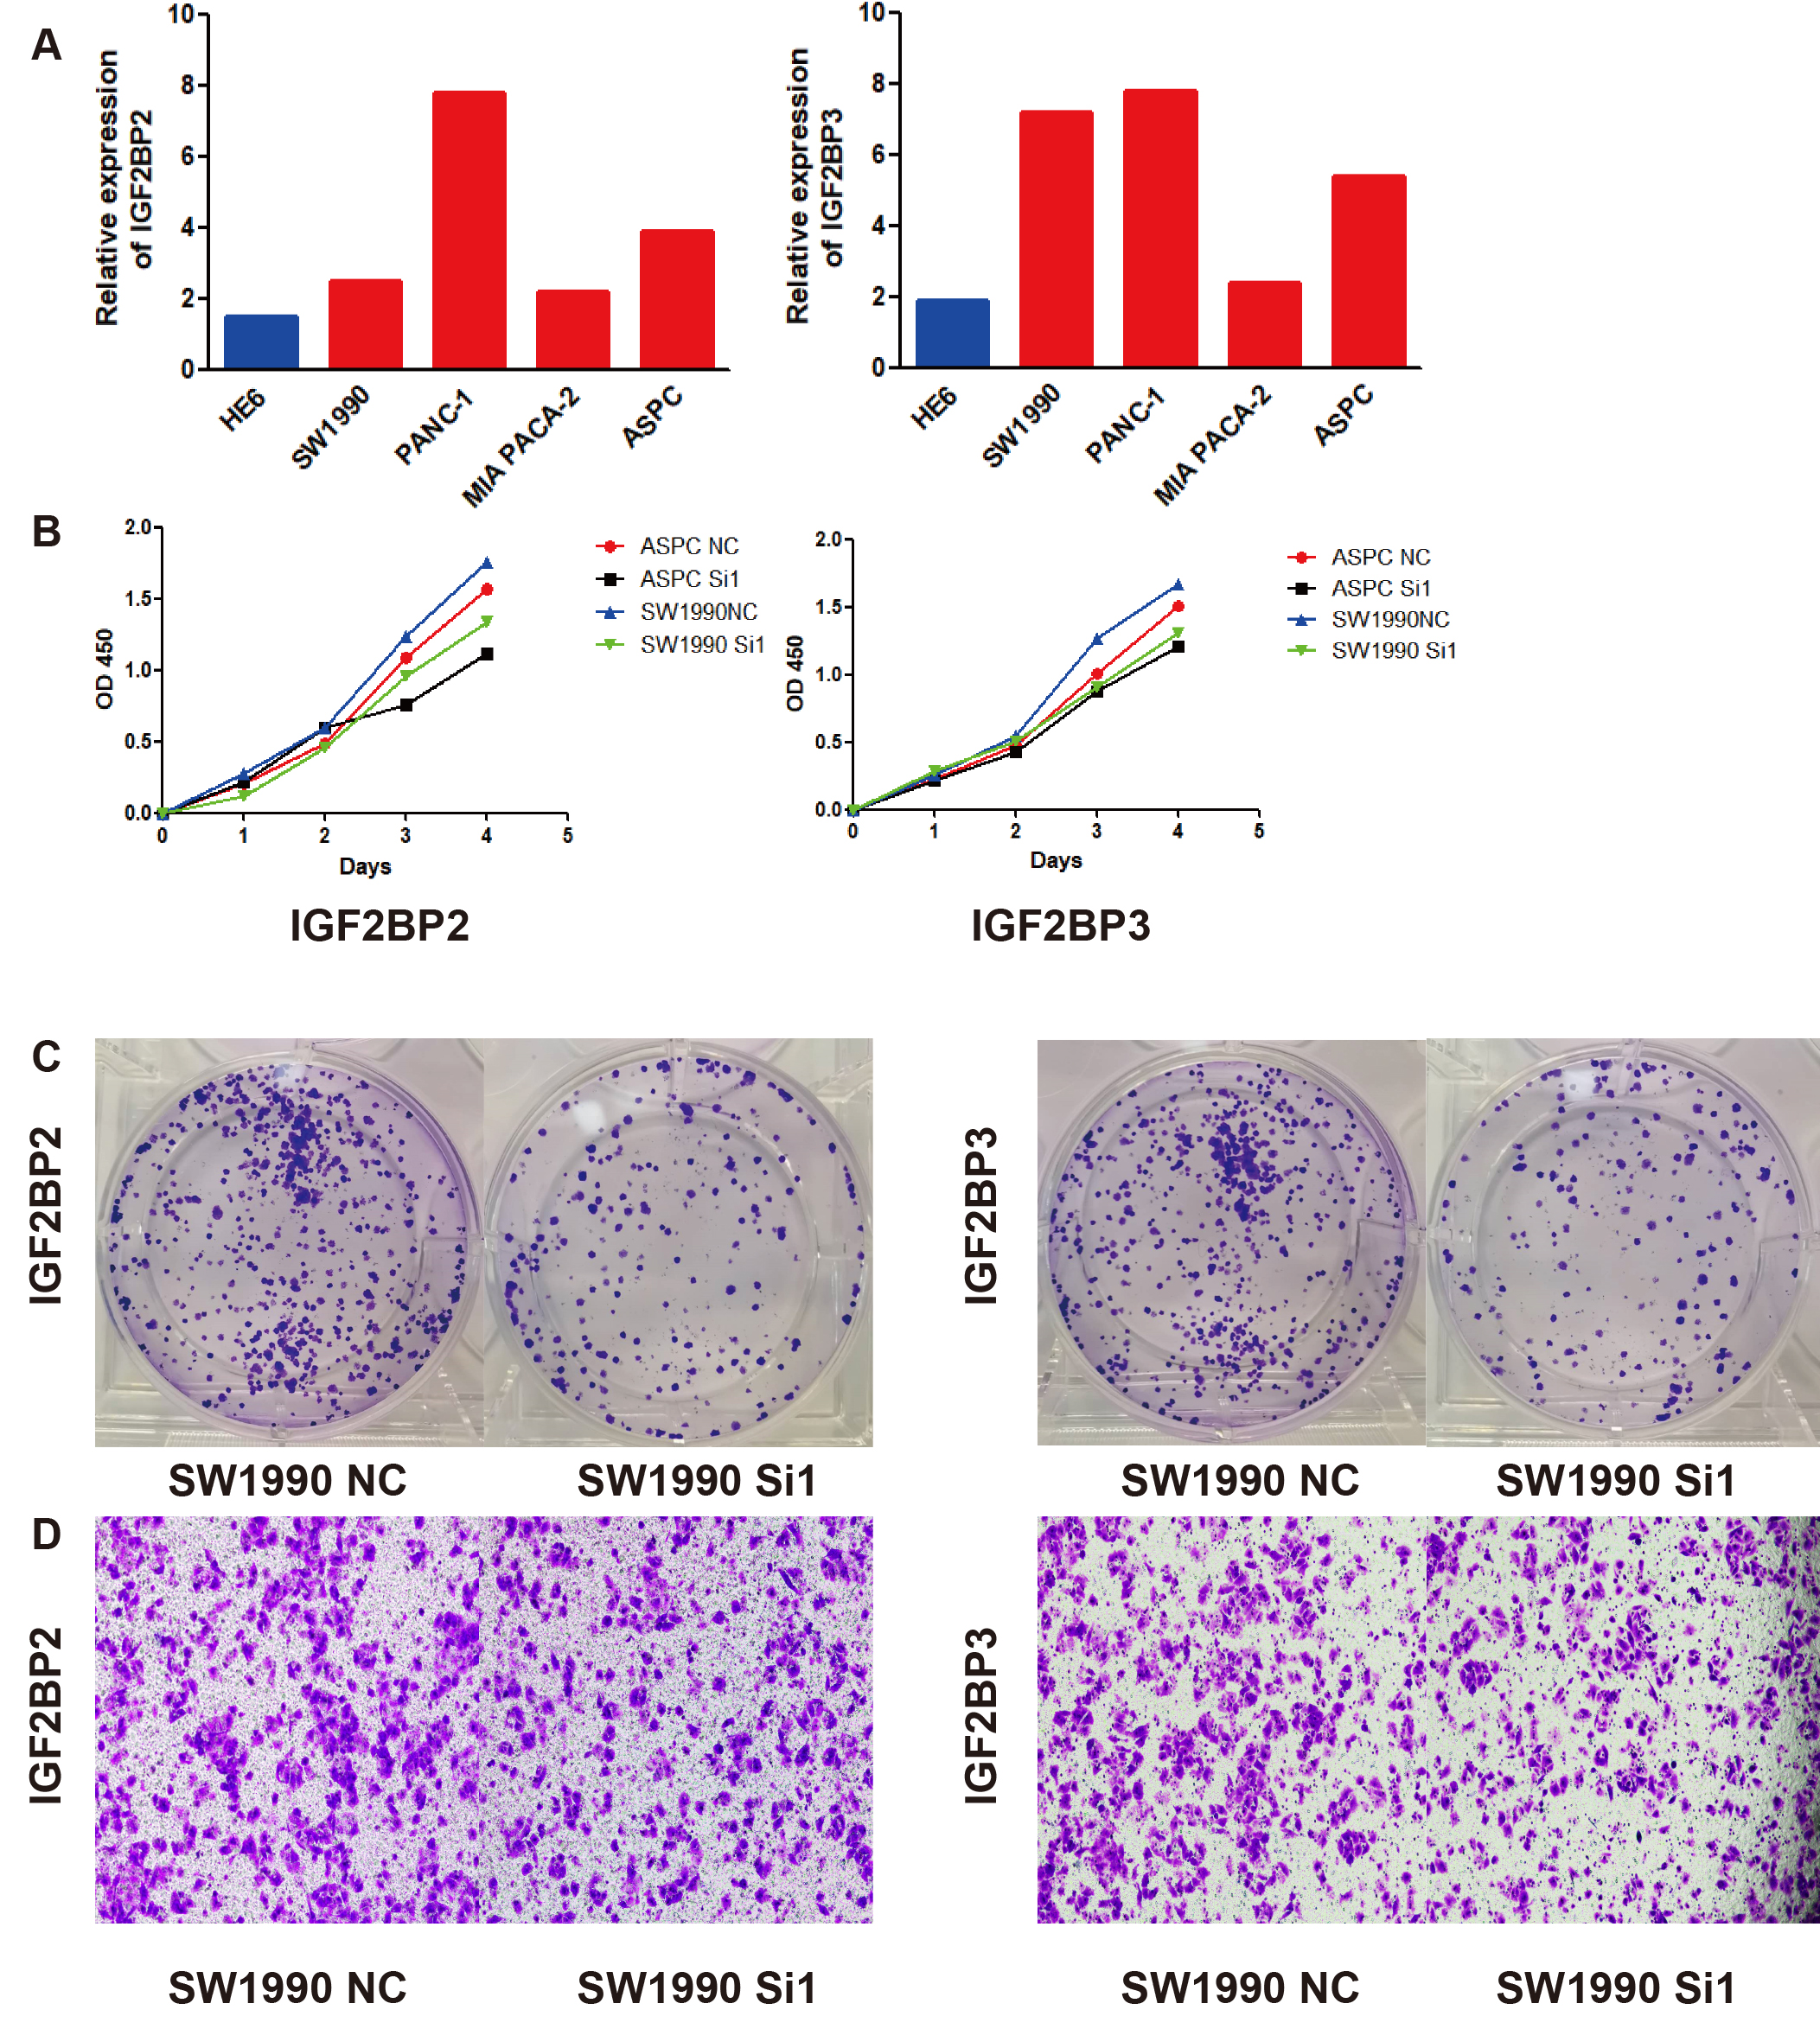
IGF2BP2 and IGF2BP3 expression and function in cell lines
To further explore IGF2BP2 and IGF2BP3 expression in cell clines, qPCR was performed. As expected, IGF2BP2 and IGF2BP3 proteins were significantly increased in pancreatic cancer cells compared with HPDE6-C7 cells, while the expression of IGF2BP2 and IGF2BP3 in pancreatic cancer cells was further increased (Figure 9A, B). As predicted in the GSEA above, we inferred that IGF2BP2 and IGF2BP3 promote the proliferation or metastasis of pancreatic cancer cells to accelerate progression. The growth rates of pancreatic cancer cell lines transfected with IGF2BP2 siRNA and IGF2BP3 siRNA were significantly slower than that of cell lines transfected with the NC siRNA(Figure 9C, D, E). In the cell invasion analysis, the knockdown of IGF2BP2 and IGF2BP3 significantly decreased the invasion rate of SW1990 cells (Figure 9F).