3.1 Effect of I/S and pH on the VFA production from artisanal FW
3.1.1 VFA production and VFA profile
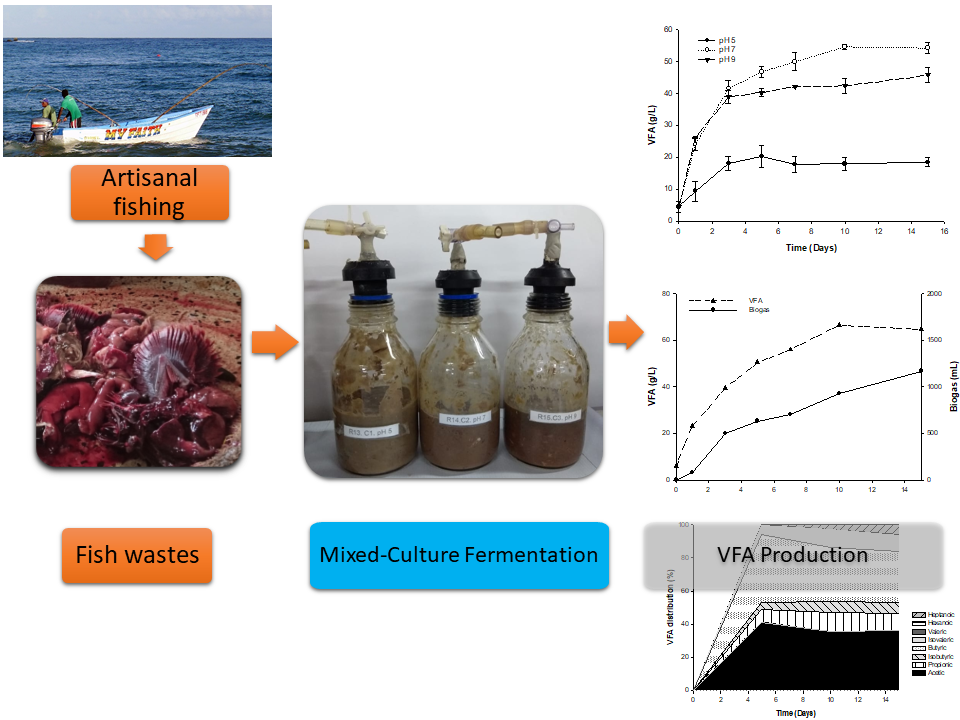
Figure 1 describes the VFA production from artisanal FW obtained at the different I/S and pH combinations (Table 2). The VFA production kinetic was similar for the different I/S ratios, in all cases, the highest production was achieved by the treatment with pH 7 followed by the treatment with pH 9 and pH 5. The treatments with an I/S ratio of 0.05 obtained the highest VFA concentrations at pH 7 (T8: 54.5 g/L), 9 (T12: 45.6 g/L) and 5 (T4: 20.1 g/L) (Figure 1d). Additionally, it was observed that the production of VFA increased as the I/S ratio decreased (0.2 to 0), the VFA concentration reached its maximum in treatments with an I/S ratio of 0.05 (Figure 1d). However, the treatments without additional inoculation (I/S=0) obtained a significant VFA production (T13: 21.15 g/L, T14: 52.55 g/L and T15: 52.02 g/L) as much as the I/S ratio of 0.05 (Figure 1e). Treatments with higher I/S ratios obtained similar VFA concentrations at the same pH (Figures 1a, 1b, 1c). The statistical analysis of the VFA production utilising the area under the curve (AUC) (Annex 1-Supplementary material) revealed a similar description as depicted in Figure 1. The two-way ANOVA demonstrated that existed significant differences between the treatments (p value <0.0001, α=0.05). In this case, pH and I/S ratio, the main effects, were significant to the model (pH p value <0.0001 and I/S ratio p value <0.04, α=0.05), however, the interaction between pH and I/S ratio was not significant (p value <0.9737, α=0.05). These results agreed with the data presented in Figure 1, where the figures had a similar profile for the three pH even though they have different values. As the interaction term in ANOVA’s model was not significant, the main effects can be described and optimised individually. The Duncan’s multiple range test was used to evaluate the differences in the pH and I/S ratio for the AUC of the VFA production (AUC-VFA). Figure 1f describes the Duncan groupings for means of pH and I/S ratio for the AUC-VFA variable. The Duncan’s test evidenced significant differences among the three pH and indicated that pH 7 produced the best VFA production from artisanal FW, pH 7 was followed by pH 9 and 5. The I/S ratio’s Duncan’s test indicated that even though the I/S ratio of 0.05 and 0 produced the highest VFA production, these I/S ratios were statistically similar to 0.1 and 0.15; whereas, the 0.2 I/S ratio produced the lowest VFA production, but it was also similar to 0.1 and 0.15 I/S ratios. The statistical analysis indicated that pH 7 and I/S ratio between 0 and 0.1 produce the highest amounts of VFA from FW. So, given that with I/S ratio of 0.05 and pH 7 it was possible to achieve the highest VFA concentration, these conditions were selected as optimal to produce VFA.
As the highest differences in VFA concentration were associated with the different pH tested, Figure 2 describes the VFA profile for the treatments with an I/S ratio of 0.05 and the three different pH. At pH 5, the average production of the principal VFA species were acetic (58 %), butyric (18 %), propionic (9%), iso-valeric (6%), hexanoic (5%) and iso-butyric (4 %) acids. However, these percentages changed throughout the process. The most significant changes included the 10 % reduction in the acetic acid concentration between the initial days and day 15 (Figure 2a), and the 2-fold increment in the concentrations of hexanoic and isovaleric acids during the same period. At pH 9, the principal VFA species were similar to pH 5, however, their percentages were different as acetic (47 %), butyric (30 %), iso-valeric (9%), propionic (5%), iso-butyric (4 %) and hexanoic (3%) acids, in this pH was the only to have significant amounts of heptanoic acid in its profile (2%). At this pH, the acetic acid concentration incremented 10% between the initial and the final day of the process, whereas, the butyric acid concentration decreased 5% during the same time (Figure 2b). In contrast to pH 5 and 9, pH 7 evidenced the most different profile as acetic and butyric acid had the highest concentration, both with 37%, followed by propionic (10%), iso-valeric (8%), and iso-butyric (4 %). In this case, between the initial and last days of fermentation, acetic and butyric acid exhibited a concentration reduction of 7 and 6%, respectively; while, propionic and iso-valeric acids concentrations incremented 5 % (Figure 2c). Acetic acid was the dominant product of the fermentation at pH 5 and 9, while, acetic and butyric acids were the dominant product at pH 7. However, the butyric concentrations at pH 9 was almost the double than pH 5, indicating the effect of the pH in the production of butyric acid. In all cases, valeric acid was not found and higher chain VFA (hexanoic and heptanoic) were found at alkaline or acid concentrations.
3.1.2 TAN production
Figure 3 depicts the Total Ammonia Nitrogen (TAN) production from FW for the different I/S and pH treatments (Table 2). In all cases, the TAN had a high production peak around day 3, which was the highest TAN concentration in the process. After that day, TAN production decreased until day 5 and it was approximately constant from that day until the end of the process. Treatments at pH 7 exhibited the highest TAN concentrations, followed by pH 9 and pH 5. The highest TAN concentrations were observed at pH 7 with I/S ratios of 0.15 and 0.1, with values of 27.89 g/L and 28.13 g/L, respectively (Figure 3b, 3c), whereas, the lowest was reported in the treatment with pH 5 and 0.15 I/S ratio. Treatment at pH 9 and any I/S ratio reached the second largest TAN concentrations. The I/S ratio of 0.15 achieved the highest concentration of the treatments at pH 7; whereas, the I/S ratio of 0.2 had the highest concentrations for treatments with pH 9 (Figure 3a) and the I/S ratio of 0.05 achieved the highest TAN concentrations for pH 5 (Figure 3d). The treatments that achieved the highest VFA production, those with pH 7 and I/S ratio of 0 and 0.05, (Figure 3d, 3e) had a lower TAN concentration (22.58 g/L and 19.86 g/L, respectively) than the treatments with pH 7 and an I/S ratio of 0.2, 0.15 and 0.1 (24.93 g/L, 27.89 and 28.23 g/L, respectively) (Figure 3a, 3b, 3c). Similar to VFA production, pH 5 exhibited the lowest TAN concentration and pH 7 the highest TAN concentration. TAN statistical analysis (Annex 1-Supplementary material) also utilised AUC to have a more complete view of the TAN production process Figure 3. The two-way ANOVA demonstrated that existed significant differences between the treatments (p value <0.0001, α=0.05). In this case, only the pH was significant to the model (pH p value <0.0001) while I/S ratio (p value <0.4427, α=0.05) and the interaction between pH and I/S ratio (p value <0.99952, α=0.05) were not significant. Although, the TAN figures described high peaks at different I/S ratio, the lack of significance in this variable revealed the importance of using a variable that unite all the points instead of individual maximums. As I/S ratio and the interaction were not significant, pH was the only main effect that can be utilised for optimisation. The Duncan’s multiple range test was used to evaluate the differences in the pH for the AUC of the TAN production (AUC-TAN). Figure 3F describes the Duncan groupings for means of pH for the AUC-VFA variable. The Duncan’s multiple range test revealed that pH 7 and pH 9 had statistically similar effects in TAN production, whereas, pH 5 had less effect for TAN production. The statistical analysis indicated that pH 7 and pH 9 produced the highest positive effect and that the I/S ratio was not relevant for TAN production. As pH 7 and I/S ratio of 0.05 belonged to the optimal conditions for both VFA and TAN production, these conditions were selected as optimal to produce VFA and TAN.
3.1.3 Biogas
Biogas production under the evaluated conditions is described in Figure 4. Different from the previous variables, biogas evidenced a higher production under acidic pH conditions. In fact, pH 5 treatments obtained the maximum biogas production for all I/S ratios evaluated. The Biogas production differences between pH 5 and the other pHs were very significant, specially at high I/S ratios (0.2, 0.15 and 0.1) (Figure 4a, 4b, 4c), as the pH 5 treatments produced 5-times more biogas than the other pHs. Treatments at pH 7 and pH 9 produced similar results at all I/S ratios (Figures 4d, 4e) indicating the strong effect the pH has over the biogas production. The treatments with high production of biogas exhibited a second production phase after a stationary phase, this can be associated with the consumption of VFA or the transformation of molecules that require more energy consumption. Biogas production was limited at both neutral and alkaline pHs and with low I/S ratios (0 and 0.05). Biogas production behaved similar to VFA and TAN production in the importance of pH over I/S ratio; however, they were opposite in how the pH conditions affect these variables because biogas production was low at neutral and alkaline pH while VFA and TAN production thrived under those conditions. The AUC from the biogas plots (Figure 4) was used as variable for the statistical analysis (Annex 1-Supplementary material). The two-way ANOVA demonstrated that existed significant differences between the treatments (p value <0.0229, α=0.05). Similar to TAN, only the pH was significant to the model (pH p value <0.0028) while I/S ratio (p value <0.2078, α=0.05) and the interaction between pH and I/S ratio (p value <0.4071, α=0.05) were not significant. The statistical result confirmed the strong effect the pH had on biogas production as showed in Figure 4. As I/S ratio and the interaction between pH and I/S ratio were not significant, pH was the main effect employed for optimisation. The Duncan’s multiple range test determined the differences produced by the pH on the AUC of the Biogas figures (AUC-TAN). The Duncan’s multiple range test (Figure 4f) revealed pH 5 as the best treatment for Biogas production and significant different compared to pH 7 and pH 9, which were statistically similar. In this case, the optimal conditions include pH 5 and I/S ratios between (0.1 and 0.2). As the most important factor in this work was VFA production, the optimal conditions for biogas production are not compatible for VFA production as they contradict the VFA conditions.
3.1.4 sCOD, COD reduction % and acidogenesis
The soluble chemical oxygen demand (sCOD) for the experiments evaluating the production of VFA from FW is depicted in Figure 5. Between day 0 and 15, the sCOD increased in most of the treatments, except the treatments with an I/S ratio of 0, in this case, the sCOD concentration at the end of the process was lower than at the beginning. At pH 7 and I/S ratios between 0.05 and 0.2, the sCOD exhibited an increment during the initial days followed by a stationary state. At pH 9 and I/S ratios between 0.05 and 0.2, the sCOD evidenced slightly increments instead of a stationary phase and finally, pH 5 had a considerable reduction in sCOD after the initial days. In this variable was possible to observe that both VFA and I/S ratio had influence in the sCOD concentration. The statistical analysis of the AUC for sCOD (Annex 1-Supplementary material) corroborated the effect of pH and I/S ratio on sCOD concentration Figure 5. The two-way ANOVA demonstrated that existed significant differences between the treatments (p value <0.0546, α=0.1). In this variable, pH and I/S ratio were significant to the model (pH p value <0.0039 and I/S ratio p value <0.096, α=0.1), while, the interaction between pH and I/S ratio was not significant (p value <0.6187, α=0.1). As both main effects were significant, their best conditions can be selected using the Duncan’s test. Figure 5F describes the Duncan groupings for means of pH and I/S ratio. For the pH, the Duncan’s test described pH 7 and 9 as the best conditions for sCOD as they had the highest values and were statistically similar. As expected, pH 5 was different than the other pHs and with lower values. On the other hand, the Duncan’s test showed the I/S ratios of 0.05, 0.1 and 0 as the better conditions for sCOD as they had the highest values and were not statistically different, whereas, 0.1, 0, 0.15 and 0.2 were not significantly different as the less effective conditions for sCOD. The statistical analysis indicated pH 9 and 7 and I/S ratio of 0.05, 0.1 and 0 as the better conditions for sCOD. Therefore, the conditions selected for VFA and TAN, pH 7 and I/S ratio of 0.05, can be also selected as the best conditions for sCOD.
The efficiency of hydrolysis in the VFA production can be expressed as the conversion of the solid organic matter initially fed into soluble compounds, measured as sCOD/initial COD ratio (Annex 2, supplementary material). While the degree of acidogenesis was measured in terms of VFA (converted to COD equivalent)/sCOD ratio, which represent the amount of solubilised organic matter converted effectively into VFA (Cadavid-Rodríguez and Horan 2014; Wang et al. 2018). In this experiment, the hydrolysis occurred rapidly and within the first 3 days around 50% of the total COD was in soluble form, for all the pH conditions analysed. The hydrolysis yields increased above 60% for day 10, confirming that FW was an easily hydrolysable substrate. Regarding acidogenesis (Annex 2, supplementary material), the lowest acidification level was exhibited by the treatment with pH 5, at this pH, VFA/sCOD ratio reached 16% after starting at 5%. This low percentage restate that VFA production from FW was inhibited at low pH. Even though, the acidification level was relatively high in this study, our maximum VFA/sCOD ratio (45%) was lower compared with the one reported by Bermúdez-Penabad et al., (2017), whose higher ratio was 81% at pH 8.
3.2 Uncontrolled pH on VFA production
Although, pH 7 and I/S ratio of 0.05 were selected as the better conditions for VFA production, uncontrolled pH conditions were not evaluated in the first set of experiments, and different authors have cited the buffer potential of high protein wastes and how they can increase VFA production. Therefore, the importance of pH control for VFA production was tested in this experiment and all the different parameters evaluated in VFA production from FW without pH control are described in Figure 6. VFA production increased constantly from day 0 to 10 (Figure 6a), from there, the VFA concentration reached a stationary phase. The highest VFA concentration was recorded during the 10th day (70 g VFA/L) and it corresponded to a 29% increment between the uncontrolled pH treatment and the selected treatment (55 g VFA/L, pH 7 and I/S ratio of 0.05). Similar to the pH-controlled treatments, the VFA profile (Figure 6c) included acetic (38%), butyric (35%), propionic (10%), iso-valeric (9%), iso-butyric (6%) and heptanoic (3) acids. Between the initial days and the end of the process, the VFA profile evidenced a 10% and 5% reduction in the butyric acid and acetic acid concentration, respectively; whereas, an increase of 2 and 6-times was observed in iso-valeric and heptanoic acids, respectively. Biogas production was also enhanced by the lack of pH control (Figure 6a). In fact, biogas was produced during the whole process in volumes higher than the ones reported in the previous experimental phase. Biogas highest production increment was obtained during the first three days; however, biogas production did not evidence a stationary phase or a decrease in their production. During the whole experiment, the pH ranged between 6.57 and 7.67 (Figure 6b); even though, VFA concentration was almost 10% w/v, this neutral pH indicated the high buffer capacity of FW and the ammonia released by the amino acid’s hydrolysis. TAN concentration (Figure 6d) increased rapidly during the initial 5 days of the process; this increment was associated with protein and amino acid hydrolysis and was the principal reason why the pH did not significant variate during the fermentation process. TAN production combined with the pH allowed the significant increment in VFA production because the ionic form of the acids did not inhibit the microorganisms. The grade of acidification started in 5% and rose to 58% by day 10, which was a significant change compared with the treatments with controlled pH. The fast increment in sCOD (Figure 6b) observed in the initial days accorded with the results and curves describing the other variables. The high VFA production without controlling pH simplifies the operation and reduces the costs associated with the use of external buffers. Therefore, it can be recommended no controlled pH to produce VFA from Artisanal FW.