Manhiça cohort study
In 2012, HIV prevalence and incidence in Manhiça district were estimated to be 40% and 3.6 infections/100 person-years, respectively.20,21 The Manhiça cohort study enrolled 1,122 participants with a new HIV-positive diagnosis (May 2014–June 2015), following routine VCT and outpatient PICT at the Manhiça District Hospital and door-to-door HBT by trained healthcare workers (Appendix 1). VCT and PICT resulted in significantly higher proportions of PLHIV linked to care, defined as enrollment in care at the reference district hospital and with a CD4 count registered within the first 3 months after HIV diagnosis, than HBT. Nonetheless, HBT reached a distinct population living in extreme poverty who were in greatest need for facilitated linkage interventions. Details of the study methods and procedures have been described elsewhere.11
Cost estimate methods
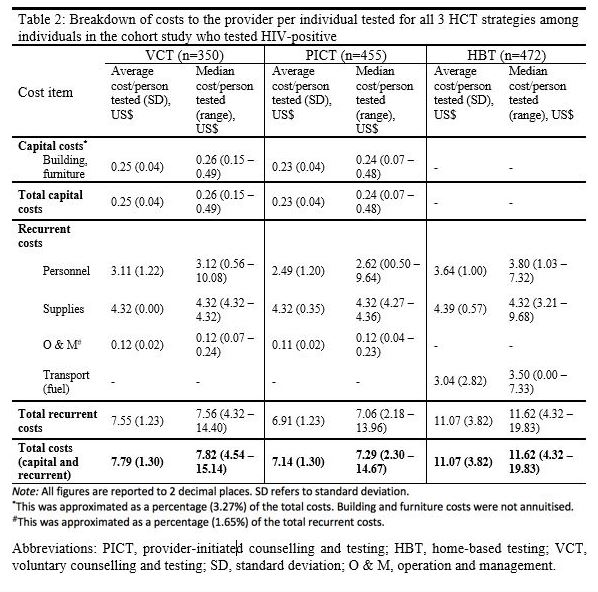
We employed a micro-costing (bottom-up) approach22 to estimate the financial and economic costs of HCT provision incurred in the cohort study from the provider’s perspective. As VCT and PICT were routinely offered to the public at the time of the study, estimated costs were referenced from routine health system costs. HBT-associated costs were assessed separately as HBT was not a routine testing strategy. Nevertheless, we examined only recurrent costs and not start-up costs for HBT as there was already an existing structure for carrying out door-to-door interventions e.g. community vaccination.
To determine financial costs, we processed data on capital (e.g., buildings, equipment, and vehicles) and recurrent (personnel, supplies, test-kits, and transport) costs collected May 2014–June 2015. We utilized time and motion data to determine the financial costs of personnel and transport. Time data tracked the time taken by counsellors to travel to and between participants’ houses during HBT and to conduct each counselling session either at the District Hospital or at each participant’s house. On the other hand, motion data included travelling speeds to determine fuel costs. We did not include training costs because HCT in the cohort study was provided by healthcare workers who were not specially trained.
The cost per VCT attendance from the patient’s perspective was determined by a similar micro-costing approach using self-reported explicit costs and implicit costs. We assumed patients would not incur any additional costs for HBT and PICT.
Data sources
A questionnaire was used to elicit demographic information (Appendix 2). From the patient’s perspective, data were collected from patients accessing VCT by using a specific questionnaire (Appendix 3). From the provider perspective, data were collected from VCT, HBT, and PICT using a separate questionnaire (Appendix 4). Some of the provider resources used (e.g. time to perform the test) were collected for all patients receiving the test (as their HIV status was not known a priory), but only HIV-positive patients were retained for ethical reasons. Where information on costs was not available through questionnaires (e.g. building, furniture, and operation and maintenance costs), we approximated them as a percentage of total recurrent costs based on results from a study by Mwenge et al.23 in Malawi and Zimbabwe, which share similar sociodemographic and economic profiles as Mozambique.24,25
Data analysis
For cost estimate analysis, we included data on all individuals who tested HIV positive (n=1277), including non-enrolled individuals (n=155) who had received a HIV-positive test result previously in a concomitant study. These 155 patients were tested using the same procedure as with the other participants in the main cohort study and were included in our sample size. Of the 1277 patients, 350 were enrolled from VCT and were included in cost estimates from the patients’ perspective. Time data for the following variables were highly negatively skewed due to measurement errors during data collection: travelling to individual houses, performing the test, waiting for test results, and explaining the results. We deemed the 85th percentile to be an appropriate upper limit to capture a reasonable proportion of these data without including outlying values, replacing observations above this percentile with the value at the 85th percentile. All data analyses were conducted using Microsoft Excel 2016 (V.16.14.1) and Stata (V.13.1: Stata Corporation).
We performed descriptive statistical analysis to compute mean (with standard deviation) and median (with maximum and minimum ranges) costs per person tested positive from both the patient’s and provider’s perspective. All costs were expressed in 2015 US$ at an exchange rate of 33.00 Mozambique New Metical (MT) per US$.26
Determination of cost per individual tested
The cost of testing each individual was determined by summing costs of each individual resource, obtained by multiplying the quantities of each resource expended with their approximated unit costs (Appendix 5).
Indirect costs to patients were calculated by valuing their time spent travelling to and waiting at the VCT facility, using the average monthly minimum wage in Mozambique.27 Capital costs were factored as a proportion of total costs. Fuel costs were calculated using motion data assuming an average travelling speed of 50 km/hour and an average fuel consumption of 0.143 L/km, based on 2013 estimates from the Global Fuel Economy Initiative.28
Determination of HCT costs and cost-effectiveness
A decision tree model (Appendix 6) was designed for the CEA to determine cost-effectiveness ratios (CERs) and incremental cost-effectiveness ratios (ICERs). We defined effectiveness as linkage to care based on the cohort study’s definition. Our primary outcome measure was incremental cost per enrolled individual linked to care. The model’s time horizon of 1 year mirrored the duration of the cohort study.
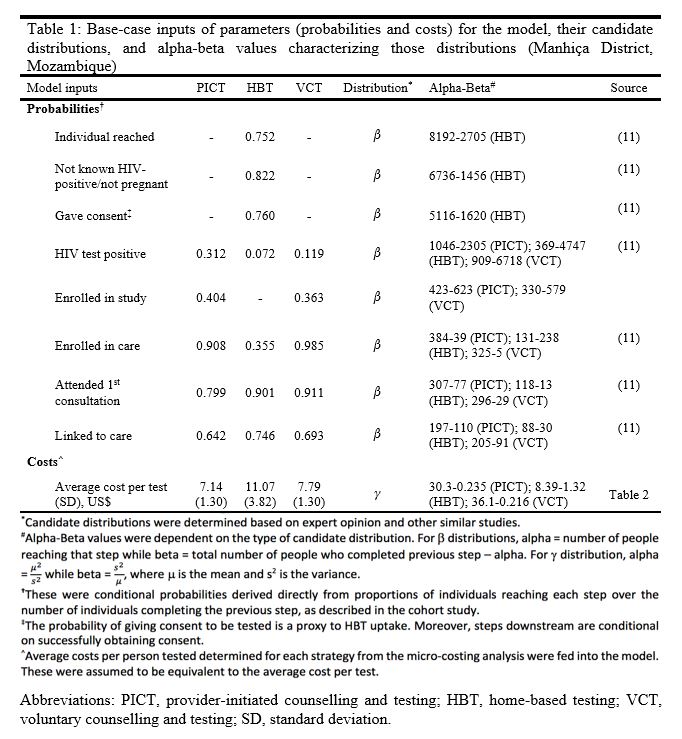
The model captured all steps of the HIV care cascade for both VCT and PICT from diagnosis to retention in care after 12 months of follow-up. For HBT, the model additionally captured steps before the HCT process, from being reached through HBT to obtaining consent. One-year cumulative proportions, reported as the percentage uptake at each step of the HIV care cascade (figures reported in Appendix 1), were directly converted into conditional probabilities for parameterizing the decision tree (Table 1).
The key assumptions of the model were
1) Linear, unidirectional transitions along the care cascade; uptake at each step must be conditional on the previous step;
2) Only early treatment uptake (≤3 months post-diagnosis) at each step was modelled; and
3) Costs incurred for individuals who cannot be reached through or deemed ineligible for HBT are inconsequential to total program costs.
We calculated the expected average costs and linkage-to-care proportion per person tested for each HCT strategy, by summing costs and outcomes of each branch of the tree weighted by their associated probabilities of occurrence. A ratio of average costs and average expected linkage-to-care proportion was calculated to determine expected HCT linkage-to-care costs.

Unlike the derivation of CERs, data only for enrolled individuals was used to determine ICERs to facilitate accurate comparisons of effectiveness. We determined ICERs by dividing the difference in expected costs over the difference in the expected proportion of enrolled individuals linked to care.

Sensitivity analysis
Our univariate sensitivity analysis varied key cost-related parameters within predefined sensitivity ranges (Appendix 7) to explore the robustness of results. Lacking published data, we empirically adjusted base-case values by ±20%, referencing ranges used by Mwenge et al. in their determination of HCT costs in three SSA countries.23
We performed deterministic and probabilistic sensitivity analyses (DSA and PSA) as part of the CEA. In the DSA, probabilities and average costs per test were varied at the maximum and minimum values defined by their respective distributions (Table 1). In the PSA, we performed 2000 second-order Monte-Carlo simulations and plotted each result on a cost-effectiveness plane. Cost-effectiveness acceptability curves (CEACs) were constructed to determine the cost-effectiveness threshold.