In an R0 or R1 resection margin, region of interest (ROI) is an irregular strip-shaped area, its structure contains complex internal details such as capillary distribution, cancer cell tissue, and pancreatic cell tissue, etc. Statistical texture analysis methods are appropriate for this. Multi-resolution texture analysis methods perform well in extracting detail features. However, both statistical texture analysis methods and multi-resolution texture analysis methods are limited to irregular strip-shaped and small ROIs. We developed a CAD system. It relieved these limitations and performed classification on R0 and R1. Figure 1 illustrates the framework of the CAD system. It consists of five stages.
Stage 1: obtain ROIs by preprocessing patients’ CT images.
Stage 2: by solving discrete Laplacian equations with Dirichlet boundary conditions, fit ROIs to rectangular regions.
Stage 3: combining wavelet transform and fractional differential, enhance textures of the rectangular ROIs.
Stage 4: combining wavelet transform and statistical analysis methods, extract texture features from the enhanced ROIs
Stage 5: reduce features using principal component analysis (PCA) and perform classification using support vector machine (SVM) (use a linear kernel function and leave-one-out cross-training and testing to reduce overfitting).
Patients
This study retrospectively analyzed 86 patients who were diagnosed as pancreatic head adenocarcinoma by preoperative abdominal CT examination at West China Hospital from October 2015 to March 2018. These patients underwent pancreaticoduodenectomy, and postoperative pathological examinations showed pancreatic head adenocarcinoma. These cases of patients (34 cases of R0 and 52 cases of R1) were screened based on NCCN guidelines for diagnostic criteria and standard surgical procedures.
Abdominal scan and enhanced scan were performed using 64-slice spiral CT of American GE. Collimator was set to 0.625 mm, FOV was set to 350 mm × 350 mm, tube voltage was set to 120 kV, tube current was set to 160 mAs, layer thickness was set to 1.250 mm. In enhanced scanning, iopamide was injected via cubital veins, flow rate was 3 ml / s, dose was 90 ~ 100 ml, delayed time was 25 ~ 30 s for scanning of portal-venous phase. We used portal-venous phase CT images as the objects of radiomic analysis. A CT image was exported as an 8-bit grayscale image (the range of gray-level was [0, 255]).
Delineation and Segmentation
Steps of delineating and segmenting are as follows: 1) choose three portal-venous phase CT images from each case, which located at the top, middle, and bottom of a tumor; Figure 2 [11] illustrates the locations; 2) delineate resection margins around portal veins on the chosen images; it is shown in Figure 3; to ensure authenticity of signals, the delineated resection margins exclude edges of stent and metal artifacts; 3) segment the delineated areas to form ROIs using region growing.
Two physicians with 10 years of experience in abdominal CT diagnosis delineated all resection margins. The first physician delineated the resection margins, and repeated the delineations after 2 weeks to prevent measured deviations. The other physician only delineated the resection margins once to assess whether his delineations was consistent with the delineations of the first physician.
Fitting ROIs
As can be seen from Figure 3, ROIs are irregular strip-shaped regions. An image is a two-dimensional signal based on rows and columns. We fitted the strip-shaped ROIs to rectangular ROIs by solving discrete Laplacian equations with Dirichlet boundary conditions. The fitting method is abbreviated as LD. LD has a good application in signal fitting [12–14]. It can fit missing information of an original image very well. Discrete Laplace equation can be defined in Eq. (1).
[Due to technical limitations, this equation is only available as a download in the supplemental files section.] (1)
Eq. (1) shows that a linear equation can be established based on a 4-neighborhood of a point (to be fitted) . A region to be fitted is named as a mask. If a current pixel is on an edge of the mask, then at least one of its neighbors (on the Dirichlet boundary) is known. A set of linear equations can be established along the Dirichlet boundary (along edges of the mask). The values of pixels to be fitted can be obtained by solving that set of linear equations. This solving procedure is then extended into interiors of the mask. Figure 4 shows a mask to be fitted and its boundaries. Figure 5 illustrates two fitting examples.
Enhancing ROIs
In histopathology, an ROI of R1 has cancer cells, some parts of its tissue are more compact, and its capillary distribution is less; while an ROI of R0 has no cancer cells, it only contains pancreatic tissue, its capillary distribution is more abundant [15–16]. However, these differences are just qualitative in details and difficult to visually observe from CT images. Multi-resolution analysis methods are advantageous in local time-frequency analysis and are appropriate for deriving detail characteristics. Statistical analysis methods can usually derive representative mathematical descriptors. It can be inferred that multi-resolution analysis methods and statistical analysis methods are appropriate here. They are two types of texture analysis methods that are frequently used in radiomics, and they are also frequently used in the radiomic researches related to pancreatic cancer in recent years [4–10]. Furthermore, to improve the performances of these texture analysis methods, the CAD system enhances textures of the fitted ROIs before extracting texture features. The main purpose of texture enhancement is to highlight high-frequency contour information (detailed information, that is, portions of gray-levels that changes relatively more varied or more quickly) while preserving low-frequency smoothing information as much as possible. Traditional enhancement methods such as histogram equalization, integer-order differentials, frequency enhancement filters, etc., increase contrast or highlight contours, but they lose lots of low-frequency texture information and usually sharpen contour information. In recent years, applying fractional differentials in medical image processing compensates for the drawback of greatly losing low-frequency information, making it an effective method for texture enhancement [17–19]. As stated above, we consider the following 3 factors:
- Wavelet transform is appropriate for detail analysis of an image, and its characteristic of perfect inverse transform enables corrections of transform coefficients to be highlighted in the reconstructed image.
- Fractional differential can enhance contours without sharpening edges.
- From the histopathological analysis, the characteristics of the details can well characterize R0 and R1.
We designed a texture enhancement method with reference to Grumwald-Letnikov (G-L) fractional differential definition and wavelet transform [20–21]. The enhancement method is abbreviated as WF. It’s illustrated in Figure 6.
Step 1: Decompose an ROI into 4 components using wavelet transform (22): H (horizontal), V (vertical), and D (diagonal), which represent high-frequency components; A (approximate), which represent low-frequency component. The approximate component can be decomposed again.
Step 2: Convolve each high-frequency component (including all high-frequency components in decompositions of all levels) with a fractional differential operator M.
Step 3: Perform wavelet inverse transform based on the convolution results of Step 2 and the approximate component in the last-level decomposition.
Wavelet inverse transform will reconstruct the ROI, which is the enhanced ROI. In the WF method, the steps we construct the fractional differential operator M are as follows:
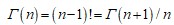
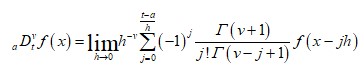
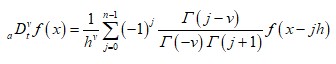
1) Discretize G-L definition: Eq. (2) is the v-order fractional differential G-L definition of f(x) on [a, t], where 𝛤(...) is a Gamma function; discretize the continues duration [a, t] equally by unit interval h, where n = [(t-a)/h]; it’s known that 𝛤(n) = (n-1)!=𝛤(n+1)/n, Eq. (3) can be derived.
[Due to technical limitations, this equation is only available as a download in the supplemental files section.] (2)
[Due to technical limitations, this equation is only available as a download in the supplemental files section.] (3)
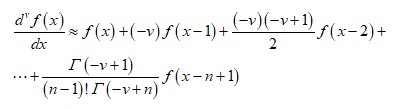
2) Expand Eq. (3): it’s know that h=1 (unit interval), Eq. (4) can be derived.
[Due to technical limitations, this equation is only available as a download in the supplemental files section.] (4)
We constructed a fractional differential operator named M based on the expanded coefficients of Eq. (4). Figure 7 demonstrates the operator M. The operator M performs fractional differential operations in eight symmetric directions in a 5×5 neighborhood. The c at the center point position is an adjustable parameter and is called compensation parameter. In experiments, the order v and the parameter c can be appropriately adjusted. Figure 5 illustrates two enhancing examples using the WF method.
Texture Analysis
Deep learning algorithms have made significant progress in image pattern recognition. However, these algorithms are limited by problems of small samples, small targets, etc. [23–24]. Moreover, deep learning algorithms lack pertinence in quantitative analysis of ROIs, which requires analysis of between quantitative data and clinical outcomes, or analysis of between quantitative data and histopathological characteristics. Therefore, ROI-based radiomics is the main approach of CAD systems based on medical images.
As described above, it recommends extracting texture features using multiresolution analysis methods and statistical analysis methods. Actually, some similar studies also used these two types of methods [5–10]. We repeated these texture analysis methods in experiments to compare them with the method in this paper. In this paper, we combined these two types of analysis methods in order to better describe the details.
We used a texture analysis method that combining wavelet transform and statistical methods (histogram, co-occurrence matrix, and run-length matrix). Reverse biorthogonal wavelets (rbio) are compactly supported biorthogonal spline wavelets for which symmetry and exact reconstruction are possible with FIR (finite impulse response) filters. Wavelet of rbio was used in this research. The steps of feature extraction are as follows:
Step 1: Perform wavelet transform on an ROI (has fitted and enhanced); a decomposition will derives 4 components; a coefficient matrix uniquely expresses a component.
Step 2: Convert a high-frequency component to a grayscale image called subband image.
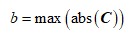
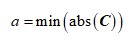
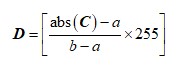
In a coefficient matrix of a high-frequency component, elements with larger absolute values usually represent singular value points (meaning a fast and large change). First, absolute values of coefficient matrices are calculated. Then, elements of a coefficient matrix are linearly and equally discretized into a grayscale range of [0, 255] (the range of gray-level) according to the minimum and maximum values of the coefficient matrix. The calculations are shown in Eqs. (5)-(7), where C is the coefficient matrix and D is the discretized matrix (subband image).
[Due to technical limitations, this equation is only available as a download in the supplemental files section.] (5)
[Due to technical limitations, this equation is only available as a download in the supplemental files section.] (6)
[Due to technical limitations, this equation is only available as a download in the supplemental files section.] (7)
Step 3: Extract features from subband images using histogram, co-occurrence matrix, and run-length matrix. Considering that the size of a subband image is also small, gray-levels of pixels are rescaled and then statistical methods are applied.
Feature Reduction and Classification
Reducing features can usually improve classification performance. We used principal component analysis (PCA) for feature reduction and limited the number of features to reduce overfitting. Empirically, it is appropriate that the number of features is 1/5 or 1/10 of the number of samples, and a linear classifier allows for more features.
Support vector machine (SVM) [25] is widely used due to its outstanding performance in pattern recognition problems of small samples. To reduce overfitting, we used a linear kernel and used leave-one-out cross-training and testing. Linear kernel-based SVM allow more features without easily overfitting. In the vast majority of cases, especially in classification problems of small samples, the model evaluated in the leave-one-out method is close to the model that expected to be evaluated using training data. Thus, evaluation results of the leave-one-out method are often considered more accurate [26].