Surface characters and developmental toxicity assessment
Transmission Electron Microscopy (TEM) was used to characterize the morphology and size distribution of four kinds of GQDs. As shown in Fig. 1a, the TEM images showed that the four kinds of GQDs gave a narrow size distribution with well monodisperse, which indicated their high quality. Clear lattice fringes exhibited their graphitic structure with lattice spacing (d = 0.21nm, 0.24 nm) corresponding to (100) diffraction facets of graphite [44–46]. Data of XPS full spectrum scan showed that GOQDs were among the most complex in the atomic ratio, including C1s (44.21%), O1s (34.59%), Na1s (6.79%), Si2p (8%), Cl2p (2.44%), S2p (2.28%), and Sc2p (6.11%), whilst C-GQDs contained only C1s (58.13%) and O1s (41.87%) (Fig. 1b and Table S2). We performed the curve fitting analysis based on the individual elemental scanning, mainly C1s and O1s (Fig. S1a). C1s spectra of R-GQDs and A-GQDs were deconvoluted into five peaks of C-C/C = C (~ 284.6 eV), C-N (~ 285.7 eV), C-O (~ 286.6 eV, from C-O or C-O-C), C = O (~ 288.0 eV), and O = C-O (~ 288 eV). The percentage composition of C = O was higher than that of C-O in A-GQDs, while R-GQDs showed the opposite compositional change of C = O and C-O. Both GOQDs and C-GQDs were characteristic of four components in their C1s spectra, including C-C/C = C, C-O, C = O, and O = C-O. The carboxyl O = C-O (~ 533.6 eV) was also observed in the O1s profile of GOQDs and C-GQDs, along with C = 0 (~ 531.5 eV) and C-O (~ 532.7eV, from C-O or C-O-C), whilst the O1s spectra of R-GQDs and A-GQDs were only composed of C = O and C-O. In addition, we made a XPS spectrum scan for the N1s profile of A-GQDs and it was divided into three strong peaks of N-H (~ 399.2 eV), N-C = O (~ 399.7 eV), and NHn+ (400.8 eV) (Fig.S1b), which were consistent with the previous report [30]. Next, it was found from the zeta potential analysis that the four GQDs were all negatively charged in three mediums (Fig.S1c), including ddH2O, 1 × PBS, and 1 × DMEM. Among the four NPs, C-GQDs induced the weakest zeta potential changes in the three mediums, ranging from − 1~ -5 eV. The developmental characters of zebrafish embryos including survival rate, hatching rate, and hearbeat rate were not significantly changed by different GQDs treatment (100 µg/mL) when compared to control group (Fig. S2: a-c). Our exposure assay manifested the low toxicity of the four GQDs to zebrafish embryonic development.
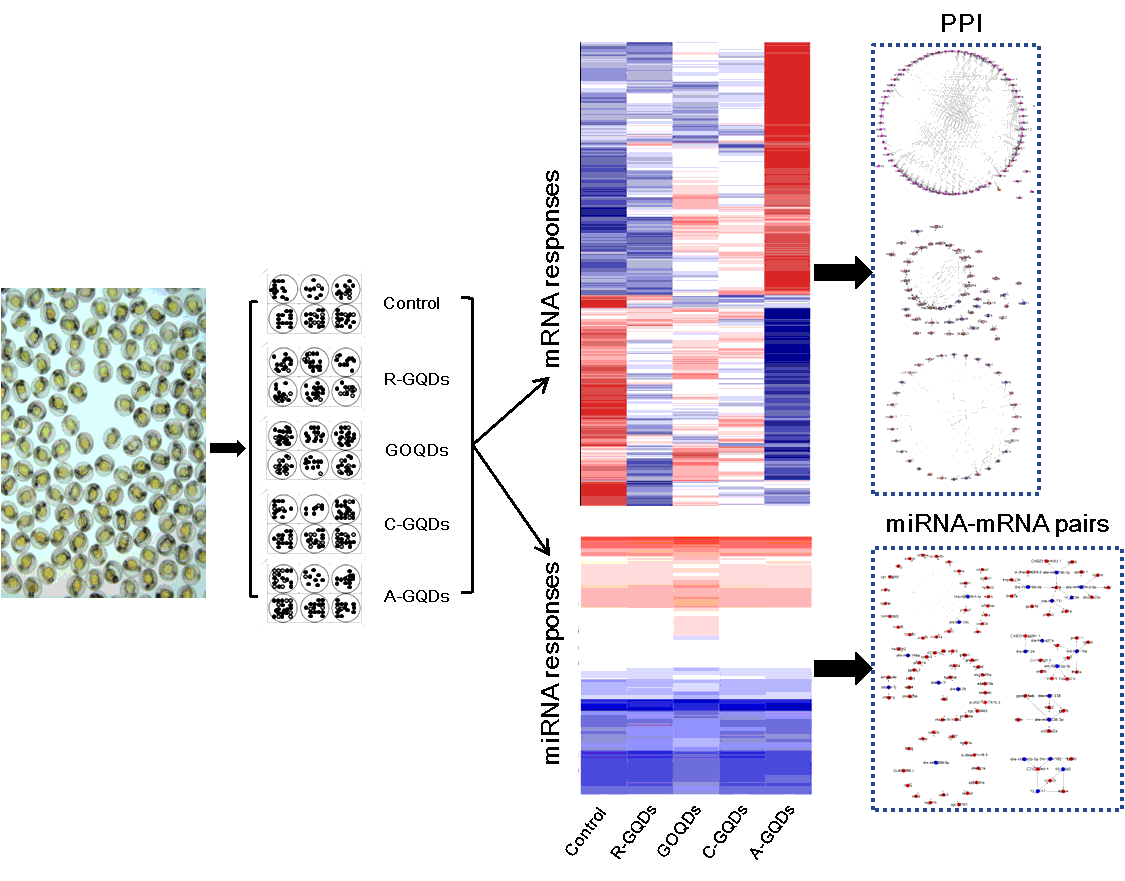
Whole Transcriptomic Profiling
Principle component analysis (PCA) revealed that the mRNA expression data extracted from GOQDs and C-GQDs treatment clustered in close distances, as well as the known miRNA sequencing data among the clusters of control, R-GQDs, and C-GQDs treated groups. A-GQDs treatment was clearly separated from the others regardless of mRNA or miRNA data (Fig. 2a and 2b), and the miRNA data from GOQDs treatment also clustered independently. With the same corrected p value (FDR) < 0.05 and two cutoff settings (FC > 2 or 1.5), two ensembles of DEGs were screened out between control and NPs treated groups. A-GQDs elicited the largest number of DEGs (FC > 2, 1,878; FC > 1.5, 4,796), far more than the total number of DEGs induced in other three GQDs exposed groups (Fig. 2c, Table S3). However, from the miRNA expression levels, GOQDs were found to induce more DEMs (FC > 2, 32; FC > 1.5, 65) than other GQDs, and R-GQDs and C-GQDs exerted negligible effects on miRNAs expression levels (Fig. 2c, Table S4). To excavate the potential genes commonly induced by different GQDs, the Venn analysis based on the DEGs and DEMs data from respective GQDs treatment was performed with a FC cutoff > 1.5 and a significant FDR value of < 0.05, and 75 DEGs were identified to be shared by the four GQDs treatments (Fig. 2d, Table S5), and no overlapping miRNAs are found among various GQDs treatments.
Data Profiling Of DEGs
Conventionally, we performed the functional enrichment analysis of Gene Ontology (GO) and Kyoto Encyclopedia of Genes and Genomes (KEGG) pathways for DEGs identified from different GQDs treatment. With the setting of the threshold as FDR < 0.05, more than 500 subcategories were significantly enriched into three divisions in A-GQDs treated group, encompassing biological process (BP, 329 terms), cellular component (CC, 86 terms), and molecular function (MF, 91 terms). Comparatively, the significantly-enriched GO items were less found in C-GQDs (66), GOQDs (48), and R-GQDs treated group (48) (Table S6). In the top ten GO terms from A-GQDs and GOQDs groups, both share two identical GO terms – ‘cellular response to unfolded protein and response to unfolded protein’ (Fig. 3a), from which DEGs related to hsp genes are highly upregulated. Compared to other GQDs treatments (Fig. 3b), A-GQDs treatment induced more KEGG pathways in relation to lipid and hormone metabolism (Fig. S3a), MAPK signaling pathway (Fig. S3b), complement system (Fig. S3c), ferropotosis (Fig. S3d), cytochrome P450 system (Fig. S3e), all of which directly or indirectly interacted with each other and finally triggered the (pro-) apoptotic signals (Fig. S4).
The up-regulation of hsp genes usually signals the organisms suffering stressful environmental conditions and their translated proteins (heat shock proteins, HSPs) act as intra-cellular chaperones to stabilize novel proteins by guiding their proper folding and conformation [47], we herein made a generalization for all hsp genes and relevant genes across the mRNA expression profiling in all treatments. Heatmap displayed that A-GQDs induce the most number of hsp and associated genes, and R-GQDs elicited the minimal transcriptomic responses of HSP family members (Fig. 4a). To validate the RNA-seq data, ten hsp genes were selected from the Heatmap for qPCR amplification. Results confirmed that most of the qPCR data were in accordance with the mRNA-seq results, and hspa4a, hsp70.2, hsp70.3, and hsp90aa1.2 were significantly upregulated in the four GQDs treatments when compared to controls (Fig. 4b).
To better explore DEGs and associated signaling pathways commonly aroused by the four GQDs, we firstly performed a Venn analysis based on the significantly enriched GO terms from different GQDs treatment, and two GO terms – ‘ion membrane transport and ion transport’ are found to be shared by the four GQDs treatments (Fig. 5a). The further Venn analysis revealed that 6 and 10 DEGs were shared by the four GQDs in each GO term (Fig. 5b and Fig. 5c), and finally 8 genes were determined from these DEGs (Fig. 5d). Except the upregulated expression of apoa4b.2 in the four GQDs treatments, other genes related to potassium (K+) and calcium (Ca2+) channels were significantly suppressed by the four GQDs. We further made a generalization about the overlapping 75 DEGs among the four GQDs treatments, which exhibited a congruous expression profiling within three repeating samples between control and treatment groups (Fig. 5e). GO enrichment analysis showed that the overlapping genes were significantly enriched into protein N-acetylglucosaminyltransferase and RNA processing, and splicesome was identified as the only significantly enriched KEGG pathway (Table S7). Next, we performed the protein-protein interactions (PPI) analysis based on these overlapping genes and showed that serine/arginine-rich splicing factor 11 (srfs11) as the center mediator coordinating with other splicing factor to regulate downstream genes, including nktr, hspbp1, rbm5, gpatch8, and arglu1a (Fig. 5f).
Data Profiling Of MIRNAs
In the study, the target genes of DEMs in different GQDs treatment were screened out using multiple prediction databases with reference to respective DEGs database, from which a total of 148 and 153 co-expressed genes for 52 and 13 miRNAs were respectively identified from GOQDs and A-GQDs treatments, and was few miRNA-mRNA pairs found in the other two treatments. Owing to very few GO and KEGG pathways significantly enriched from the target DEGs (FDR < 0.05), we focused on the data mining of the miRNA-mRNA pairs with negative correlations from the four GQDs treatments. 86 and 42 anti-correlated miRNA-mRNA pairs were identified from GOQDs and A-GQDs treated groups, respectively extracted from the combination of 43 miRNAs: 65 genes in GOQDs and 11 miRNAs: 36 genes in A-GQDs treatment, while only one negative miRNA-mRNA pair was identified from the other two treatments (Table S8). Together with the above generalization of the common signaling pathways induced by the four GQDs, several pairs from GOQDs likely involved in the ion membrane transport, ion transport, and the spliceosome pathway. From the GOQDs treatment, three genes (slc25a23a, kcnn1a, trpm1b) implicating in the ‘ion membrane transport and ion transport’ were predicted to be repressed by four miRNAs (dre-miR-455-2-5p, dre-miR-140-5p, 10_1985, 24_18026), while three genes (srsf2a, srsf5a, srsf5a) involving in the spliceosome pathway were probably negatively regulated by dre-miR-15a-5p and dre-miR-16a. In addition, three genes (socs1a, il6st, map2k6) involving in the MAPK signaling pathways were identified to be repressed by dre-miR-7132-3p, dre-miR-19a-5p, and dre-miR-216a in GOQDs treatment. dre-miR-29b3-3p from A-GQDs treatment showed the strongest multitargeting activities and likely involved in the downregulated the mRNA levels of nine genes, in which two pairs (dre-miR-29b3-3p: slc38a8b and dre-miR-29b3-3p: slc44a2) may collaboratively act on the splicesome pathway.
From all negatively correlated miRNA–mRNA pairs, we found that the pair of dre-miR-735-5p and its negatively regulated gene - myogenin (myog) was shared by A-GQDs, GOQDs, and C-GQDs treated groups, and dre-miR-735-5p was not significantly up-regulated by R-GQDs according to the originally-used screening threshold (FDR < 0.5, FC > 1.5). However, it was found that dre-miR-735-5p was induced more than three-fold change (3.165) in R-GQDs treated group when the cutoff as set as p value < 0.01 and FC > 1.5. Then, we employed qPCR to investigate the expression changes of dre-miR-735-5p and its target gene-myog among the four GQDs treatments, and results showed that the expression levels of dre-miR-735-5p in all GQDs treatments were significantly activated when compared to control group, and myog exhibited the similar expression profiling to that in RNA-seq data (Fig. 6), and then suggesting that the dre-miR-735-5p-myog pair could be commonly aroused by the four GQDs.