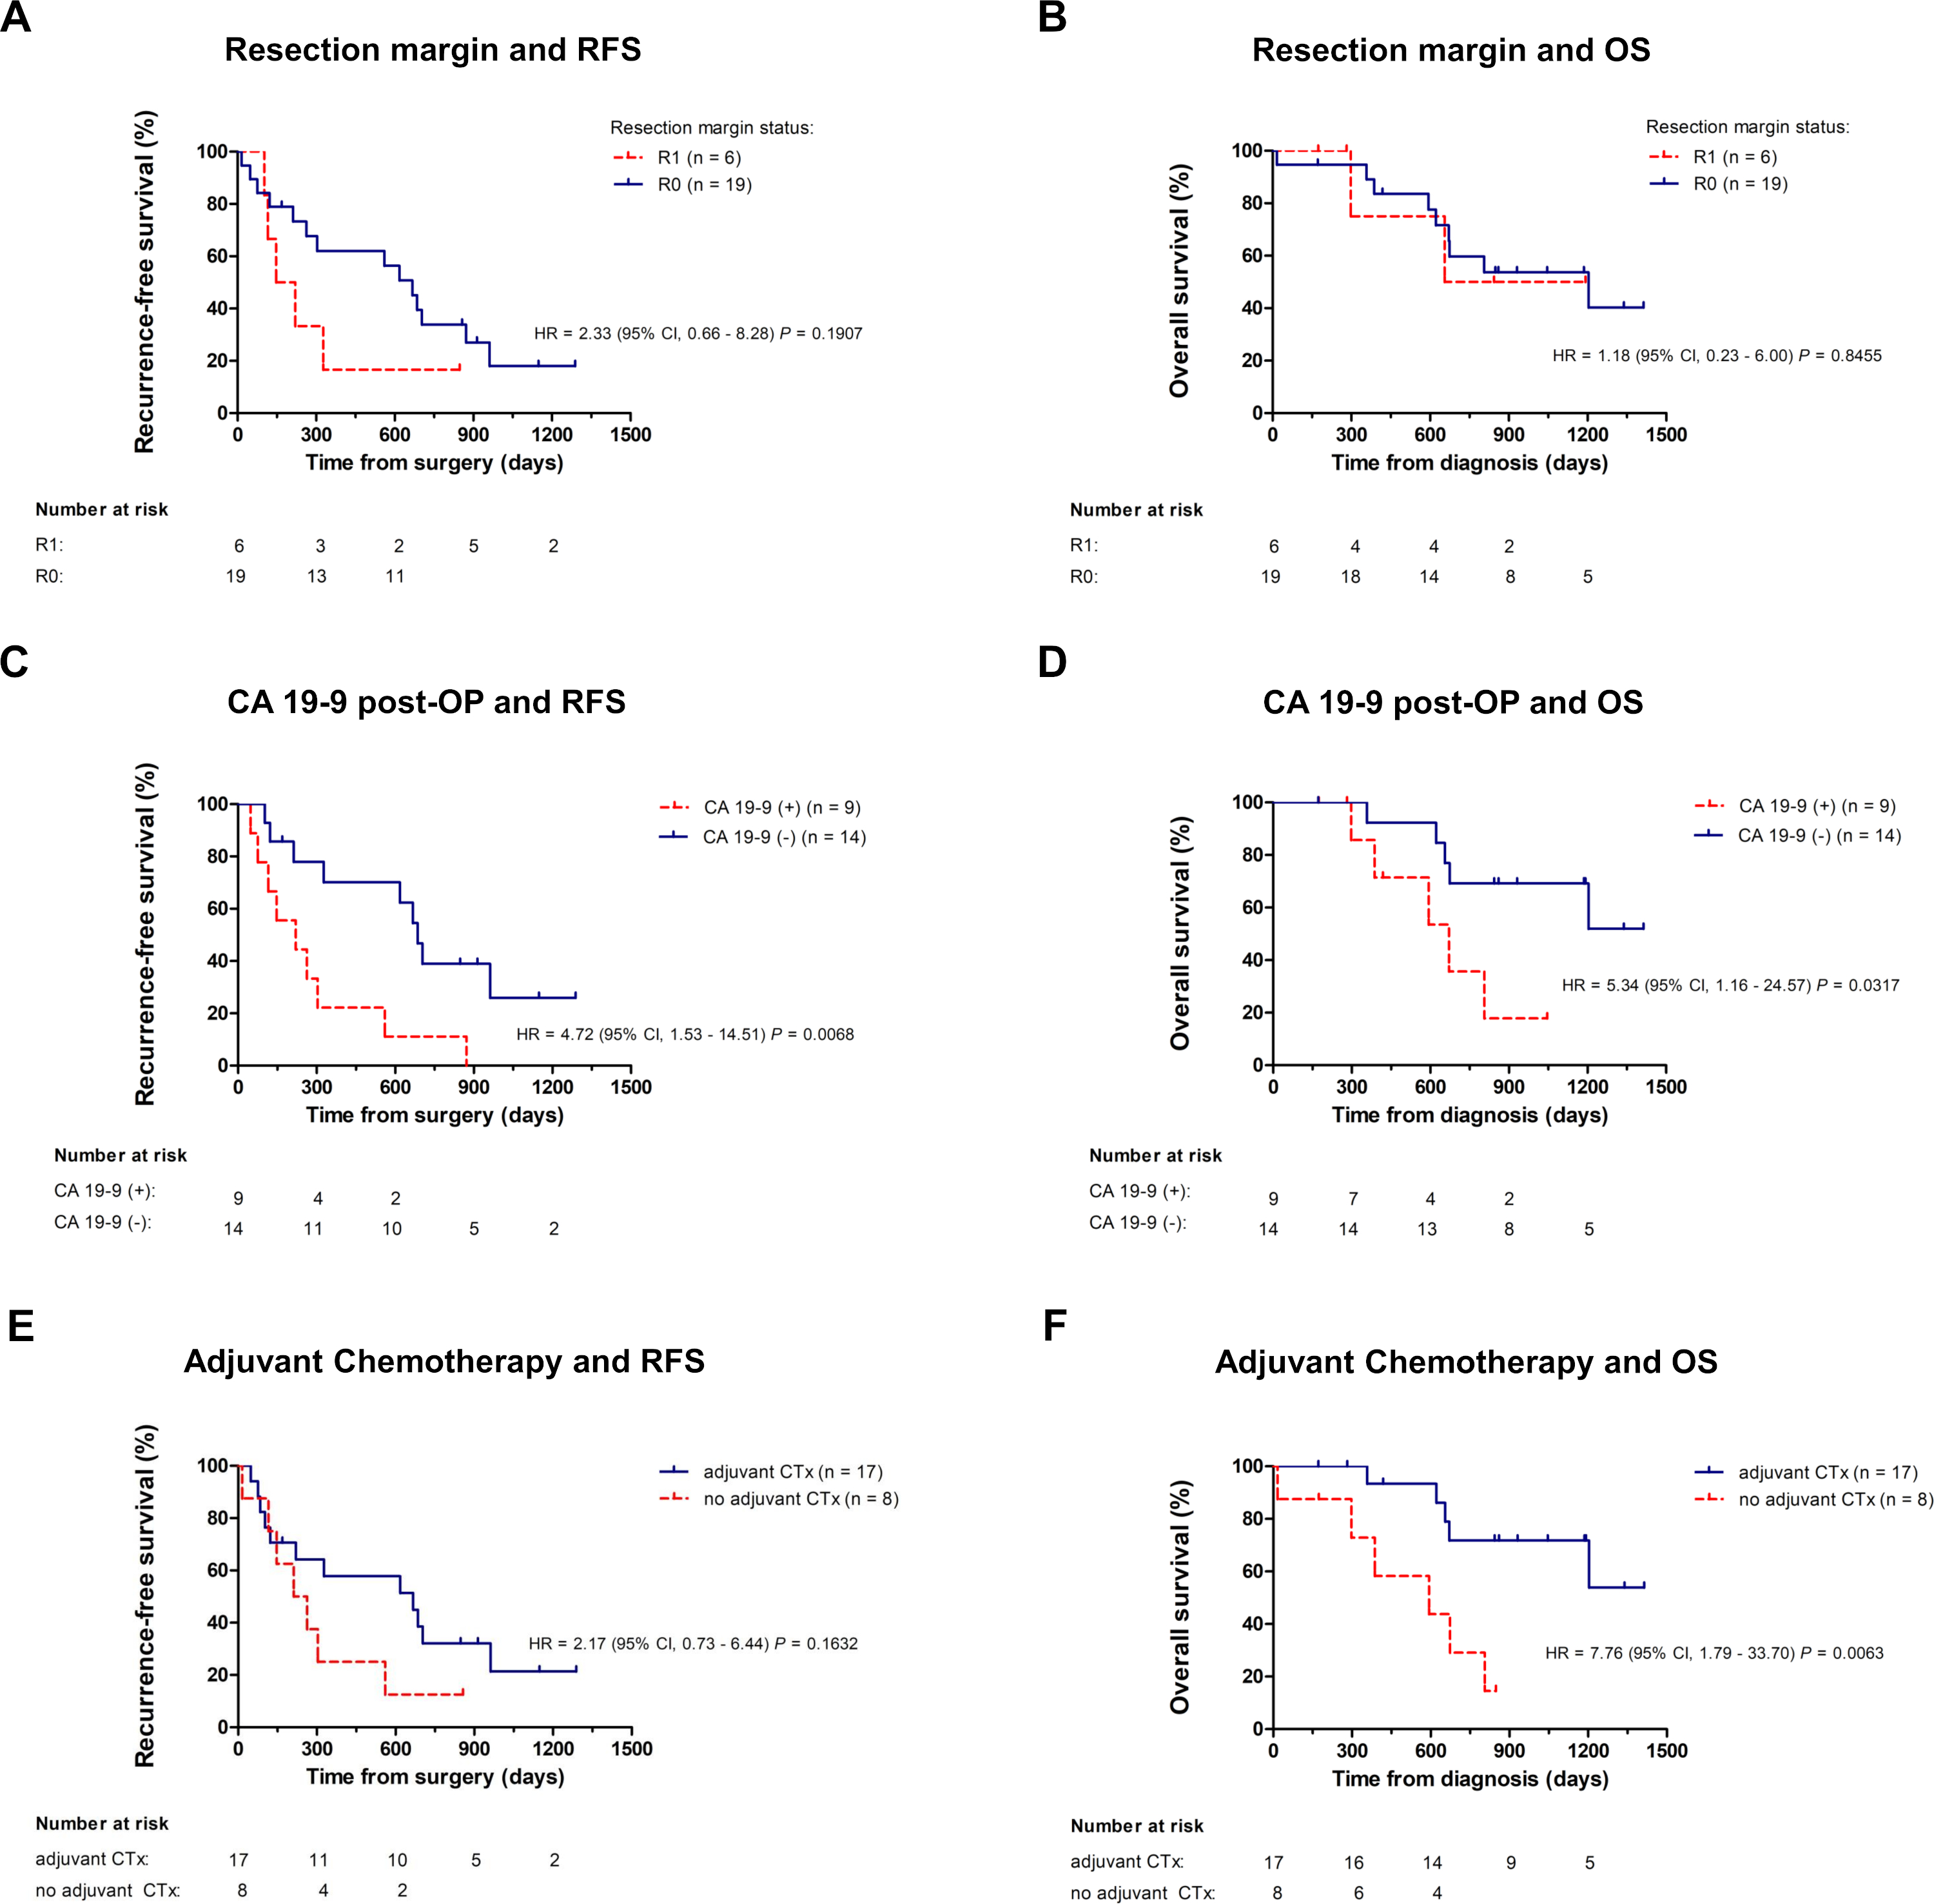
25 patients with nonmetastatic, R0/R1-resected adenocarcinoma of the pancreas were included in the study. Patient characteristics are summarized in Table 1. R0 resection rate was 76% (19/25),12/25 (48%) of tumors were nodal negative (pN0). 17/25 (68%) patients underwent adjuvant chemotherapy. Median follow-up for the cohort was 22.0 months, with 19 out of 25 (76%) pts relapsing during this period. Median RFS for the cohort was 10.0 months, median OS was 22.0 months. We performed univariate and multivariate survival analyses (Supplemental Tables 1 and 2, Figure S1) for established clinicopathologic variables and found a trend towards inferior RFS but not OS for R1 resection (Figure S1 A,B), a significant inverse correlation between elevated CA19-9 in the first sample collected after resection and RFS and OS (Figure S1 C,D) and significantly better OS for patients undergoing adjuvant chemotherapy (Figure S1 E,F).
Table 1
Patient and tumor characteristics
|
Clinicopathologic features
|
n =25 (%)
|
|
Median age (years)
|
75
|
|
Age range
|
42 – 81
|
|
Sex
Male
Female
|
18 (72)
7 (28)
|
|
Tumor location
Pancreas head
Pancreas body & tail
|
20 (80)
5 (20)
|
|
T stage
T1 – T2
T3
|
7 (28)
18 (72)
|
|
N status
N0
N1-2
|
12 (48)
13 (52)
|
|
R status
R0
R1
Rx
|
19 (76)
5 (20)
1 (4)
|
|
Lymphovascular invasion
L0
L1
|
15 (60)
10 (40)
|
|
Perineural invasion
Pn0
Pn1
|
2 (8)
23 (92)
|
|
Grading
G2
G3
|
Adjuvant chemotherapy
Yes
No
|
|
Time to relapse (months)
Median
Range
Overall survival (months)
Median
Range
|
|
13 (52)
12 (48)
1 7 (68)
8 (32)
|
Analysis of plasma cfKRASmut
We analyzed 134 plasma samples collected from 25 patients at routine follow-ups before, during and after adjuvant chemotherapy. First samples were taken at a median of 40 days (95% CI 26-50) after resection prior to adjuvant chemotherapy. Median number of samples collected was 4 samples per patient (95% CI 3-5 samples). Median time interval between sampling was 70 days (95% CI 63-91). We screened cfDNA extracted from plasma samples for the presence of cfKRASmut with recently described discriminatory multi-target KRAS ddPCR assays, covering the 11 most common KRAS hot spot mutations in PDAC [29]. At the postoperative stage, no molecular pathology data was available for any tumor. However, for a subset of patients KRAS mutational status became available at relapse (Supplemental Table 3).
Across all samples analyzed, cfKRASmut was detected in 34/134 (25%) samples and 12/25 (48%) of patients for at least one time point. In 16/16 (100%) patients with later on determined tumor tissue KRAS mutational status, the SNV detected by ddPCR in plasma (cfKRASmut) matched the KRAS SNV detected in tissue analysis (Supplemental Table 3), confirming the validity of ddPCR cfKRASmut analysis. In 0/134 (0%) plasma samples more than one KRAS SNV could be detected above assay threshold.
Association of cfKRASmut and elevated CA19-9 levels with survival endpoints
Detection of cfKRASmut at any time point during study course above assay threshold was not associated with RFS or OS (Figure 1 A, B). However, when a threshold of 15 copies KRASmut per ml plasma for cfKRASmut was chosen, cfKRASmut positivity at any time point during study period was strongly associated with early relapse and poor survival (Figure 1 C, D). CA19-9 levels were determined from the same blood collections as part of clinical assessment. 12/25 (48%) of patients had at least one blood sample with CA19-9 above normal range during study course. Increased CA19-9 at any time point was associated with significantly inferior RFS and a trend towards inferior OS (Figure 1 E, F). Notably, only 6/12 (50%) patients were double positive for cfKRASmut and CA19-9, indicating that cfKRASmut and CA19-9 positivity are not redundant. Patients with either CA19-9 positivity or cfKRASmut levels > 15 copies/mL cfKRAS during study course (14/25, 56%) showed inferior RFS and OS, indicating that the integration of both biomarkers might be predictive and prognostic for a larger group of patients than assaying them individually (Figure 1 G, H). Survival of double positive patients was similar to single positive patients in our cohort (data not shown).
Association of cfKRASmut and CA19-9 dynamics with survival
Protein tumor markers and cfDNA are highly dynamic biomarkers for the molecular monitoring of disease course and treatment response. We therefore next analyzed whether changes over time in either biomarker are associated with outcome in our cohort. For each 9/18 (50%) patients with a sufficient number of follow-up samples, cfKRASmut or CA19-9 levels increased during observation period. Increase of cfKRASmut was associated with significantly reduced OS (Figure 2 A), while increase of CA19-9 was associated with a non-significant trend towards inferior OS (Figure 2 B). Similarly, early increase of cfKRASmut, defined as increase within 6 months after surgery, was strongly associated with inferior OS while early CA19-9 increase was associated with only a trend towards shorter OS (Figure 2 C, D). Integrating both markers for the analysis of dynamic changes over time did not outperform cfKRASmut alone (Figure 2), suggesting that cfKRASmut might be the biomarker of choice for longitudinal monitoring in this setting.
Single patient analysis
Figure 3 illustrates the relationship between cfKRASmut and CA19-9 (Figure 3A) dynamics and tumor relapse for individual patients. 13/18 patients in the analysis relapsed during observation period. Increase of cfKRASmut or CA19-9 was significantly associated with relapse. Single-patient analysis also illustrates dynamic changes during adjuvant chemotherapy and follow-up with several patients showing transient increases followed by decreases of either marker.
Figure 3B illustrates that in most patients, relapsed was proceeded by a strong increase of CA19-9 or cfKRASmut. However, single patient analyses also illustrate that both cfKRASmut and CA19-9 are both highly dynamic markers and that individual patterns are highly heterogenous. Larger cohorts and prospective trials are required to better unravel the relationships and the temporal relationship between biomarker dynamics and clinical relapse and to study the impact of therapeutic intervention.