In order to determine the safety level of the vertebral column systems, there is a need to consider the probabilistic-based approaches. Reliability index is a world-widely measure to evaluate the safety level of a component or a system with consideration of load and resistance distributions. The main step in reliability analysis is to determine the Limit State Function, which can be constructed based on the expected performance level of the structure. In general, several different limit state functions have been considered for structures including the strength, service, fatigue, and extreme events. In this present study, in order to investigate the resistance-ability of the backbone system due to the normal load, the strength limit state function is considered. Therefore, first, the structural component and the statistical parameters of loading and resistance associated with their distributions for normal backbones and scoliosis ones should be determined. Then, the reliability level of each structural component is computed using Monte Carlo simulation. Finally, the reliability indices of both mention system (sound and damaged due to the scoliosis disorder) are calculated.
Mechanical Properties of vertebrae
The intention of this section is to specify the main structural component of the backbone and their presented mechanical properties of those. The vertebral column, also called the backbone or spine, is the main part of the axial skeleton. The vertebral column is made of the series of bone known as ”vertebrae" which are connected to each other by intervertebral discs. Normally, there are thirty-three vertebrae (see Henry Gray (1918)) within the vertebral column. The upper part is made of twenty-four vertebrates and the lower part consists of nine bone located in both the sacrum and in the coccyx. There are seven cervical vertebrae, twelve thoracic vertebrae, and five lumbar vertebrae. As a structural point of the view, vertebrae and intervertebral discs can be considered as two main structural components for axial load carrying capacity. Each vertebra is composed of cancellous bone (soft part) and cortical bone (hard part). In this section, the mechanical properties of both cancellous and cortical bone are reviewed.
Many studies have been conducted to determine the mechanical parameters, including the density of the vertebrae (Rockoff et al. 1969). Ebbesen et al. (1999) measured different densities of vertebrae such as ash density of cortical and cancellous and bone mineral density. They showed the relationship between age, mass, and density of vertebrae. In addition, Helgason et al. (2008) studied the relationships between the physical and mechanical properties of bone using ash density. They utilized the proposed relationship between the ash and apparent density proposed by Keyak et al. (1994). Accordingly, Ebbesen et al., 1999 tested yield stress of several vertebrae. In another study, Mosekilde et al., 1987 examined the relationship between ash density and maximum stress. Kopperdahl and Keaveny (1998) conducted a research to evaluate the stress-strain behavior for cortical part of vertebrae. Also, Öhman et al. (2011) conducted a real test to investigate the mechanical properties of bone. Patel et al. (2016) used the Hounsfield unit to predict the stress limit of the bone for cortical tissue. Recently, Azari et al. (2018) collected the mechanical properties of vertebrae. As can be seen, based on the reported literature, the mechanical properties of the bone behave as a random variable. Therefore, in this study, although the moduli of elasticity of bones are considered as the deterministic parameters (Table 1), the yield stresses of vertebrae are assumed to be treated as random normal variables (Table 2).
where Eij and Gij denote the modules of elasticity in different directions. And vij represents the Poisson’s ratio of bone in various directions.
Mechanical Properties of Intervertebral discs
Intervertebral discs with exerting the flexibility and small movements between the adjacent vertebrae make it possible to bend the entire spine. Intervertebral disc also distributes the load evenly on the body of the vertebrae. The intervertebral discs are extremely resistant under pressure and are very effective in absorbing shock in the spin. The intervertebral discs have three main layers (Adams, 2015): 1- core layer which is called “nucleus pulposus”, 2- intermediate layer which is named “annulus fibrosus”, and 3- outer thin layer known as cartilage endplate. The high amount of water in disc causes hydrostatic pressure and viscous-elasticity behavior. Several studies have been conducted to determine the mechanical properties of discs (Iatridis (1995) and Iatridis et al. (1996)). Furthermore, Pollintine et al. (2010) studied the time-dependent changes in the time-spatial shape of the discs and vertebrae in the spinal column. However, Wang et al. (2000) used a 3D viscoelastic verified finite element model to investigate the mechanical properties of the L2-L3 lumbar vertebrae. Larde et al. (1982) studied 36 cases of bone marrow infection in the spine for three years. The mean age of the patients was 42 ± 5 and in the range of 10 to 72 years. In healthy subjects, the CT scan obtained from discs between 73 ± 13 units of Hounsfield on a 1000HU scale. Wintermantel et al. (2006) investigated the condition of 34 patients with lumbar disc herniation the Hounsfield’s unite for a healthy part of the disc has been reported between 70 and 80 units. In order to measure the tensile strength of the intervertebral discs Adams (2015) conducted an experimental study. Table 3 shows the tensile properties of annulus fibrosus, derived from uniaxial tension tests on small annulus samples from human lumbar discs aged 48–91 years. Adams performed preliminary tests indicating that the tensile stress in the intervertebral disc core is about 0.26 MPa (range 0.08–0.64). In addition, Mow and Huiskes (2005) stated that the nature of annulus fibrosis is resistant to tension and elongation at the disc caused by the movement of the adjacent vertebrae and the pressure of the inflammation. Galante (1967) measured the tensile properties of annulus fibrosis and showed that the function of this tissue is a nonlinear, heterogeneous, and anisotropic and it is viscose material and its properties are sensitive to its hydration state. Skaggs et al. (1994) examined the tensile properties of single-layer samples along the dominant fiber direction, and obtained E values from 60 to 140 MPa, depending on the region of the annulus. Young’s modulus was obtained for multilayer samples of 25 MPa in a radial direction less than 0.5 MPa. The values measured for the Poisson ratio were significantly greater than 0.5, which indicates the anisotropic behavior of the annulus area. Mow and Huiskes (2005) collected and presented the results of various experiments in the biomechanics of the base of orthopedics and biomechanics, including the intraocular properties and mechanical behavior of the discs in swelling, elasticity, pressure and cutting. In addition, in this study, the tensile modulus of internal and external parts of the annulus fibrosus have been presented taken by and Iatridis (1996). in this study, it is attempted to model both annulus and nucleus tissue of disc. Therefore, based on the discussed precious studies in this section, the main mechanical properties of disc including shear relaxation modulus, bulk relaxation modulus, and relaxation time constant are assumed as the deterministic parameters (see Table 3). However, in order to perform the reliability analysis, the yield stresses of annulus and nucleus part of the disc are considered as a random variable, which represented in Table 4.
Structural Analysis
Geometry Modeling
For modeling, a 3D model of the healthy spine was developed using Rino software. Then, cancellous and cortical part of vertebrae simulated according to the collected data. Also, for modeling intervertebral discs, annulus fibrosus was simulated as a layer cylinder and nucleus pulposus simulated as a cylinder. For modeling of ligaments and tendons, spring replacement model was used. First, a healthy three-dimensional spinal column model was developed. A CT scan of a person with scoliosis developed with EOS technology was used for 3D modeling (see Figure 1).
The amount of displacement of each vertebra was measured from the CT scan image and applied on a healthy sample model, and the patient’s 3D model was prepared. The vertebra is composed of two parts of cortical and cancellous. The intervertebral discs are consisted of annulus and nucleus as viscoelastic material (see Figure 2).
In this research, the ligaments and tendons were also modeled using linear springs with stiffness equal to 205.6 N/mm (see Figure 3).
In addition, Scoliosis model of spine developed from normal spine and data getting from by EOS scans and is simulated using the information obtained from the scanned image and prepared sample of the healthy spine. The 3D model used in the Ansys. In order to perform the reliability analysis, there is a need to generate a sufficient number of the models. To reach this intention, 24 samples, 12 female samples (20years old 30 kg and 40kg, 35 years old weighing 50 kg, 60 kg, 70 kg and 80 kg) and 12 male samples (20years old 30 kg and 40kg, 35 years old weighing 50 kg, 60 kg, 70 kg and 80 kg) for a healthy case and scoliosis case are generated using ANSYS Workbench software.
Loads and Supports
For loading, assuming that about 50–60% of the body’s weight is tolerated by the spine, this amount divided between the vertebrae evenly. Weight of head assumed about 4.5–5.5 kg, which is represented by two concentrated symmetrical forces on the second cervical vertebra, the C2. Considering the case in standing position, the upper surface of the Sacrum was defined as a fixed support. Thus, the displacement of the sacrum was limited in all directions (see Figure 4).
Validation
In order to assess the accuracy of the obtained result, the stresses state of the disc between the 4 and 5 lumbar vertebrae in a standing position subjected to the compression was compared with the presented result of Azeri et al. (2018). As can be seen in Figure (5), the obtained stress results in the current study was reached to the almost the same result presented by Azari et al. (2018), which can be considered as a verification of the current conducted research.
Accordingly, several FE models with the generated random properties were analyzed to compute the stress states of the vertebral column. The most vulnerable zones of normal vertebral column for different human weights are tabulated in Table 5.
As it was observed, the most vulnerable stress zone for normal backbone are placed on discs C5-C6-C7 or T6-T7-T8 and on vertebrae C7, T2, or L3 varies depending on human body weights. In addition, Table 6 represents for the most vulnerable zone of the vertebral column associated with the different human weights for one of considered scoliosis curvature.
Based on the obtained results, the vulnerable stress zones of the considered scoliosis spinal column are placed on discs T6-T7or C7 and on vertebrae T1, T8, T10. Although the most vulnerable zone of scoliosis vertebral column varies depending on the curvature, the maximum, based on several FEM performed model in this study, it was observed that the maximum stress states are approximately concentrated on the inflection points of the scoliosis curvature (See Figure 6).
As shown in Figure (6), the maximum stresses were observed near the inflection points of the spinal curvature for a 30 Kg-female-case-study suffered the scoliosis disorder.
System Reliability
Failure Mechanics
The vertebral column consists of the two main structural components which may fail in different manners. In this study, the tension and compression principal stress states of cortical and cancellous are compared with the yield stress limit to figure out the failure mechanism of vertebrae. Accordingly, the vertebral probabilities of failure are determined based on the parallel probability of failure of both cortical and cancellous either corresponding to the tension yielding limit or compression yielding limit states. The same scenario may happen for intervertebral discs. It means both tension and compression stress states within annulus and nucleus are compared with the yielding tolerance of annulus and nucleus to specify the failure probability of intervertebral discs. Eventfully, the vertebral system failure probability is consists of a series model of vertebrae and intervertebral discs.
Reliability analysis
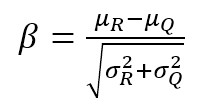
Here in this section, based on the obtained stresses results of the vertebral columns, the reliability index for each component of the spine was calculated. As it was mentioned, in order to perform the reliability analysis, there is a need for the establishment of the limit state function. There are several limit states associated with the various structural performance concerned (Ghasemi and Nowak 2016a, 2016b, 2017a, 2017b, 2018, and 2019). In this study, the strength limit state function is considered as the backbone performance function. Therefore, the reliability indices for both cortical and cancellous of vertebra tissues, and both tissues of intervertebral discs (annulus and nucleus) are computed. In general, the reliability indices can be determined using the distributions of the structural resistance (R) and applied load (Q). If the limit state function is formulated as a linear function and the load and resistance distributions follow the normal one, the reliability index can be computed using the following equation.
[Due to technical limitations, this equation is only available as a download in the supplemental files section.] (1)
where μR and μQ present the mean value of load and resistance. Also, σR and σQ denote the standard deviation of load and resistance. However, the establishment of the limit state function requires a closed form equation. In this study, as a-state-of-the-art, a novel procedure is utilized to determine the reliability index. In this innovated procedure, first, the stress’s state of all elements are ascertained using finite element analysis. Then, the most vulnerable zones of the vertebral column due to the axial loading conditions are recognized. Accordingly, several FEM models of the vertebral column are created based on the random variables of the material and geometry. Finally, based on the obtained random stress results, the distribution of the applied loads are determined. On the other hand, based on the collected data of stress limit of backbone components the resistance distribution of vertebrae (cortical and cancellous) and intervertebral discs (annulus and nucleus) are generated. Hence, the reliability index of each component is determined.
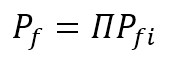
Finally, the system reliability indices of the normal and scoliosis backbones are determined. To capture this intention, the system reliability formulation is constructed with consideration of the parallel and series algorithm for the given backbone. Since the applied forces on the vertebrae are distributed between cortical and cancellous, cortical and cancellous within the vertebrae are constituted a parallel system. The same condition can be observed for intervertebral discs, in which both tissues of annulus and nucleus construct the parallel system. The failure of the parallel systems can be derived using the following equation:
[Due to technical limitations, this equation is only available as a download in the supplemental files section.] (2)
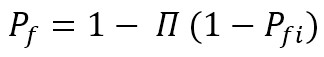
where Pf is the probability of the system failure, and Pfi is the failure probability of the ith component. However, the load contribution between the vertebrae and discs can be assumed as the series system. The governing equation to describe the failure probability of a series system can be written as follow:
[Due to technical limitations, this equation is only available as a download in the supplemental files section.] (3)