Data download
RNA-seq data of endometrial adenocarcinoma were downloaded from the TCGA dataset, comprising a total of 425 samples, including 19 normal samples and 406 cancer samples. The miRNA-seq data comprised a total of 423 samples, including 18 normal samples and 405 cancer samples.
DEG identification
A total of 2,731 differentially expressed mRNAs were obtained, 1,566 of which were up-regulated and 1,165 were down-regulated. A total of 979 differentially expressed lncRNAs were obtained, 611 of which were up-regulated and 368 were down-regulated. A total of 170 differentially expressed miRNAs were obtained, 127 of which were up-regulated and 43 were down-regulated (Fig. 1, Supplementary Material 1–9). The predicted target genes were intersected with the screened differentially expressed RNAs, and visualized with a Venn diagram. The constructed ceRNA network diagram of differentiated RNAs in endometrial adenocarcinoma is shown in Fig. 2, including 90 mRNAs, 81 lncRNAs, and 25 miRNAs.
WGCNA
Twenty-seven cancer samples were randomly selected from the TCGA data for further WGCNA analysis of the 196 differentially expressed RNAs in the ceRNA network. The heat map of the correlations between patient characteristics and RNA expression is shown in Fig. 3a. A total of seven modules were constructed: MEbrown, MEblack, MEyellow, MEgreen, MEred, MEblue, and MEturquiose (Fig. 3b). Based on the final scale-free network constructed (Fig. 3c–d), the GeneSignificance( GS) and Module membership(MM) values of the modules were calculated according to combined analysis of modules and trait data along with mining the modules and key genes that play a key role in endometrial adenocarcinoma (Supplementary Material 10). The modules and trait data were found to be significantly correlated, and the heat map of these relationships is shown in Fig. 4a. Overall, this analysis indicated that hypertension was positively correlated with the MEturquiose module (p = 0.005), and history of other malignancy was positively correlated with the MEbrown module (p = 0.02). The gene clustering tree and heat map of the network are shown in Fig. 4b, and the genes in these two modules were input into Cytoscape (3.7.0) to obtain the weighted ceRNA network graph (Fig. 5).
GO and KEGG enrichment analysis
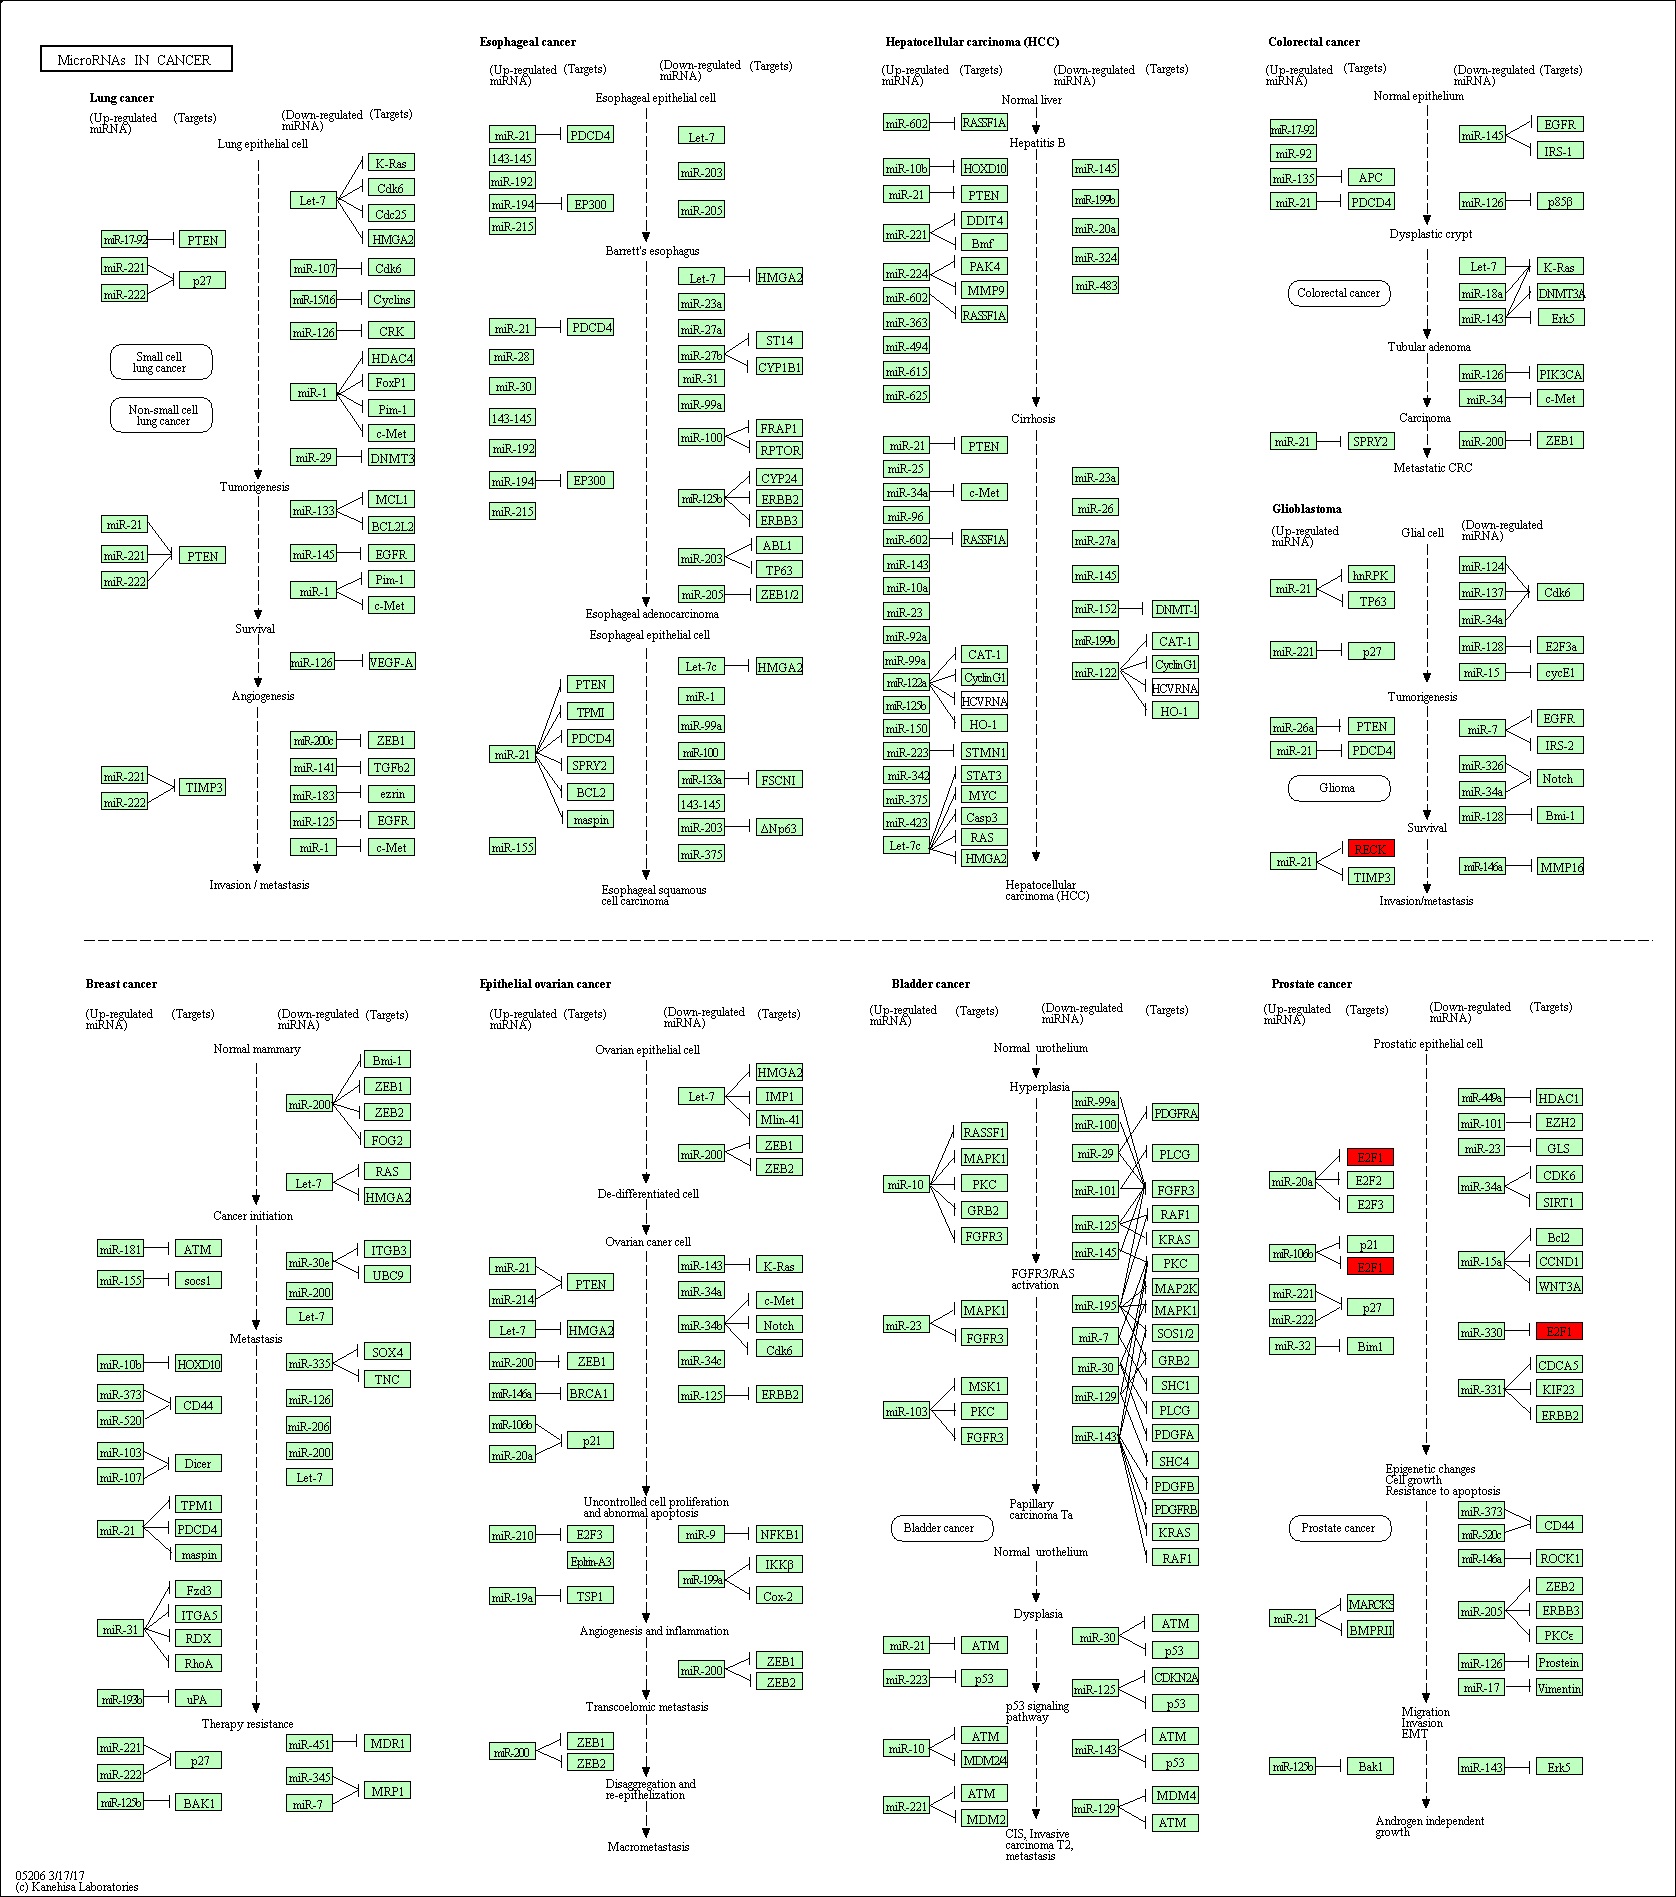
The GO terms related to these topology modules indicated important functional features. The MEbrown topology module was significantly enriched in four GO terms (Supplementary Material 11): GO 0043565 (p = 2.44E-04), closely related to the molecular function of sequence-specific DNA binding; GO 0080301 (p = 0.012), closely related to the molecular function of DNA binding/bending; GO 001837 (p = 0.024), associated with the biological process of epithelial-to-mesenchymal transition; and GO 0045944 (p = 0.029), associated with the biological process of the positive regulation of transcription from RNA polymerase II promoter (Fig. 6b). The MEturquiose module was significantly enriched in 12 GO terms (Supplementary Material 12). A circle diagram was used to represent the top five GO enrichment terms with the most significant differences, which were all associated with biological process terms (Fig. 6a): GO 0045944 (p = 0.006), associated with positive regulation of transcription from RNA polymerase II promoter; GO 2000020 (p = 0.009), associated with positive regulation of male gonad development; GO 0000122 (p = 0.011), associated with negative regulation of transcription from RNA polymerase II promoter; GO 0003197 (p = 0.012), associated with endocardial cushion development; and GO 0045446 (p = 0.014), associated with endothelial cell differentiation (Fig. 7). Pathway enrichment analysis (KOBAS 3.0) of the genes in the MEbrown module showed that RECK and E2F1 were enriched in the miRNA in cancer pathway (p < 0.05), with no significant enrichment detected for the other genes. However, there was no significant pathway enrichment for genes in the MEturquiose module (Supplementary Material 13).
Selection and verification of hub genes
A total of 33 and nine genes in the MEbrown and MEturquiose module, respectively, showed a nodal degree > 3 and were thus selected as candidate hub genes. GEPIA analysis of these genes (log rank < 0.05 ) further identified C10orf91, LINC00303, DIRC3, DLG3-AS1, ARHGEF38-IT1, and CCNE1 as hub genes in MEturquoise, and RECK, MDGA1, CFL2, TGFBR3, and TPM2 as hub genes in MEBrown (Fig. 8). The transcriptional levels of these candidate hub genes were verified in The Human Protein Atlas database. There was no significant difference in the protein expression of MDGA1 between normal tissues and endometrial adenocarcinoma tumor tissues. Unfortunately, C10orf91, LinC00303, and DIRC3 are lncRNAs, DLG3-AS1 is an antisense gene, and ARHGEF38-IT1 is a sense-intronic lncRNA; therefore, there are no data related to their expression in the Human Protein Atlas (Fig. 9).
Genetic alteration of hub genes
After MDGA1 was removed, the remaining candidate hub genes (RECK, CFL2, TGFBR3, TPM2, and C10ORF91) affecting the survival rate of endometrial adenocarcinoma in the MEbrown module and MEturquoise module were selected. Based on the oncoPrint map in cBioportal, these 10 hub genes were found to be altered in 73 (31%) of 232 queried patient samples (Fig. 10b), with the greatest degree of alterations detected for CCNE1, RECK, CFL2, TGFBR3, TPM2, and LINC00303, detected in 11%, 7%, 6%, 7%, 6%, and 6% of the samples, respectively. The main types of alterations detected were missense mutation, amplification, and mRNA upregulation, although only amplification was found for LINC00303 alterations (Fig. 10a). Fig. 10c demonstrates the relationship of the 10 genes and the other 50 most frequently altered neighboring genes; however, only CFL2, CCNE1, and TPM2 had connections with these 50 genes. There was no known drug targeting these 10 hub genes, indicating promising targets of new cancer drugs. In the MEturquiose module, C10orf91, LINC00303, DIRC3, DLG3-AS1, and ARHGEF38-IT1 are all lncRNAs with no protein expression data available. The correlation analysis of the mRNAs RECK, CFL2, TGFBR3, TPM2, and CCNE1 in the GEPIA website demonstrated a significant negative correlation between CCNE1 and the other hub genes in the MEbrown module; the other hub genes in the MEbrown module were all significantly positively correlated with each other (Fig. 11).