3.1. Endostar enhanced NACT short-term treatment effects
In this study, the short term (2 years) efficacy of endostar+NACT was evaluated, complete response (CR), partial response (PR) and stable disease (SD) rates in the endostar group were 79.7,10.1% and 5.8%, respectively. While CR, PR and SD rates in NACT alone group were 52.1%,20.2% and 4.3%(3/69),separately.So chemotherapeutic response rates(RR) in endostar group and NACT group were 89.9% vs.72.4% respectively, there was obviously different between the 2 groups(Fisher's exact test;α<0.05,P=0.0155).The disease control rates (DCR) in endostar group and NACT group were 95.6% vs. 76.8%, respectively.There was obviously different between the 2 groups (Fisher's exact test,α<0.05,P=0.0001).This results indicated endostar increased chemotherapeutic agents effects in recent efficacy compared with chemotherapy alone,see Table 3.
3.2. Endostar enhanced NACT long-term efficacy
The patients were followed up from 38 to 57 months for long-term efficacy, the average time was 49.6 months (region: 38.3–67.3 months),overall survival(OS) rates were 87.0% vs.71.0% in endostar and NACT group, there was obviously different between 2 groups (Fisher's exact test,α<0.05,P=0.0215).These included 9 patients died in endostar group and 20 patients died in NACT group.
The 2-year progression free survival(PFS) rates in endostar group and NACT group were 97.1% and 84.1%.There was significantly between two groups(Fisher's exact test,P =0.0014,α<0.05).
The 2-year local relapse free rates in the two groups were 95.7% and 85.5% separately (Fisher's exact test,α<0.05,P=0.0329).These included 3 patients local relapse in endostar group and 10 patients local relapse in NACT group.
The 2-year distance metastasis free survival rates in the two groups were 100% and 92.8% separately (Fisher's exact test,α<0.05,P=0.0064),There was statistically significant between two groups. These included no patients distance metastasis in endostar group and 3 patients in NACT group, see Table 3.
The survival rates of patients were summed up in Fig.2. The results indicated that endostar+NACT obviously enhanced long-term effects than NACT alone.
3.3. Endostar reduced NACT toxicity
To assess chemotherapy adverse responses, Common Terminology Criteria Adverse Events Version 4.0 from National Cancer Institute (NCI) was adopted.The general adverse effects included myelosuppression,hair loss, gastrointestinal reactions, weightlessness, see Table 4.
In endostar group,the incidence of myelosuppression(such as leukocytopenia) in grades 0,1 and 2 were 55.0%,18.0%,and 27.0%,differently.In NACT group, the incidence of myelosuppressionin in grades 0, 1, 2, and 3 were 8%, 20.5%, 50.3%,and 21.2%,differently.There were statistical difference between 2 groups (Chi-square=63.16,P<0.0001,α<0.05).
In endostar group,the incidence of gastrointestinal reactions in grades 0,1,and 2 were 38.0%,49.0%,and 13.0%,separately.The incidence gastrointestinal reactions in grades 2,3 and 4 were 75.4%,17.5% and 7.1% in NACT group, differently. There was distinctly difference between 2 groups(Chi-square=32.08,P < 0.0001,α<0.05).
In the endostar group, the incidence of weight loss in grades 1 and 2 were 75.2%, and 24.8% separately.In the NACT alone group, the incidence weight loss in grades 0 and 1 were 89.8.%,10.2%,seperately.There was obviously difference between 2 groups (Chi-square=164.7, P < 0.0001,α<0.05).
In endostar group, the incidence of oral ulcer in grades 0, 1 were 78.0%, 22.0%,separately. In NACT group, the incidence of oral ulcer in grades 0, 1, 2 were 46.3%, 35.5% and 18.2%, seperately. The two groups had obviously difference (Chi-square=29.22,P<0.0001,α<0.05).
In endostar group,the incidence of hair loss in grades 0,1,and 2 were 45.0%,49.0%,and 6.0%,separately. In the NACT group, the incidence of hair loss in grades 0, 1, 2 were 23.5%, 56.4% and 21.1%, seperately.The two groups had obviously difference (Chi-square=15.92,P=0.0003,α<0.05).
In this study, dysfunction of vital organs was not found in all patients, so endostar may partly relieve NACT adverse reactions.
3.4. Endostar enhanced NACT tumor volume reduction effects
The change of tumor volume was monitored by MRI, it showed the tumor volume was 5.48±0.36 cm3 and 3.10±0.32cm3 (n1=69) before and after treatment in endostar group respectively.In contrast, the tumor volume was 5.39±0.45 cm3 and 4.51±0.25cm3 (n2=69) before and after treatment in NACT group.There was distinctly different between two groups after treatment(Unpaired t test, t=14.20,P<0.0001).The same result could be found from the maximum diameter basing on MRI mesurement.So it exhibited that tumor volumes and maximum diameters further declined in endostar group than NACT group, see Fig.3A,3B. As measured by tumor volume and maximum diameter changes,endostar enhanced the effects of NACT for cervical cancer patients.
3.5. The efficacy of endostar determined by DCE‑MRI
In this study,DCE-MRI was used to obtain cervical cancer perfusion and permeability status.
The receiver operating characteristic (ROC) determines the optimal cutoff value for DCE-MRI detection.The critical point has the shortest distance from the top left corner to the ROC curve.On this point the tangent line of the ROC curve intersects with the ROC curve, the sum of sensitivity and specificity value is the highest at the same time with the least sum of false positives and false negatives value.
ROC analysis for DCE-MRI parameters were carried out between endostar and NACT group before and after treatment. Before treatment, ROC analysis showed area under the curve values of Ktrans, Ve, and kep (Ktrans/ve) in endostar group were 0.35±0.02,0.56±0.03,0.59±0.08 separately. These results were regarded as baseline parameters.
One week after treatment,the area under the curve values for Ktrans,Ve,kep were 0.54±0.03(t=36.51,P<0.0001,n1=n2=69),0.82±0.04(t=36.03,P<0.0001),0.62±0.05(t=1.469,P=0.1452), separately,there were significant different before and after treatment for Ktrans and Ve value. There were no significant differences before and after treatment, see Fig. 4A, 5A.
When the cutoff of Ktrans value was 0.425(ml/min), the sensitivity, specificity were 81.25(95% CI: 54.35-95.95),93.75 (95% CI: 69.77- 99.84) separately, see Fig. 4B.
When the cutoff of Ve value was 0.525(ml/ml), the sensitivity, specificity were 87.5(95% CI: 61.65-98.45), 93.75 (95% CI: 69.65- 97.94) separately, see Fig. 5B.
When the cutoff of kep value was 0.325(ml/min),the sensitivity, specificity were 53.85(95% CI: 25.13-80.78), 84.62 (95%CI:54.55-98.08) respectively.
3.6. The efficacy of endostar evaluated by pathology
The efficancy for endostar+NACT treatment of cervical cancer stage within IIB was determined by tumor tissue pathologic changes.All the slides of excised specimens were reviewed and divided for following indexes.The cervical deep stromal invasion in the endostar and NACT group was 33.3% and 39.6% sparately.There was no obviously different between two groups(Fisher's exact test,α>0.05,P=0.3782).Similarly,there were not statistically different between two groups in the parameters of excision margin status,vaginal invasion,parametrial involvement(Fisher's exact test,α>0.05,see Table 5).The rates of tumor regression over two-thirds in endostar group and NACT group were 37.5% and 20.8% respectively, there was significantly different between two groups(Fisher's exact test,α<0.05 ,P=0.0128).Similarly,there were statistically different between two groups in the detection of lymphvascular space involvement,lymph node metastasis (Fisher's exact test,α<0.05,see Table 5).
Vascular maturation and cell proliferation
Before the treatment, CD31 staining rates were 85.54±6.32vs.83.36±7.63 in endostar group and NACT group respectively,there was no significantly different between two groups(Unpaired t test,t=1.503,P=0.1362,n1=n2=69).One week after treatment,CD31 staining rates in endostar group and NACT group were 45.43±4.35vs. 78.24±6.54,respectively,This confirmed microvessel density in endostar group were relatively reduced than that of NACT group.There was significant different between two group(Unpaired t test, t=34.70,P<0.0001,n1=n2=69).
α-SMA staining were 13.38±4.46 vs.15.45±5.37 before treatment. Seven day after treatment,α-SMA label were 37.35±5.34 vs.13.67±4.74 in endostar group and NACT group.There was dramatically different between two groups (Unpaired t test, t=27.90,P<0.0001,n1=n2=69). Before treatment,tumor pericyte density was at the same level,after treatment, pericyte rates obviously increased in endostar group.
Vascular maturity index (VMI, the ratio of α-SMA-stained vasculature to CD31-stained vasculature) in endostar group was 0.15±0.04 and 0.28±0.05 before and after treatment, separately. VMI was 0.18±0.05 and 0.19±0.06 in NACT group before and after treatment, There was significantly different between two groups after treatment (Unpaired t test, t=214.3,P<0.0001,n1=n2=69).So endostar made tumor vascular structure more maturely than NACT group.
Before the treatment, Ki67 positive staining exhibited the same proliferative level in endostar group and NACT group(42.5±3.3vs. 43.6±5.4,n1=n2=69),there was no significantly different between two groups(Unpaired t test,P=0.2315,t=1.204). Seven days after treatment, Ki67 positive staining rates in endostar group and NACT group were 23.32±4.25% vs. 35.36 ± 4.67 %, respectively, there were significant different between two groups (Unpaired t test, t=15.84,P<0.0001).This proved the tumor proliferative rates in endostar group were obviously reduced than NACT group,see Fig.6.
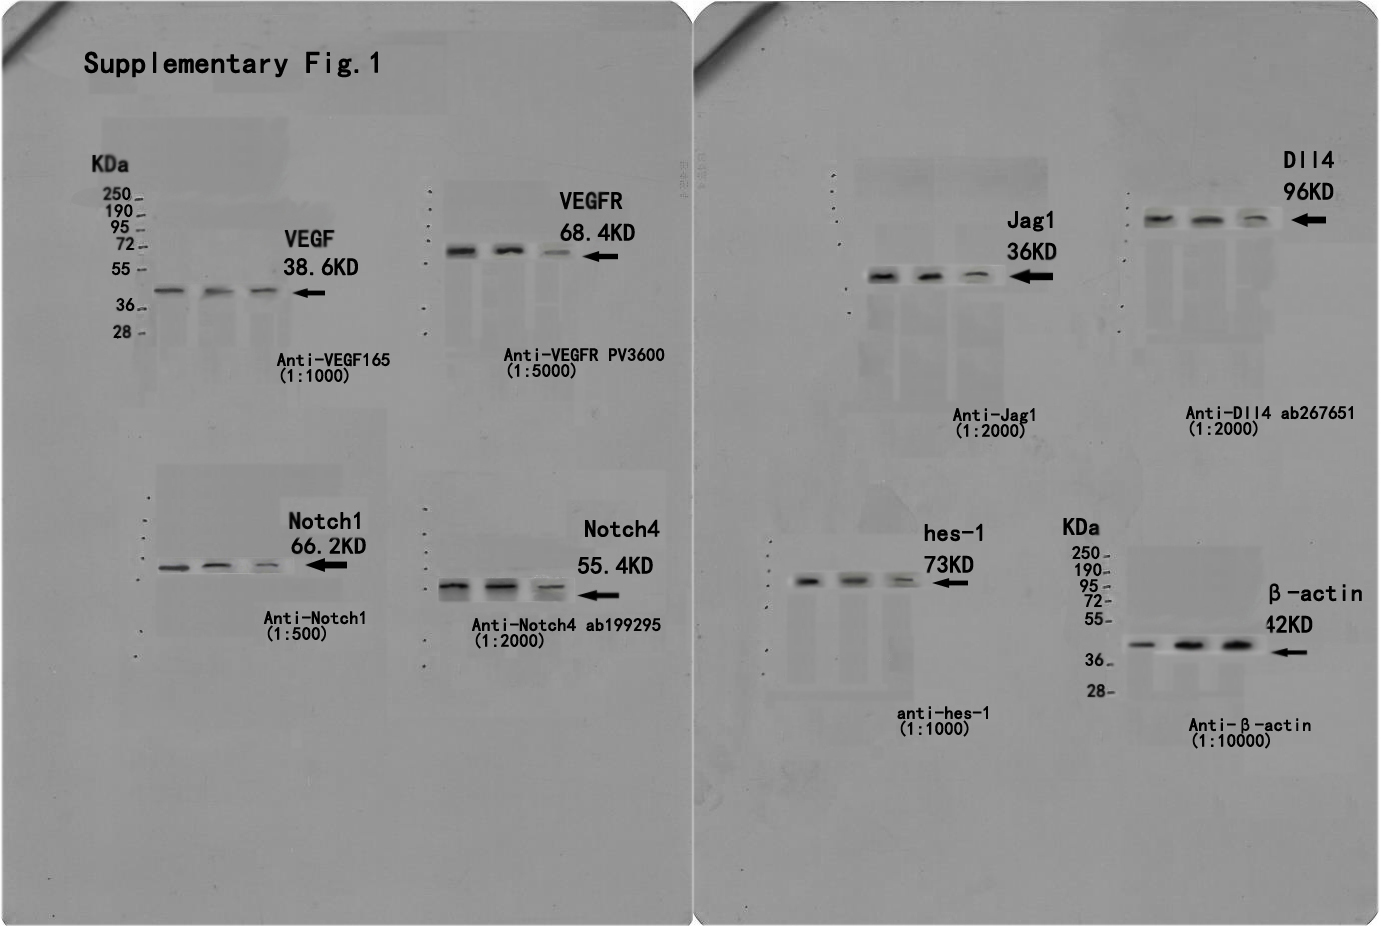
3.7 VEGF-Notch signal pathway detection
The genetic expression of VEGF-Notch signal pathway was analyzed by real-time PCR. The elements of these including VEGFR,Notch1,Notch1,4,Dll4,Jagged and hes-1 were obviously down regulated in endostar group except VEGF, comparing to NACT group.This was also confirmed from the protein expression of VEGFR,Jagged-1,Dll4,Notch1,4 and hes-1 by western blot analysis,this proved endostar blocked VEGF-Notch connection via interdicting VEGFR (P<0.01),see Fig.7.