Synthesis and structural analysis of F–Cu bionanozyme
Mixing of Cu2+ with F alkaline solution under mild heating conditions resulted in the formation of blue-colored F-Cu 2D plate-like crystals, which were analyzed using single-crystal X-ray crystallography. The coordination of Cu2+ with F, shown in Fig. 2, was octahedral with tetragonal distortion. Two F molecules complexed with one Cu2+ through an O (carboxylate), N (amine)-chelating modes, forming two five-membered phenylalanate-Cu2+ chelate rings (Fig. 2a). The two aromatic phenyl rings on either side of the chelating rings were in a trans conformation with respect to each other. These primary coordination spheres were further linked together by the second oxygen atom of the carboxylate groups of both F molecules and thus formed an infinite in-plane material strongly coordinated covalent 2D sheet along the crystallographic a and b-axis (Fig. 2b and 2c). Further, these atom-thin 2D sheets stacked into a layer by layer assembly held together through relatively weak interlayer van der Waals forces (Fig. 2d). To estimate the growth rate of F-Cu 2D layered crystals, we monitored an in-situ crystallization process using optical microscopy. Briefly, a quartz cuvette (10 mm) was filled with a freshly prepared alkaline solution of F and mixed with CuCl2 at a 2:1 molar ratio and immediately capped to prevent evaporation or concentration changes. The crystallization process inside the cuvette was monitored under a light microscope at two-second intervals (Supplementary Movie S1). In solution, small nucleation seeds appeared within a few seconds (∼28 sec) and laterally extended into large two-dimensional free-standing crystals. A selected single-crystal elongation growth was plotted as a function of time and indicated an estimated elongation rate of 0.5 nms− 1 at a linear regime (Fig. 2e, Supplementary Movie S2), revealing a spontaneous crystallization process. The corresponding snapshots of three consecutive images at different time points during the crystal growth are shown in Fig. 2e. These F-Cu crystals were further analyzed by high-resolution scanning electron microscopy (HRSEM) and atomic force microscopy (AFM). HRSEM micrographs showed laterally-extended rectangular 2D sheets with 10–500 µm lateral dimensions and layered hierarchy within each 2D crystal (Supplementary Fig S1). AFM topographical measurements showed 260 nm thick 2D crystals composed of several stacks of much thinner 10–20 nm nanolayers (Fig. 2g). Furthermore, owing to the week interlayer van der Waals interactions, the thicker sheets could be readily exfoliated into thinner 2D nanosheets with the assistance of external mechanical shear forces triggered by mild ultrasonication. The AFM topography images after ultrasonication treatment displayed ultrathin ∼1.8 nm nanosheets, each comprised of a small number of layers (Fig. 2i) inferred to be atomic monolayers based on the estimated thickness of ∼1.6 nm deduced from the X-ray crystal structure (Fig. 2d). In addition, the powder X-ray diffraction (PXRD) patterns of the F-Cu nanosheets and microcrystals were well-matched, revealing the intact nature of the highly crystalline 2D nanosheets (Fig. 2j). The UV-visible absorption spectrum of F-Cu nanosheets displayed a new broad 615 nm absorption band in the visible region assigned to the d-d transition specific to the Cu2+ complexes with tetragonal distortion owing to the Jahn–Teller effect (Supplementary Fig S2). The Fourier-transform infrared spectrum (FTIR) of F-Cu nanosheets showed a new broad metal-oxygen stretching band at 555 cm− 1 (νM−O) and a significant red shifted in (Δν = 125 cm− 1) amine absorption band, suggesting strong in-plane carboxylate- and amine-Cu2+ coordination modes (Supplementary Fig S2). Energy dispersive X-ray (EDX) spectral analysis confirmed the presence of the elemental composition of Cu atoms along with carbon (C) and oxygen (O) within the F-Cu nanosheets (Supplementary Fig S2). Thermal gravimetric experiments exhibited relatively high thermal stability of the F-Cu nanosheets with two decomposition temperatures at 273 °C (68.8%) and 332 °C (14.3%) (Supplementary Fig S2).
Evaluation of the catalytic performance of F-Cu bionanozymes
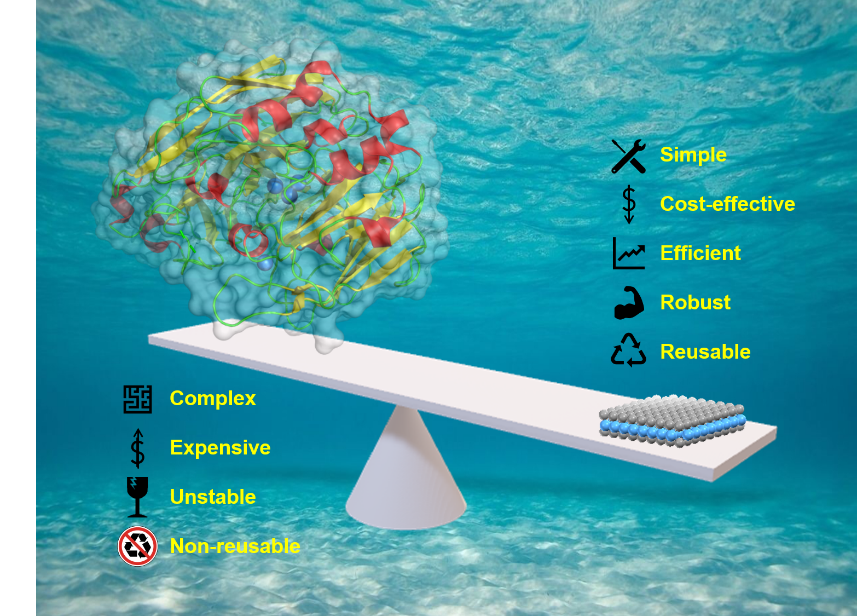
2D layered nanomaterials have long been shown to be excellent materials of choice in the field of catalysis due to their unique structural and electronic properties originating from their ultrathin morphology and large surface area37. Therefore, the F-Cu crystals not only possess the advantages of easier and more rapid synthesis compared to natural enzymes, but also meet the prerequisites for an efficient catalytic system, an ultra-thin nanolayered structure accompanied by ample catalytically active redox sites, making them promising bionanozymes. Hence, the intrinsic catalytic activity of F-Cu nanosheets as mimicking laccase function was first evaluated by performing the benchmarked oxidation reaction of 2,4-dichlorophenol (2,4-DP) together with 4-aminoantipyrine (4-AP)38. Here, 2,4-DP is the real substrate, and the radical product of its F-Cu bionanozyme- or laccase- catalyzed oxidation reacts with 4-AP to generate a red-colored antipyrilquinoneimine dye with characteristic broad absorbance centered at 510 nm (Fig. 3a and 3b). The 2,4-DP and 4-AP reaction mixture in the absence of a catalyst did not show any significant coloration and product absorption peak. F-Cu nanosheets generated a more intensely colored product and corresponding 510 nm absorption band compared to laccase (Fig 3b, Supplementary Movie S4) at the same weight percent (0.1 mg/mL), suggesting that F-Cu possesses an outstanding laccase-mimicking catalytic activity. Further, the dependence of the initial rate of the reaction on substrate concentration for F-Cu was consistent with its enhanced activity compared to the laccase enzyme (Fig. 3c). The typical Michaelis–Menten model fitting corroborated the enzyme-like catalytic characteristics of F–Cu nanosheets, with maximum initial velocity (Vmax) = 6 ´ 10-5 mMs-1, Michaelis−Menten constant (Km) = 0.19 mM and catalytic efficiency (kcat/Km) = 0.2 M-1s-1, while laccase displayed Vmax= 3 ´ 10-6 mMs-1, Km = 0.06 mM and kcat/Km= 0.02 M-1s-1. Moreover, F-Cu utilizes a single amino acid (F), making this system much less complex than the laccase enzyme comprising a primary sequence of several hundred amino acid. Hence, in terms of molecular mass, F-Cu is the smallest known laccase mimicking bionanozyme and exhibits three orders (kcat/KM = 5 ´ 10−4 (g l–1)−1 s−1) of greater catalytic efficiency than the native laccase enzyme (kcat/KM = 2.5 ´ 10−7 (g l–1)−1 s−1) (Table 1). To further confirm the role of the F-Cu bionanozyme, control experiments were carried out using all possible combinations of catalyst building blocks. As shown in Fig. 3d, apart from F-Cu, all other combinations did not show any significant catalytic activity, except for Cu2+ alone which produced a light color product with only 16% activity relative to F-Cu. These results indicate that the catalytic activity indeed depends on the F-Cu nanosheets rather than any non-assembled free F and Cu2+ ionic species. To better understand the chemical catalysis mechanism, copper complexes of three different amino acids (basic amino acid glycine (G-Cu) and the amino acids present at the laccase active center: histidine (H-Cu) and cysteine (C-Cu)) were synthesized, and their catalytic activities were compared to that of the F-Cu bionanozyme (Fig. 3e). Among these, the F-Cu nanozyme displayed the highest activity (100%), followed by G-Cu (25%), H-Cu (19%), Cu2+ ions (16%) and C-Cu (1.5%). Next, we replaced the divalent copper ions with zinc ions (Zn2+) by preparing an F-Zn complex and tested its catalytic activity. However, F-Zn showed a negligible activity (1.4%, Fig. 3e), emphasizing the crucial role of Cu2+ in this reaction, similar to natural laccases. Therefore, the interaction between Cu2+ and F to form a highly crystalline 2D layered nanostructure is required for the catalytic activity, while the carboxylate and amine functional groups in the amino acid skeleton support the coordination sites without contributing much to catalysis.
Table 1. Kinetic parameters of F-Cu bionanozyme and laccase enzyme for oxidizing 2,4-DP at 25 °C.
|
Catalyst
|
#AA
|
M.Wt (Da)
|
kcat/Km (M-1s-1) ´10-1
|
kcat/Km ((g l-1)−1 s−1) ´10-5
|
|
F-Cu
|
1
|
392
|
2
|
50
|
|
Laccase
|
~ 521
|
~ 80,000
|
0.2
|
0.02
|
#AA = number of amino acids, M.Wt = molecular weight.
Many oxidases, such as glucose oxidase, accelerate a similar phenol oxidation reaction via catalytic reduction of O2 to H2O2. In contrast, laccase directly reduces molecular oxygen to water without any production or requirement of H2O2. To test whether H2O2 was generated during the reaction catalyzed by the F-Cu bionanozyme, a reaction mixture of 2,4-DP and F-Cu (4-AP was omitted to avoid interference of red color) was centrifuged (Fig. 3f). 2,2'-azino-bis(3-ethylbenzothiazoline-6-sulfonic acid (ABTS) and horseradish peroxidase (HRP) were added to the supernatant, yet no variation of color or absorption was observed (inset of Fig. 3f), indicating the absence of H2O2. However, under similar conditions, the addition of H2O2 resulted in a green color solution with intense absorbance at 415 nm, characteristic of ABTS oxidized product. These results further confirm that the F-Cu bionanozyme is indeed a laccase mimic rather than any other oxidase that generates an H2O2 byproduct. Since the laccase activity depends on molecular oxygen, we further tested the oxygen dependency of the F-Cu catalytic activity by conducting the reaction in the presence (open to air) and absence (nitrogen gas bubbled solution) of an oxygen-containing environment (Supplementary Fig S5). Interestingly, the catalytic reaction rate in the presence of atmospheric oxygen was 2.5-fold higher than in the absence of oxygen. This confirms the oxygen dependency of F-Cu catalyzed oxidation of phenols, similar to the natural laccase enzyme. The oxidation state of Cu2+within the F-Cu bionanozyme during the reaction was probed through electron paramagnetic resonance (EPR) spectroscopy (Supplementary Fig S5). The F-Cu bionanozyme alone displayed an intense EPR signal at 3291 G characteristic of Cu2+. However, the addition of 2,4-DP to the F-Cu reaction mixture resulted in diminished EPR signal, suggesting that the reduction of Cu2+ to Cu1+ took place, in line with the anticipated laccase mimicking redox catalytic mechanism. To visualize the progress of the F-Cu bionanozyme catalytic oxidation of 2,4-DP, in-situ microscopy (Supplementary Movie S3) experiments were performed for 1 h at 15-sec intervals (Fig. 3g). The colorless reaction mixture turned into a strong red color on the surface of the 2D F-Cu crystals without affecting their morphology, providing further evidence of the catalytic function of the F-Cu 2D crystals.
Catalytic stability, recyclability and substrate universality of F-Cu bionanozymes
To demonstrate its practical utility, we investigated the relative stability of the F-Cu bionanozyme compared to laccase in various extreme experimental conditions including pH, ionic strength, storage time and temperature. Specifically, the catalytic assay was performed in PBS buffer (1X, 25 °C) at different pH values ranging from pH 3.0 to 9.0. As shown in Fig. 4a, laccase lost its catalytic activity after incubation in a strongly acidic pH 3.0 (5%) and basic pH 9.0 (48%), while the F-Cu bionanozyme maintained at least 60% of its catalytic activity at pH 3.0 and gradually increased at pH 4.0-9.0 (65%–120%). The influence of ionic strength on catalytic activity was tested at different NaCl concentrations ([NaCl] = 0 to 600 mM). The increase of ionic strength induced a drastic decrease in laccase activity (from 100% to 1.4%) due to the salting-out effect and chloride ion inactivation (Fig. 4b). In contrast, F-Cu showed a gradually increasing activity (100% to 360%) with elevated NaCl concentration. This result prompted us to test the catalysis in actual water samples including tap water, river water, and seawater (Supplementary Fig S4). F-Cu and laccase showed similar relative activity in both tap and river water. However, in seawater, laccase completely lost its activity, while F-Cu retains 76% of its catalytic activity. Therefore, the F-Cu bionanozyme is robust enough for on-field phenol oxidation in water samples highly relevant for public health. Next, the storage stability was estimated by loading the catalyst in PBS buffer (1X, pH 7.4) at 25 °C and assayed every 5 days for one month. As shown in Fig. 4c, laccase relative activity was gradually decreased over storage time and became completely inactive on the 10th day. However, the F-Cu bionanozyme retained almost 90% of activity after 30 days of storage, as well as remained 95% active after 210 days of storage in air at room temperature, indicating the excellent stability of the F-Cu bionanozyme during storage either in water or in air. Further, thermal stability was evaluated by incubating F-Cu and laccase at different temperatures ranging from 273 K to 373 K for 1 hour followed by a catalytic activity assay at room temperature (Fig. 4d). Due to thermal denaturation, the relative activity of laccase decreased gradually and was completely lost at 330 K. On the other hand, F-Cu bionanozymes exhibited good thermal stability by retaining 92% activity even the following incubation at 373 K. To demonstrate the recyclability of the F-Cu bionanozymes, both 2,4-DP and 4-AP were mixed with F-Cu in PBS buffer (1X, at 25 °C) for each cycle. After each reaction cycle, the F-Cu bionanozyme was collected by centrifugation, washed with double distilled water and re-used for the next reaction cycle (Fig. 4e).
Remarkably, the F-Cu bionanozyme retained more than 80% of its relative activity even after fifteen cycles, while laccase is unable to be recycled. These results suggest that compared to natural laccase, the F-Cu bionanozyme shows higher catalytic stability and recyclability. To assess the substrate universality, F-Cu and laccase were mixed with various toxic phenolic contaminants and the catalytic oxidation activity was assayed (Fig. 4f). Interestingly, the F-Cu bionanozyme could not only catalyze the oxidation of all phenolic contaminants tested, but also showed higher catalytic activities compared to laccase, demonstrating the favorable substrate universality of the F-Cu bionanozyme. Importantly, F-Cu showed a higher conversion rate of chlorophenols (2,4-DP and 2,4,6-trichlorophenol) which are listed by the U. S. Environmental Protection Agency (EPA) as priority environmental pollutants 39.
Reaction pathway for F–Cu catalytic oxidative coupling of phenolic pollutants
To understand the energetics of phenoxyl radical formation, we carried out first-principle spin-polarized density functional theory calculations on a cluster model of F-Cu comprised of four Cu(F)2 units as shown in Fig. 5a (left). Our cluster model resembles an edge of the F-Cu crystal (100) surface. To obtain the energetics of the entire reaction, we added one oxygen, two water, and two phenol molecules to this tetramer model of F-Cu. Furthermore, to mimic periodic crystal effects, we fixed the positions of two of the four Cu(F)2 units (located on the right side of the tetramer, represented with both sticks and transparent beads).
The entire reaction starts with a phenol molecule approaching the active copper site (step 1). In this step, the spin-density is primarily located near the four copper sites (see S1 in Fig. 5b) and on the oxygen molecule. Next, there is a transfer of a hydrogen atom from the phenol molecule to one of the COO groups of the F moiety (step 2), with an energy barrier of ~ 29 kcal/mol. Step 2 is ~ 22 kcal/mol higher in energy than step 1, and due to the transfer of a hydrogen atom from the phenol, a phenoxyl radical is formed in this step. We confirmed the formation of a phenoxyl radical through spin-density plots (Fig. 5b), where we observed an accumulation of spin-density on the phenyl moiety of the phenol in step 2, which was absent in step 1. In the next step, the hydrogen atom is further transferred from the COO group to the oxygen molecule, with an energy barrier of ~ 9.5 kcal/mol. In the experimental studies, molecular oxygen is readily available in the solvent (water) as dissolved oxygen. Until step 3, the reaction is energetically uphill; however, once this phenoxyl radical diffuses from the active copper site, it interacts with other phenoxyl radicals forming the respective polymers, resulting in an overall exothermic reaction. To simulate this downhill process, we studied the formation of a dimer (2,2′-biphenol) from two phenols. To reduce the computational burden associated with the simulation of this large system, we assumed that both phenols interact with the adjacent copper sites.
In step 4, we observed the formation of two phenoxyl radicals on the adjacent copper sites, where the oxygen molecule receives the protons from both phenols. The spin-density plots confirm the radical nature of the phenoxyl moieties. It is interesting to note that this configuration containing two phenoxyl radicals on adjacent copper sites is only slightly higher in energy (~ 2 kcal/mol) compared to step 3. Finally, the two radicals combine with each other to form the polymerized product that is ~ 55 kcal/mol lower in energy compared to step 3 or step 4.
Detection of catecholamine neurotransmitter using the F-Cu bionanozyme
To further broaden the scope of the F-Cu bionanozyme, we examined the catalytic oxidation of catecholamines, biologically important phenolic neurotransmitters (dopamine (DA), epinephrine (EP), norepinephrine (NE) and L-DOPA (LD)). Catecholamines play a vital role in various functions of the cardiovascular, nervous, and endocrine systems40. Therefore, any disruption in their concentration levels may induce diverse diseases including Parkinson's disease, schizophrenia, and even tumors such as paraganglioma and pheochromocytoma. On the other hand, catecholamines are extensively used as drugs for emergency heart disease, anaphylactic shock, and bronchial asthma. Hence, the detection and quantitative analysis of catecholamines are essential for disease diagnosis and pharmaceutical assessments. Interestingly, simple mixing of F-Cu or laccase with EP resulted in gradual color change in the solution from colorless to intense red, indicating the formation of an oxidized product (Fig. 6a). This was further evident from the appearance of a new absorption band centered at 485 nm, characteristic of an adrenochrome product (Fig. 6b). In contrast, in the absence of a catalyst (F-Cu or laccase), EP did not produce a significant color change. The F-Cu bionanozyme catalyzed product absorption, and solution coloration was much higher those observed for laccase. The catalytic course of F-Cu and laccase monitored at 485 nm over 30 min is shown in Fig. 6c. Remarkably, in the first 10 min, the reaction kinetics with the F-Cu bionanozyme is 20-fold faster than that of laccase. Furthermore, the calculated kinetics parameter Vmax of the F-Cu bionanozyme is approximately ∼43-fold higher than that of laccase. The catalytic colored oxidized product might be used as a method for the detection and quantification of EP. To test this option, we monitored the absorbance of the product at 485 nm as a function of EP concentration in the presence of the same mass concentration (0.1 mg/mL) of the F-Cu bionanozyme and laccase (Fig. 6d and 6e). Both F-Cu and laccase displayed a linear relationship between the product absorbance and the concentration of EP between 20 mM to 100 mM. The obtained limit of detection (LOD) of EP is 150 nM in the presence of the F-Cu bionanozyme, compared to 5 mM in the presence of laccase. Accordingly, F-Cu is approximately 36-fold more sensitive than laccase. Therefore, the method utilizing the F-Cu bionanozyme is much more simple, ultrasensitive, and allows the same conversion rate via an approximately ∼5400 fold more cost-effective reaction compared to the natural enzyme laccase. Next, we analyzed the catalytic oxidation of other catecholamines (DA, NE and LD) in the presence of the F-Cu bionanozyme and laccase. As shown in Fig. 6f, the F-Cu bionanozyme could catalyze the oxidation of all types of catecholamine molecules more effectively than laccase. Therefore, based on the F-Cu bionanozyme catalytic oxidation reactions, a rapid, economical, and ultrasensitive methodology has been developed for the colorimetric determination of catecholamine neurotransmitters.