Clinical characteristics of 117 HBV-related HCC patients
As shown in Table 1, the median age of patients was 55 years old (ranging from 31–79 years), and 102 (87%) patients were male. In this cohort, tumor size was smaller than 3cm in 30 (26%) patients, 3-5 cm in 50 (42%) patients, and larger than 5cm in 37 (32%) patients. Microvascular invasion (MVI) was observed in 74 (63%) patients. There were 61 (52%), 44 (38%) and 12 (10%) patients with AJCC stage I, stage II and stage III diseases, respectively, while 98 (84%) and 19 (16%) of the patients with Barcelona Clinic Liver Cancer stage (BCLC) 0-A and B-C. The liver function in nearly all the patients (n=112, 96%) was distributed at Child-Pugh Class (CTP class) A. Follow-up information was obtained from 115 patients with a median follow-up time of 32 months (ranging from 1 to 45 months). During the follow-up period, 33 patients died of HCC and 66 patients developed recurrence.
Multiple-level CNV analysis of cfDNA
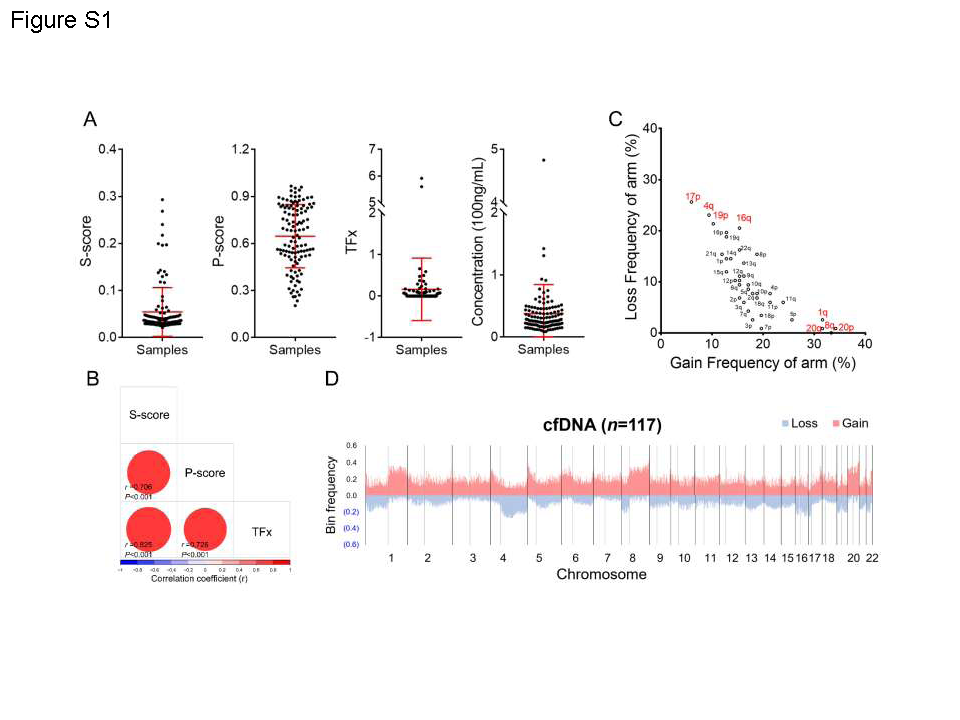
Whole-genome sequencing was carried out at a mean depth of 4.01× (range, 2.78 to 7.86) for plasma cfDNA samples and 29.51× (range, 18.42 to 49.23) for tissue DNA samples. The sequencing data information was summarized in Table S1, showing good sequencing quality. The ichorCNA was used for subsequent CNV analysis. TFx, P-score and S-score were calculated based on genome-wide cfDNA CNVs. The different distribution of TFx, P-score, S-score and cfDNA concentration was shown in Fig. S1A. Significant positive correlation was observed among TFx, P-score and S-score. The top 4 most frequent gains of 20p, 8q, 1q, 20q and the top 4 most frequent losses of 17p, 4q, 19p and 16q were identified in 117 HBV-HCC patients (Fig. S1C). Furthermore, significant negative correlation was found between gain and loss frequencies (Pearson r=-0.804, P<0.001, Fig. S1C), indicating that CNVs at chromosomal-arm level preferred to gain or loss, but rarely both. In addition, the bin-level CNVs were obtained from ichorCNA and the bin frequencies altered across genome among HBV-HCC patients were exhibited in Fig. S1D.
Concordant profile of CNVs was observed between cfDNA and tumor tissue DNA
To estimate the concordance between cfDNA and tissue DNA, the frequency of CNVs at bin level or chromosomal-arm level was analyzed among the cfDNA, tissue DNA in our cohort and tissue DNA from The Cancer Genome Atlas (TCGA) database. Similar patterns of CNVs at both bin and chromosomal-arm level were observed between cfDNA and tissue DNA (Fig. 2A and 2C). Moreover, our data indicated that the frequency of CNVs at bin level in cfDNA was significantly correlated with that in matched tumor tissue DNA (Gain: r=0.649, P<0.001; Loss: r=0.856, P<0.001. n=19; Fig. 2B). When analyzed at chromosomal-arm level, the frequency of CNVs in cfDNA was also significantly correlated with that in matched tumor tissue DNA (Gain: r=0.779, P<0.001; Loss: r=0.912, P<0.001. Fig. 2D). In addition, the CNV frequency in TCGA tissue DNA were significantly correlated with the CNV frequency in both tissue DNA (Gain: r=0.739; P<0.001, Loss: r=0.692; P<0.001. Fig. 2D) and cfDNA (Gain: r=0.718; P<0.001, Loss: r=0.666; P<0.001. Fig. 2D) in our cohort. Overall, our data indicated the concordant profile of CNVs between cfDNA and tissue DNA, suggesting the possibility of cfDNA as a biopsy surrogate in HCC related clinical practices.
Association of cfDNA CNVs with clinical characteristics in HCC patients.
The association of demographic and clinical characteristics with CNVs detected at different levels and concentration of cfDNA was presented in Table 1 and Table S2-5, respectively. Patients were categorized into two groups by the cut-off values of TFx, P-score, S-score and cfDNA concentration determined by maximizing Youden index (Table 1). The results indicated that patients with high TFx, P-score and S-score exhibited a significantly higher proportion at late stage (stage III) and with large tumor size (≥ 5cm) than those with low TFx, P-score and S-score, respectively (All P<0.05). In addition, an obvious trend was observed that TFx, P-score and S-score were associated with MVI and BCLC stage, although only P-score attained statistical significance (P<0.05). Importantly, patients with high TFx, P-score and S-score exhibited a significantly higher recurrence and death risk than those with low TFx, P-score and S-score, respectively (All P<0.05). The similar results were observed in patients with gains of 20p, 8q, 1q and 20q (Table S2), losses of 17p, 4q, 19p and 16q (Table S3), high bin-score (Table S4) and high cfDNA concentration (Table S5).
Genome-wide indicators of cfDNA CNVs were significantly associated with prognosis of HCC patients receiving radical treatments.
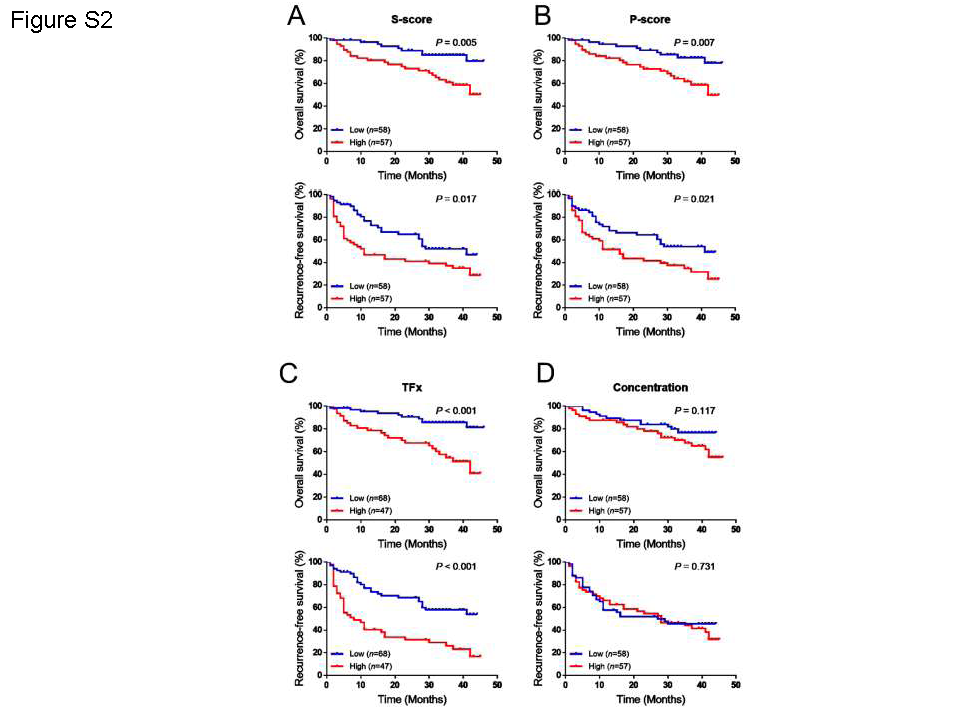
As shown in Table S6, the univariable Cox regression analysis indicated that BCLC stage, AJCC stage and tumor size were associated with overall survival (OS) and recurrence free survival (RFS) of HCC patients receiving radical treatment, which is greatly consistent with previous reports(23). Furthermore, HCC patients were respectively stratified by cut-off value of three genome-wide CNV indicators determined by maximizing Youden index. Kaplan-Meier analysis showed that the patients with high TFx, P-score, S-score and cfDNA concentration exhibited a significantly poorer OS and RFS than those with low TFx, P-score, S-score and cfDNA concentration, respectively (All P<0.05. Fig.3). Similar results were observed when median value of TFx, P-score and S-score was used as cut-off values (All P<0.05. Fig. S2A, S2B and S2C). However, no significant difference was observed between patients with high and low cfDNA concentration in OS (P=0.117) and RFS (P=0.731. Fig. S2D) when median value was used as the cut-off for stratification. After adjusting for gender, age, BCLC stage, MVI and AFP, the multivariable Cox proportional hazard regression analysis indicated that the three genome-wide CNV indicators were significantly associated with death risk of HCC patients receiving radical treatments, with HR of 4.02 (95% CI, 1.87–8.64), 3.70(95% CI, 1.67–8.17), 3.72 (95% CI, 1.70–8.14) and 3.95 (95 % CI, 1.89-8.27) for S-score, P-score, TFx and cfDNA concentration, respectively (Table 2). The similar results were observed in the associations of the cfDNA indicators with recurrence risk, with HR of 2.55(95% CI, 1.52–4.30), 2.06(95% CI, 1.21–3.51), 2.78 (95% CI, 1.64–4.70) and 1.97 (95 % CI, 1.08-3.59) for S-score, P-score, TFx and cfDNA concentration, respectively (Table 2).
Furthermore, the receiver operating characteristic (ROC) curves were used to characterize the discrimination potential of TFx, P-score, S-score, cfDNA concentration, MVI and BCLC stage for 3-year survival or 1-year survival. The results showed that the TFx, S-score and P-score had similar areas under the ROC curve (AUCs) and exhibited a slightly better performance than cfDNA concentration, BCLC and MVI, no matter of 3-year survival or 1-year survival (Fig. 3). It should be noted that the ROC curves of the concentration lay across the diagonal line, which may be due to an unstable estimation using concentration.
High frequency cfDNA CNVs at chromosomal-arm level predicted prognosis of HCC patients.
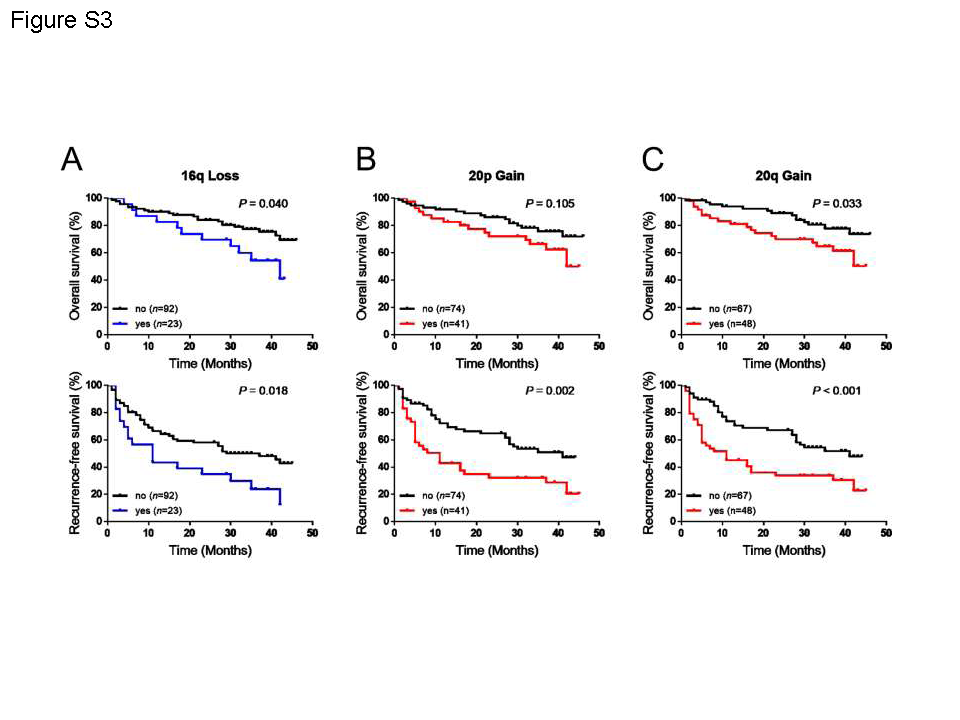
To evaluate the prognostic value of cfDNA CNVs at chromosomal-arm level in HCC patients receiving radical treatments, the top 4 most frequent gains or loss were used. The Kaplan-Meier survival analysis (Fig. 5 and Fig. S3) showed that patients with loss of 4q, 17p, 19p 16q and the gain of 8q, 1q, 20q exhibited significantly poorer OS and RFS than those without corresponding chromosomal-arm loss and gain, respectively (All P<0.05). Moreover, 20p gain was only related to recurrence (P=0.002) but not death (P=0.105). Univariable Cox regression analysis also indicated the gain or loss of these chromosomal arms was significantly associated with OS and RFS in HCC patients (Table S6). Multivariate Cox regression analysis showed that loss of 4q, 17p, 19p and the gain of 8q, 1q were independent prognostic factors for OS and RFS. The HR of death were 3.55 (95%CI, 1.66-7.56), 4.31 (95%CI 2.02-9.20), 3.49 (95%CI 1.59-7.68) for loss of 4q, 17p, 19p and 3.20(95%CI 1.49-6.87), 2.55(95%CI 1.16-5.59) for gain of 8q, 1q, respectively (Table 3). The HR of recurrence were 1.81 (95%CI, 1.04-3.14), 2.74(95%CI 1.59-4.73), 3.27 (95%CI 1.82-5.85) for loss of 4q, 17p, 19p, and 2.49 (95%CI 1.44-4.31), 1.84 (95%CI 1.05-3.21) for gain of 8q, 1q, respectively (Table 3). The 20p gain and 20q gain were only observed to be associated with recurrence risk, with HR of 1.76 (95%CI 1.03-3.01) and 1.96 (95%CI 1.13-3.39), respectively (All P<0.05. Table 3). ROC curve analysis showed that these gain and loss at chromosomal-arm level showed similar AUCs either for 3-year survival or 1-year survival, with a slightly better performance for 1-year survival (Fig.6). These results suggest that high frequency cfDNA CNVs at chromosomal-arm level may be used as prognostic biomarkers for HCC patients.
A bin-level risk score improved the ability of CNVs in predicting prognosis
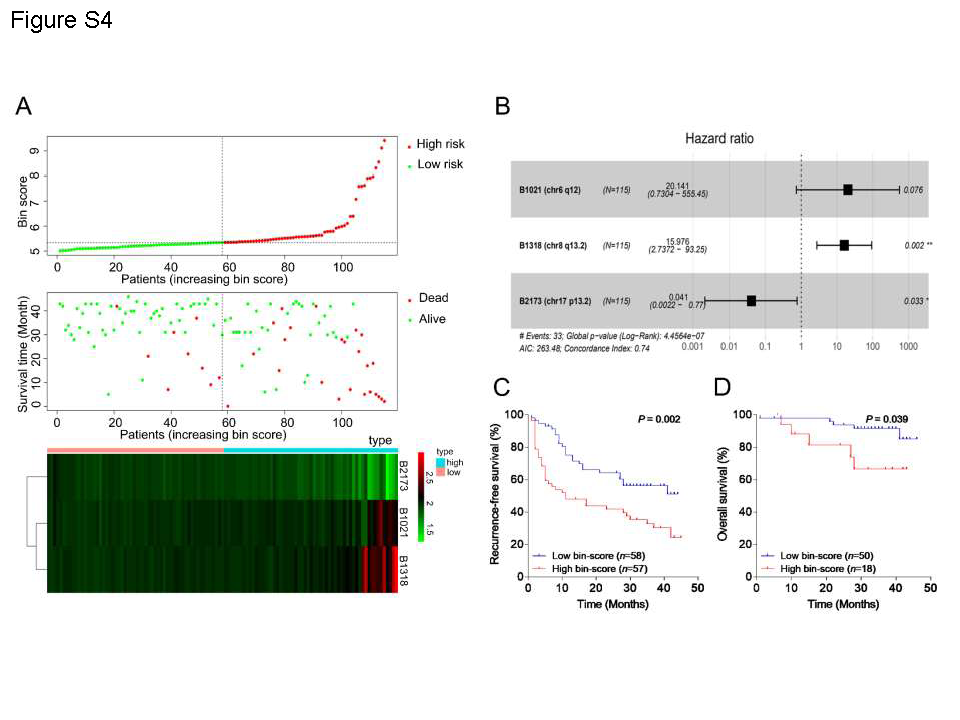
To investigate the prognostic value of cfDNA CNVs at bin (1M) level in HCC patients, 1406 prognosis-associated candidate bins were selected from a total of 2475 bins by a univariable Cox regression analysis for further screening based on LASSO model and multivariable Cox regression model. Finally, three bins were chosen to construct the bin-level risk score (simplified as bin-score) according to the coefficients from the multivariable Cox regression analysis (Fig. 7A, 7B and Fig. S4B). The distribution of patients with the low and high bin-score, survival status of patients, and heat map of CNVs of the three hub bins were shown in Fig. S4A. Two of three bins were located on the chr8q (gain) and chr17q (loss), respectively. Another one was located at chr6q12, which could be found in TCGA copy number dataset from cBioPortal (Fig. S4B). When HCC patients were stratified into two groups by the median value of bin-score, the results showed that patients with high bin-score had a significantly poorer OS than those with low bin-score (log rank P<0.001. Fig. 7C). Similarly, the patients with high bin-score were more likely to suffer recurrence than those with low bin-score (P=0.002. Fig. S4C). The multivariable Cox regression analysis confirmed that the bin-score was a prognosis biomarker independent of gender, age, BCLC stage, MVI and AFP (OS: P<0.001, HR=1.09, 95%CI, 1.04-1.15; RFS: P=0.004, HR=2.16, 95%CI, 1.26-3.70. Table S7). The AUCs of bin-score in predicting 1-year and 3-year survival were 0.8202 and 0.7457, respectively (Fig. 7D), which was superior to the genome-wide cfDNA CNV indicators, high frequency cfDNA CNVs at chromosomal-arm level, BCLC stage and MVI. Furthermore, the bin-score could also predict the prognosis in the patients whose TFx value was zero (Fig. S4D). These findings suggest that the prediction ability of cfDNA CNVs for HCC prognosis may be improved by screening the most relevant CNV regions.

