Identification and characterization of XTHs
A total of 53 and 38 XTH genes were confirmed in B. rapa and B. oleracea genomes, respectively (Table 1). These genes were designated corresponding to their orthologs of XTH genes in Arabidopsis (AtXTH) (Table 1). The last lowercase letter in the name was “a'' meaning the highest homology with Arabidopsis, next by “b'', and so on. And the capital letter A or C in the name of B. rapa and B. oleracea represent the genomes Ar and Co, respectively.
Orthologous genes of AtXTH1, AtXTH2, AtXTH6, AtXTH10, AtXTH14, AtXTH18 and AtXTH19 were not found in B. oleracea genome, while orthologous genes of AtXTH1, AtXTH3, AtXTH19 and AtXTH20 were not found in B. rapa genome. It means that the loss rate of XTH genes is lager in B. oleracea than in B. rapa.
The length of BraXTHs ranged from 212 (BraA.XTH24.c) to 473(BraA.XTH3) amino acids, with the molecular weights varing between 24.37 kDa to 55.10 kDa, while, the length of BolXTHs ranged from 163 (BolC.XTH29.b) to 346 (BolC.XTH27.a) amino acids with the molecular weights varing between 18.67 kDa to 39.87 kDa.
In addition, theoretical PI values of XTHs were ranging from 5.06 to 9.58 in B. rapa and 4.96-9.75 in B. oleracea due to the complexity of the polarity of amino acids. The intron number of XTH genes was relatively analogous, 86.8% of BraXTH genes and 89.5% of BolXTH genes had 2-3 introns, of which 24 BraXTHs and 19 BolXTHs had 3 introns, 22 BraXTHs and 15 BolXTHs had 2 introns. BraA.XTH3 had the most introns (7), while BolC.XTH29.b lacked introns.
The Plant-mPLoc was used to predict the subcellular location of BraXTH and BolXTH proteins. The result showed that all XTH proteins were located on the cell wall. In addition to the cell wall, 20 BraXTHs and 12 BolXTHs were also predicted to localize on cytoplasm. BraA.XTH3 was more special, located in both the cell wall and endoplasmic reticulum. The signal peptide prediction results indicated that 46 BraXTHs and 33 BolXTHs had signal peptides.
Phylogenetic Analysis of XTH Proteins
In order to investigate the evolutionary relationship between different XTH gene family members, we used the full-length XTH protein sequences of B. rapa, B.oleracea and A. thaliana to generate a phylogenetic tree based on Maximum Likelihood method and used the structurally characterized bacterial lichenase (1GBG, EC 3.2.1.73) as an outgroup(Fig. 1). Three groups (Ancestral group, GroupI/II and Group III) were identified based on clade support values, the topology of the phylogenetic tree, and the previous classification of XTH families in Arabidopsis [3]. The ancestral group close to the root was the smallest group containing 12 members. There were 11 XTHs in Group IIIA and 20 XTHs in Group IIIB. The rest XTHs belong to GroupI/II, including 22 AtXTHs, 35 BraXTHs and 23 BolXTHs. As Fig.1 shown that XTHs of B. rapa and B. oleracea were clustered with their homologous proteins in A. thaliana. There were 41 sister pairs at the terminal of phylogenetic tree branches with closer relatives and 30 out of them were orthologous pairs between B. rapa genome and B. oleracea genome.
Structure of XTH genes and the Pattern of the Motif in XTH proteins
To better characterize the structural conservation and diversification of XTH genes during their evolution, the exon-intron organization of individual XTH gene in coding sequence was obtained according to Group membership. Each XTH protein of the two species had a Glyco_hydro_16 domain and an XET_C domain. As shown in Fig.2 and Fig.3, the Glyco_hydro_16 domain covered the motif 6-4-3-1-2-8 in series while some proteins lacked one or several motifs out of these motifs. XET_ C domain mainly covered motif 5-9 tandem. Fifteen BraXTHs and 10 BolXTHs shared motif 10 additionally, forming motif 10-5-9 tandem. Six BraXTHs and 7 BolXTHs replaced motif 9 with motif 7, forming a new tandem motifs pattern (motif 5-7 tandem). In total, motifs had a similar distribution within the same group.
In addition to XTH26, all genes of Group I contained 1-2 introns. Apart from XTH8, all genes of Group II contained 3 introns. All Group III genes in the two species had 3 introns except BolC.XTH29.a and BolC.XTH29.b. Generally, the motif patterns between different XTH proteins had only a little difference, and the genes divided into the same group showed similar gene structure patterns.
Chromosomal Distribution and Duplication analysis of XTH Genes
The chromosomal location of all XTH genes in the both Brassica species was investigated based on the physical position of whole genes and was shown in Fig. 4. Excluding BraA.XTH10 positioned on a scaffold, the rest fifty-two BraXTH genes had definite location information and unevenly mapped onto different chromosomes. Chromosome Ar03 in B. rapa carried the greatest gene numbers (13 genes), while Ar04 carried only one XTH gene. In B. oleracea, there were 34 XTH genes with definite locate sites and they were distributed among all chromosomes excluding chromosome Co06. Chromosome Co01 was the “hot region”, and carried the greatest gene numbers (8 genes); Co04 and Co05 was the “cold region”, and each contained only one XTH gene. Five BolXTHs lacked definite location information due to incomplete genome assembly, including BraA.XTH10, BolC.XTH2, BolC.XTH27.b, BolC.XTH30.a and BolC.XTH32.c.
TD event contributes to the expansion of gene families and can produce tandem repeat genes as clusters [40]. We obtained the putative tandem-duplicated XTH genes of the two Brassica species from PTGBase. As a result, 21 BraXTH genes and 9 BolXTH genes involved tandem array, and representing 39.6% and 23.7% of total XTH genes in B. rapa and B. oleracea, respectively. These tandem repeat genes produced clusters, which was consistent with the chromosomal location of these genes (Fig. 4). Eight tandem arrays were identified in chromosome Ar01, Ar02, Ar03, Ar08 and Ar010 in B. rapa, while four tandem arrays occurred in Co01, Co02, Co03 and Co07 in B. oleracea.
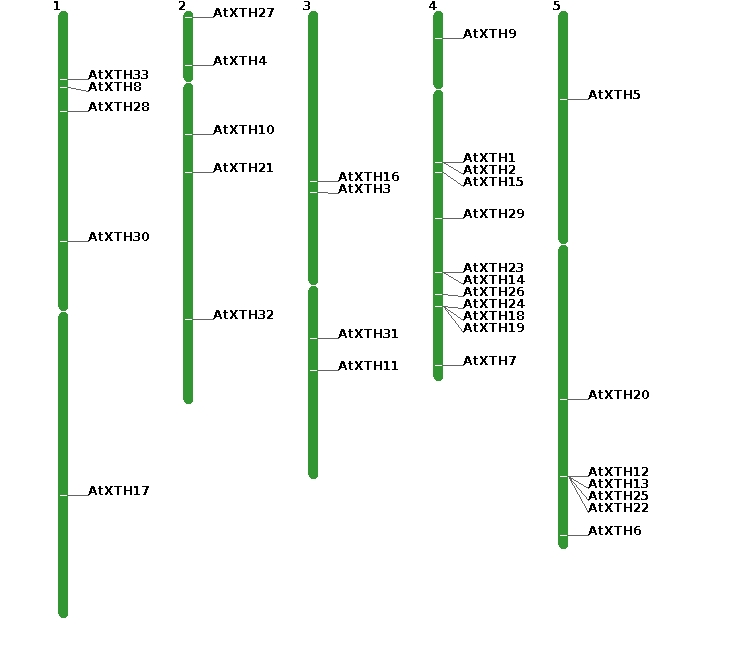
In A. thaliana, four tandem duplicated gene arrays composed of nine AtXTHs were found (Fig. S1). Tandem arrays including AtXTH1/2, AtXTH23/14 and AtXTH24/18/19 were located on chromosome At04 while AtXTH12/13/25/22 was located on chromosome At05. It was worth mentioning that some syntenic genes of these tandem genes excluding AtXTH1/2 have been reserved tandem repeat pattern in both B. rapa genome and B. oleracea gemome, which presumed those tandem arrays arose before the divergence of A. thaliana and Brassica ancestor.
Syntenic Analyses of XTH Genes
The ancestor of diploid Brassica species experienced a WGT event since their divergence from the Arabidopsis lineage. Syntenic genes are orthologous genes that locate in syntenic fragments between different species that derive from a shared ancestor, and synteny analysis mainly was used to share gene annotations and reveal genomic evolution of related species [41]. We obtained the syntenic genes of XTH genes of Arabidopsis in the two Brassica species by searching ‘syntenic gene’ in BRAD(Table 2). According to the analysis of comparative genomics, density and expression level of genes in different regions exist some difference in the genomes of B. rapa and B. oleracea, it can be divided into three fractionated subgenomes which specified as LF (Least-fractionated), MF1 (Medium-fractionated), and MF2 (Most-fractionated) according to the extent of gene retention [39, 42]. The statistical results indicated that there were 13,13,6 BraXTH genes and 9,10,5 BolXTH genes locate on LF, MF1 and MF2 subgenomes respectively(Table 2). In summary, 60.4% and 63.2% of the total XTH genes in B. rapa and B. oleracea were located in syntenic blocks, respectively. Therefore, WGD events perform major function in the expansion of XTH genes in the two Brassica species.
A total of 23 AtXTH genes retained corresponding syntenic genes in the two Brassica species. The copy number of syntenic genes in the genomes of the two Brassica species was different. The first type was that syntenic genes of AtXTH genes were completely preserved in the same syntenic block in the Ar and Co subgenome and 8 genes were involved in this type. The second type was that AtXTH genes were retained in the Ar genome but lost in Co genome, such as AtXTH3 and AtXTH5. The third type was that AtXTH genes had more than one syntenic gene in B. rapa or B. oleracea. For example, 8 and 1 AtXTH genes had 3 syntenic genes in B. rapa and B.oleracea, respectively. An AtXTH should theoretically correspond to 3 syntenic genes and less than 3 may be the result of gene loss after genome replication.
Selection forces of XTH duplicated pairs
To assess whether XTH duplicated pairs in Brassica species experienced different selective forces, the Ka/Ks values were used to calculate (Table S1). The Ka/Ks ratio > 1 represents positive selection, the Ka/Ks ratio = 1 represents neutral selection and the Ka/Ks ratio < 1 represents purifying selection [43]. As a result, 33 and 18 segmental duplicated XTH gene pairs were founded in the B. rapa and B. oleracea, respectively. All segmental duplicated XTH gene pairs were detected with the Ka/Ks <1, while two tandem duplicated gene pair (BraA.XTH22.a-BraA.XTH22.d and BraA.XTH22.c-BraA.XTH22.d) had no Ka/Ks value in B. rapa because these shared same sequence.
The segmental duplications of the XTH genes in B. rapa originated from 0.34 Mya (Ks = 0.0103) to 28.80 Mya (Ks = 0.8640), with the mean of 12.88 Mya (Ks = 0.1436). After comparative analysis, the segmental duplications of the BolXTH genes originated from 5.37 Mya (Ks = 0.1612) to 32.12 Mya (Ks = 0.9637), with the mean of 13.20 Mya (Ks = 0.3960). Overall, the Ka/Ks ratios of segmental duplication of BolC.XTH11.b and BolC.XTH11.a, BraA.XTH2.b and BraA.XTH2.a, together with BraA.XTH23.a and BraA.XTH23.b, were >0.3, while the ratios of the other segmental duplication pairs were all <0.3, suggesting that significant functional divergence of some XTH genes might have occurred after the duplication events.
Expression patterns of XTH genes in different tissues of B. rapa and B. oleracea
To understand the expression changes of XTH genes, we analyzed XTH gene expression patterns across different tissues in the two species of Brassica based on RNA-Seq retrieved from the GEO database (Table S2). If FPKM of a gene is less than 1, it would be considered as unexpressed gene in this study. Therefore, 44 BraXTH genes and 28 BolXTH genes were expressed at least one tissue, the remaining genes lacked expression data or unexpressed in all the tested tissues, illustrating that it might be a non-functional expression or have special temporal and spatial expression patterns but not be detected in this study. There were 23 out 53 (approximately 43.4%) BraXTH genes and 14 out 38 (approximately 36.8%) BolXTH genes widely expressed in all the tested tissues (root, stem, leaf, flower, silique and callus of B. rapa, or root, stem, leaf, flower, silique, callus and bud of B. oleracea). The remaining 21 BraXTH genes and 14 BolXTH genes were expressed in at least one but not all tissues. For example, BraA.XTH29.a and BraA.XTH29.b were expressed in flower specifically; BraA.XTH10, BraA.XTH17.c, BraA.XTH17.d and BraA.XTH32.b were expressed in all tissues except callus. BolC.XTH2 expressed in silique specifically and BolC.XTH29.b expressed only in buds at low levels.
Clustering analysis of expression values showed that both the B. rapa and B. oleraceaXTH genes can be divided into four groups (Fig. 5). In B. rapa, XTH genes in cluster 1 were more highly expressed in leaf than in the other tissues examined, while cluster 2 mainly expressed in root except for BraA.XTH32.b and BraA.XTH9.b. Cluster 3 had higher expression in callus and group 4 mainly expressed in flower, silique or callus, respectively. In B. oleracea, XTH genes in cluster 1 were highly expressed in root, whereas cluster 2 mainly expressed in flower. Four genes in cluster 3 mainly expressed in stem or leaf and genes in cluster 4 mainly expressed in leaf, silique or callus, respectively. In addition, XTH genes in the same group based phylogenetic analysis were not shown in same expression patterns.
Some tandem repeated members showed similar expression pattern across the tested tissues such as BraA.XTH22.a and BraA.XTH22.c in cluster 1, indicating the existence of redundancy (Fig.5A). However, most tandem repeated members displayed distinct expression patterns. For example, BolC.XTH24.a and BolC.XTH24.b were had higher expression level in flower than the other tissues, whereas tandem genes of them were not expressed in the tissues. BolC.XTH17.a showed high expression levels in root and low expression levels in bud, leaf and silique, while BolC.XTH24.d showed high expression levels in flower and low expression levels in leaf (Fig5, Table S2). Meanwhile, all seven XTH tandem genes array were also analyzed and compared in B. rapa. A total of 2 tandem genes (BraA.22b/e and BraA.14b/23b) showed different abundances, but the same trend in patterns, whereas the other tandem genes had differences in abundances and patterns between tandem genes in the tissues. In general, XTH genes in the two Brassica species exhibit differential expression patterns across different tissues, leading to different functional clusters and suggesting functional divergences.