Background: Dengue fever is a widespread viral disease and one of the world’s major pandemic vector-borne infections, causing serious hazard to humanity. The World Health Organisation (WHO) reported that the incidence of dengue fever has increased dramatically across the world in recent decades. WHO currently estimates an annual incidence of 50–100 million dengue infections worldwide. To date, no tested vaccine or treatment is available to stop or prevent dengue fever. Thus, the importance of predicting dengue outbreaks is significant. The current issue that should be addressed in dengue outbreak prediction is accuracy. A limited number of studies have conducted an in-depth analysis of climate factors in dengue outbreak prediction. Methods: The most important climatic factors that contribute to dengue outbreaks were identified in the current work. These factors were used as input parameters for machine learning models. The models were then tested and evaluated on the basis of four-years data (January 2010 to December 2013) collected in Malaysia. Results: This research has two major contributions. A new risk factor, called the TempeRain Factor (TRF), was identified and used as an input parameter for the model of dengue outbreak prediction. Moreover, TRF was applied to demonstrate its strong impact on dengue outbreaks. Experimental results showed that the Bayes Network model with the new meteorological risk factor identified in this study increased accuracy to 92.35% and reduced the root-mean-square error to 0.26 for predicting dengue outbreaks.
Research article
Identification of Significant Climatic Risk Factors and Machine Learning Models in Dengue Outbreak Prediction
https://doi.org/10.21203/rs.2.15755/v2
This work is licensed under a CC BY 4.0 License
You are reading this older preprint version
Pandemic infectious diseases are spreading in many geographical areas. The World Health Organisation (WHO) has reported that dengue fever is one of the most important mosquito-borne diseases. Dengue fever is a common problem and one of the deadliest infectious diseases worldwide. WHO has identified dengue fever as a major rapidly spreading mosquito-borne illness caused by the dengue virus. Accordingly, this disease is a threat and poses severe risk to human populations in tropical and subtropical regions [1- 6]. Health organisations should have a prediction and early warning system to control and monitor dengue fever [7]. Member states in the three WHO regions regularly reported an increase in the annual number of cases from 2.2 million in 2010 to 3.2 million in 2015 [8].
Moreover, WHO estimated an annual projection of 50–100 million dengue infections worldwide. An annual mortality of approximately 20,000–22,000 deaths caused by dengue fever has also been reported [8,9]. In contrast with yellow fever or other mosquito-borne diseases, no vaccine or treatment is available against all serotypes of the dengue virus, and no antiviral drug for treating dengue fever has been reported yet [10]. The only alternative is to prevent or control the outbreak of this disease.
The accuracy of a prediction system for outbreaks is the primary and important concern for controlling dengue fever [11]. Thus, establishing related risk factors is critical for prediction systems [12]. Given that climate factors play a key role in this disease, identifying the relation between weather information and dengue outbreak incidence is a major task in establishing an accurate prediction system for future outbreaks [13,14]. In the current study, important climatic risk factors, such as temperature, relative humidity and rainfall amount, were examined. The current accuracy for prediction systems based on climate factors ranges from 82.39% to 90.5% [12,15-20].
This study is essential because it identifies the critical climatic risk factors in dengue outbreak prediction, i.e. the TempeRain factor (TRF). Then, the identified critical factors (TRF) were applied to prediction models, increasing the accuracy of prediction and reducing the error of prediction models. This process is expected to particularly help authorised organisations or decision makers in health organisations, governments and other concerned groups to become aware and develop improved prevention programmes in the near future.
Related works
A recent study from WHO indicated that 390 million dengue infections occur annually (95% credible interval of 284–528 million); among which, 96 million (67–136 million) are manifested clinically with any severity of the disease [21]. Another study on the prevalence of dengue fever has estimated that 3.9 billion people in 128 countries are at risk of infection from dengue virus [22]. As of December 2018, the Ministry of Health (MOH) of Malaysia has recorded approximately 80,615 dengue cases with 147 deaths compared with 19,884 cases in December 2011 with 36 deaths [23]. The number of cases increased approximately fourfold. By the end of March 2019, 39,805 cases of dengue with 64 deaths were reported in Malaysia compared with 16,917 cases with 34 deaths in March 2018 [24].
Various early warning and monitoring systems are currently implemented to monitor dengue outbreaks worldwide. Dengue prediction models have been previously investigated, but some of these models still exhibit limitations in achieving high accuracy in dengue outbreak prediction [11,25]. Different models and techniques have been integrated into the design of several models for predicting dengue outbreaks. A number of studies have also established prediction models for dengue outbreaks using artificial neural networks [12].
Hybrid models have been used in outbreak prediction research. A hybrid model is an example of an integrated model, and many models based on genetic algorithms are available to determine the weight in a neural network model [11,13,14,20,26]. In Singapore, researchers found significant correlated dengue cases with climatic variables by using a Poisson regression model [27]. One researcher [17] developed a dengue outbreak prediction system in Singapore and obtained 90% accuracy. Thitiprayoonwongse established another prediction system based on a decision tree [18]. Different models of dengue outbreak prediction systems in Malaysia have achieved different accuracies [12,20].
Vulnerability maps of dengue incidences have been generated in Malaysia, resulting in the development and implementation of visualised and predictive modelling using geographic information systems (GIS) for dengue fever in Selangor, Malaysia [28]. One research in Indonesia was concerned with dengue outbreak prediction using a GIS-based early warning system [15]. Another study from the National Taipei University of Technology used C-support vector classification to forecast dengue fever epidemics in Taiwan, and the accuracy of radial basis function (RBF) model was 90.5% [16]. In 2015, Loshini et al. predicted localised dengue incidences in Malaysia using an ensemble system for identification and found that ensemble models exhibit better prediction power than a single model [29].
The prediction of dengue outbreaks is crucial worldwide because this infectious disease remains as a major issue in many countries [11,26,30,31]. Table 1 lists studies on different models of dengue outbreak prediction with distinct climatic risk factors. The asterisk (*) in the columns of the table denotes the risk factors used in different studies.
Table 1: Risk Factors for Dengue Outbreak Prediction Models
Most studies on dengue fever were conducted in Asian countries, such as East–West Asia and the Pacific Ocean regions. WHO reported that countries in East–West Asia, such as Malaysia, Singapore, Taiwan, Indonesia, Bangladesh and Thailand, are critical areas for dengue fever. Most studies have shown that temperature and rainfall directly and significantly affect dengue outbreaks [14,20,26,30,31].
Moreover, changing climatic factors, such as increasing temperature, rainfall and humidity, are the most influential driving forces of dengue virus transmission [31]. One study correlated dengue cases with climatic variables in the city of Singapore and the model for dengue cases was considered the dependent variable; meanwhile, climatic variables, such as rainfall, maximum and minimum temperatures and relative humidity, were considered independent variables [27]. On the basis of the grade of each risk factor used in the 22 references listed in Table 1, most studies primarily used total rainfall (17 studies), average temperature (16 studies), relative humidity (15 studies), minimum temperature (11 studies) and maximum temperature (10 studies) as inputs of prediction models. However, none of the studies focused on the detailed analysis of the factors nor investigated the detailed relationship that can exist amongst factors.
This research aims to describe the dengue prediction system accuracy and the level of risk factors that contribute to a dengue outbreak prediction system and identify the associations amongst new climate risk factors. The detailed factors are then used as inputs for predicting dengue outbreaks.
This section explains the methodology used for this research, including the dataset used, the analysis process, the newly identified integrated input factors, the evaluation with machine learning models and the evaluation method. Fig. 1 illustrates the conceptual framework of our research.
Fig. 1: Conceptual Framework for Identifying Significant Climate Factors in Dengue Outbreak Prediction
The following sections provide a detailed description of each process involved in this framework.
Dataset
Data were collected from two sources. We obtained weekly data on dengue cases based on two federal territories, namely, Kuala Lumpur and Putrajaya, from January 2010 to December 2013. The data were obtained from the reports of the Disease Control Division of MOH, which are available from their official portal [23]. The weather data of Kuala Lumpur and Putrajaya were retrieved from MMD for the period of January 2010 to December 2013. The data are available upon request. Thus, 209 weeks of confirmed dengue cases and meteorological data were evaluated in this study. However, approximately 8% of the data were missing in the MMD datasheets for the study period. Thus, we obtained the missing data for this period from the US Weather Channel Interactive, which provides Malaysian meteorological data. The data were fitted simultaneously with the Putrajaya–Cyberjaya Station in Malaysia. Only minimum temperature, maximum temperature, average temperature, minimum humidity and rainfall were selected because many studies have emphasised that these factors are the most important risk factors for dengue outbreak prediction models, as shown in Table 1.
Analysis
Weather data from MMD provide daily weather information, and the incidence of dengue cases is published weekly by MOH. Thus, data were normalised and classified into two levels, namely, ‘low risk’ and ‘high risk’, on a weekly basis. Weather and meteorological factors play important roles in the incidence of dengue fever. Thus, the dataset was analysed, and the relationship between the incidence of dengue cases and weather information was determined every week using the Pearson correlation coefficient (PCC). The Pearson product– moment correlation coefficient (occasionally referred to as PPMCC, PCC or Pearson’s r) is a measure of linear dependence between two variables X and Y (Equation 1). This method is an important evaluation technique, providing a value between +1 and −1, where +1 indicates the total positive linear correlation, 0 exhibits no linear correlation and −1 indicates total negative linear correlation. This measure is widely used in various science fields [50].
 (1)
(1)
Identification of Significant Factors
The most significant climate factors were identified based on the correlation analysis of the dataset, as shown in Table 2. The analysis result indicated that the highest correlation exists between minimum temperature and cumulative rainfall, with the incidence of dengue cases determined in different weeks.
Table 2: Correlation between Dengue Incidence Cases and Climate Factors
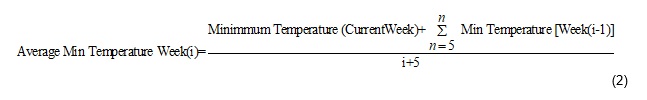
Minimum temperature and daily rainfall are the most significant dengue weather-based risk factors [38,51,52,53]. The average minimum temperature can be calculated as follows (See Supplementary Files for Equation 2):
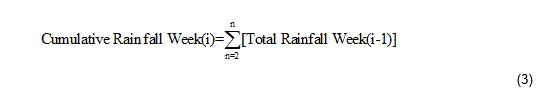
where i is the number of weeks from which the average minimum temperature and [Week(i−1)] is the minimum temperature of the prior weeks to the current week plus minimum temperature of current week . The cumulative rainfall for week i can be calculated using Equation 3 (see Supplementary Files), as follows:
where i is the desired week from which the total rainfall will be calculated, cumulative rainfall week (i) is the final calculation and week (i−1) is the week prior to week (i ).
Table 3 provides the PCCs between the weather variables and the incidence of dengue cases. The underlined and highlighted high positive numbers showed the highest correlation and coefficients between weather parameters and the incidence of dengue fever. Table 3 presents the results for 7 weeks prior to the current week and the optimum value for the average minimum temperature (0.499).
The highest value for cumulative rainfall (0.0071) was obtained for 2 weeks prior to the current week (Table 3).
Table 3: PCC between Climatic Factors and Incidence of Dengue Cases
Thus, the average minimum temperature of Week 5 (plus the current week) and the cumulative rainfall for Week 2 (prior to the current week) exhibit high correlation with dengue cases in accordance with the correlation analysis. The two factors will be regarded as TRF and used as input parameters for dengue outbreak risk level prediction. The combination of factors is shown in Fig. 2.
Fig. 2: Components of TRF
The cumulative rainfall for 2 weeks prior to the current week is identified as a significant factor because it coincides with the life cycle of an Aedes aegypti mosquito, i.e. approximately 2 weeks [38,51,52,53,54,55]. Thus, this result clearly shows that dengue outbreak can happen immediately after an A. aegypti mosquito completes its life cycle and becomes an adult.
Prediction using machine learning models
Once significant factors have been identified, the research proceeded towards predicting the risk incidence level of dengue fever defined as ‘high risk’ and ‘low risk’. To predict this level, we tested five machine learning models using input factors with and without TRF. Table 4 provides the detailed input factors and descriptions.
Table 4: Input Factors with and without TRF
On the basis of the high output result [16,56], we selected Bayes network (BN) models, support vector machine(SVM), RBF tree, decision table and naive Bayes to evaluate the factors using WEKA version 3.8.0 [57]. We used the cross-validation (10-fold) technique to evaluate the models.
Evaluation Metrics
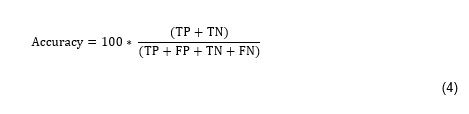
We can evaluate the performance of classifiers on the basis of several accuracy measures and parameters. Moreover, some accuracy and error measures are used to determine the distance between the predicted and the actual known values [58]. The confusion matrix is a useful tool for analysing the efficiency of a classifier in recognising tuples of different classes used in WEKA.
Sensitivity and specificity measures can be used to calculate the accuracy of classifiers. Sensitivity is also referred to as the true positive rate (i.e. the proportion of positive tuples that are correctly identified). Specificity is the true negative rate (i.e. the proportion of negative tuples that are correctly identified).
Equation 4 (see Supplementary Files) shows how accuracy was calculated using the confusion matrix.
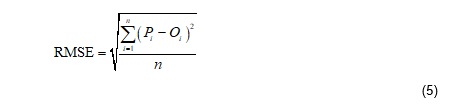
We used the root-mean-square error (RMSE) to demonstrate the error rate [50,58]. RMSE was also adopted to identify the strengths of model evaluation. Optimising RMSE during model calibration may provide a small error variance at the expense of a significant model bias [50,59]. This statistic is determined as follows (Equation 5 in the Supplementary Files):
where Pi and Oi are known as the experimental and forecasted values, respectively; and n is the total number of test data.
Table 5 presents the results from five machine learning models with and without TRF inputs. Improved results and reduced errors were obtained using the weather data (as external risk factors for a dengue fever outbreak prediction model) by applying machine learning models (as data analysers) and adding newly identified factors (TRF).
Table 5: Machine Learning Classifier Models Using Cross -validation (10-fold) with TRF
Thus, the proposed factors and machine learning model are beneficial for predicting the dengue risk level. The results also showed that models with TRF achieved higher accuracies compared with those without TRF. The highest accuracy was obtained by the BN classifier with TRF (92.35%) but with an extremely low RMSE (0.26).
Other studies exhibit different accuracies based on their own private databases, which consist of data collected from patients in hospitals, compared with our research area [15,18,20,61]. Our research database used accessible and open-source data for climate factors.
Table 6: Benchmarking with Previous Studies
Table 6 shows the accuracy of the BN classifier with TRF compared with the other models that used climate factors. The proposed model with TRF achieved the highest accuracy of 92.35% compared with the other models.
Conclusion and Future Work
We identified a new significant risk factor, called TRF, which combined the average minimum temperature at 5 weeks plus the current week and the cumulative rainfall at 2 weeks prior to the current week. TRF significantly contributed to dengue outbreak prediction. The use of accurate and appropriate input factors for outbreak prediction can also provide enhanced and precise results for model output. We used various machine learning models to apply the identified significant factors to predicting dengue outbreak risk.
The integration of factors into the BN model resulted in a significant accuracy of 92 .35%. This accuracy showed that using TRF in the BN model outperformed all other outbreak prediction models. Moreover, the RMSE of 0.26 of the proposed system was lower than those of the other models. We strongly believe that using TRF can improve outbreak prediction systems. In our future study, we will test our model with different prediction systems and models. Moreover, future research should emphasise the exploration of other hidden and important risk factors for predicting dengue outbreaks.
This research has several limitations, and the most important one is data availability, which is due to privacy issues and the regulation set by MOH Malaysia. Although many risk factors for dengue outbreak are available, we only focused on the detailed analysis of temperature and rain risk factors for dengue outbreaks, which have been emphasised as the most important factors, due to the analysis of importance and access limitation.
ANN: Artificial Neural Networks
BN: Bayes Network
DLNM: Distributed Lag Non-linear Model
FN: False Negative
FP: False Positive
GA: Genetic Algorithm
GEE: generalized estimating equation
GIS: Geographic Information System
GLM: Generalised Linear Model
MCMC: Markov Chain Monte Carlo
MMD: Malaysian Meteorological Department
MOH: Ministry of Health Malaysia
NBR: Negative Binomial Regression
PCC: Pearson correlation coefficient
PPMCC: Pearson Product-Moment Correlation Coefficient
RBF: Radial basis function
RMSE: Root Mean Squared Error
SRCC: Spearman's rank correlation coefficient
SVM: Support Vector Machine
TN: True Negative
TP: True Positive
TRF: TempeRain Factor
WHO: World Health Organization
Availability of data and material
The completed combined datasets generated and analysed during the current study are available from the corresponding author on reasonable request.
The dengue confirmed case data that support the findings of this study are available in Ministry of Health Malaysia, [http://www.moh.gov.my/index.php/database_stores/store_view/1]
The weather data that support the findings of this study are obtained from Malaysian Meteorological Department. Data are available from the authors upon reasonable request.
Competing interests
The authors declare that they have no competing interests
Funding
Research University Grant-Faculty Program (GPF011D-2019).
Authors' contributions
Felestin Yavari Nejad contributed on the related works, method, experiments and analysis of the studies. Kasturi Dewi Varathan contributed in method and discussions.
Acknowledgements
We would like to thank Research University Grant-Faculty Program (GPF011D-2019) for funding this research.
Ethics approval and consent to participate
Not applicable
Consent for publication
Not applicable
- Holmes, E. C., Tio, P. H., Perera, D., Muhi, J., & Cardosa, J. (2009). Importation and co-circulation of multiple serotypes of dengue virus in Sarawak, Malaysia. Virus Research, 143 (1), 1-5. doi:10.1016/j.virusres.2009.02.020
- Wongkoon, S., Jaroensutasinee, M., & Jaroensutasinee, K. (2012). Development of temporal modeling for prediction of dengue infection in Northeastern Thailand. Asian Pacific Journal of Tropical Medicine , 5 (3), 249-253.
- Chen, S. C., & Hsieh, M. H. (2012). Modeling the transmission dynamics of dengue fever: Implications of temperature effects. Science of the Total Environment, 431, 385-391. doi:10.1016/j.scitotenv.2012.05.012
- Chinikar, S., Ghiasi, S. M., Shah-Hosseini, N., Mostafavi, E., Moradi, M., Khakifirouz, S., Rasi Varai, F. S., Rafigh, M., Jalali, T., Goya, M. M., Shirzadi, M. R., Zainali, M. & Fooks, A. R. (2013). Preliminary study of dengue virus infection in Iran. Travel Medicine and Infectious Disease, 5(3), 166-169. doi:10.1016/j.tmaid.2012.10.001
- Juanarita, J., Azmi, M. N. R., Azhany, Y. & Liza-Sharmini, A. T. (2012), Dengue related maculopathy and foveolitis. Asian Pacific Journal of Tropical Biomedicine, 2(9), 755-756. doi: 10.1016/S2221-1691(12)60223-8
- WHO/TDR. (2009), Dengue: guidelines for diagnosis, treatment, prevention and control – New edition. Geneva: World Health Organization.
- Abeyrathna, M. P. A. R., Abeygunawrdane, D.A., Wijesundara, R. A. A. V., Mudalige,V.B., Danaja, M., Kaushalya, M., Sriganesh, L., Madushi, B., Shehan, P. (2016). Dengue Propagation Prediction using Human Mobility. Moratuwa Engineering Research Conference (MERCon). 156-161.
- World Health Organization (WHO). (2016). Weekly epidemiological record. Factsheet117, 30(91), 349–364. Available: http://www.who.int/mediacentre/factsheets/fs117/en
- Ibrahim, A., Zin, N. A. M., Ashaari, N. S. (2011). Simulation Model for Predicting Dengue Fever Outbreak. World Academy of Science, Engineering and Technology, International Journal of Computer, Information Science and Engineering 5(11).
- Kuhn, K., Campbell-Lendrum, D., Haines, A., Cox, J. (2005). Using climate to predict infectious a disease Epidemics. Geneva, Switzerland: World Health Organization (WHO) Document Production Services.
- Husin, N. A., Mustapha, N., Sulaiman, M. N., & Yaakob, R. (2012). A hybrid model using genetic algorithm and neural network for predicting dengue outbreak. 4th Conference on. doi:10.1109/DMO.2012.6329793
- Aburas, H. M., Cetiner, B. G. and Sari, M., (2010). Dengue confirmed-cases prediction: A neural network model. Expert Systems with Applications, 37(6), 4256-4260. doi:10.1016/j.eswa.2009.11.077
- Mathulamuthu, S. M., Asirvadam, V. S., Dass, S. C., Gill, B. S., Loshini, T. (2016). Predicting Dengue Incidences Using Cluster Based Regression on Climate Data. Control System, Computing and Engineering (ICCSCE), 2016 6th IEEE International, 245-250, doi: 10.1109/ICCSCE.2016.7893579
- Soemsap, T., Wongthanavasu, S., Satimai, W. (2014) Forecasting Number of Dengue Patients Using Cellular Automata Model. Proceedings of the International Electrical Engineering Congress, doi: 10.1109/iEECON.2014.6925876.
- Tazkia, R. A. K., Narita, V., Nugroho, A. S. (2016). Dengue Outbreak Prediction for GIS based Early Warning System. International Conference on Science in Information Technology (ICSITech), doi: 10.1109/ICSITech.2015.7407789
- Rahmawati, D. & Huang, Y. P. Using C-support Vector Classification to Forecast Dengue Fever Epidemics in Taiwan. (2016). International Conference on System Science and Engineering (ICSSE) National Chi Nan University, Taiwan; July 7-9. 978-1-4673-8966-2/16
- Hii YL,. (2013). Climate and Dengue Fever: Early warning based on temperature and Rainfall. Umeå University Medical Dissertations. New Series No 1554, ISSN 0346-6612, ISBN 978-91-7459-589-5.
- Thitiprayoonwongse, D., Suriyaphol, P., Soonthornphisaj, N. (2012). Data Mining of Dengue Infection Using Decision Tree. Latest Advances in Information Science and Applications, Entropy, 2, 2 154-159. doi: 10.1109/ICSITech.2015.7407789
- Tanner, L., Schreiber, M., Low, JGH., Ong, A., Tolfvenstam, T., et al. (2008). Decision Tree Algorithms Predict the Diagnosis and Outcome of Dengue Fever in the Early Phase of Illness. PLoS Negl Trop Dis 2(3): e196. doi:10.1371/journal.pntd.0000196
- Ibrahim, F., Faisal, T., Mohamad Salim, M. I. & Taib, M. N., (2010). Non-invasive diagnosis of risk in dengue patients using bioelectrical impedance analysis and artificial neural network. Medical & Biological Engineering & Computing, 48(11), 1141-1148. doi: 10.1007/s11517-010-0669-z
- Bhatt S., Gething PW., Brady OJ., Messina JP., Farlow AW., Moyes CL. et.al. (2013). The global distribution and burden of dengue. Nature.496:504–5077. doi:10.1038/nature12060.
- Brady OJ, Gething PW, Bhatt S, Messina JP, Brownstein JS, Hoen AG et al. (2012). Refining the global spatial limits of dengue virus transmission by evidence-based consensus. PLoS Negl Trop Dis. 2012;6(8) :e1760. doi:10.1371/journal.pntd.0001760.
- Ministry of Health Malaysia (MOH). Dengue Fever And Chikungkunya Situation, Retrieved from http://www.moh.gov.my/index.php/database_stores/store_view/17, Available [Access March 2017]
- World Health Organization (WHO), Distribution of dengue, worldwide, (2018). Average number of suspected or confirmed dengue cases reported to WHO, 2010–2016. Retrieved from www.who.int/denguecontrol/epidemiology/en, Available [Access March 2019]
- Andrick,B., Clark, B., Nygaard, K., Logar, A. and Penaloza, M. (1997). Infectious Disease and Climate Change: Detecting Contributing Factors and Predicting Future Outbreaks. Geoscience and Remote Sensing, 1997. IGARSS '97. doi: 10.1109/IGARSS.1997.609159
- Korstanje, M., George, B., (2016). Media constructions of fear in the outbreak of an epidemic disease: The case of dengue fever in Argentina, International Journal of Emergency Services, 5(1), 95-104, doi: 10.1108/IJES-01-2016-0001
- Pinto, E., Coelho, M., Oliver, L., and Massad, E. (2011). The influence of climate variables on dengue in Singapore. International Journal of Environmental Health Research 21(6): 415-426. doi: 10.1080/09603123.2011.572279.
- Mathur, N., Asirvadam V. S., Sarat. C. (2016). Generating Vulnerability Maps of Dengue Incidences for Petaling District in Malaysia, 12th International Colloquium on Signal Processing & its Applications (CSPA2016). doi: 10.1109/CSPA.2016.7515836
- Loshini T., Vijanth S. Asirvadam , Sarat C. Dass. Balvinder S. Gill. Predicting Localized Dengue Incidences using Ensemble System Identification. (2015) International Conference on Computer, Control, Informatics and Its Applications (IC3INA). pp:6-11. doi: 10.1109/IC3INA.2015.7377737
- Burattini, MN., Chen, M., Chow, A., Coutinho, FAB., Goh, KT., Lopez, LF., Ma, S.,
Massad, E., (2008). Modelling the control strategies against dengue in Singapore. Epidemiol Infect. 136(3), 309–319. doi: : 10.1017/S0950268807008667 - Mochammad, C. R., Achmad, B., Tri, H. (2016). Comparison of Montecarlo Linear and Dynamic Polynomial Regression in Predicting Dengue Fever Case. Knowledge Creation and Intelligent Computing (KCIC). doi: 10.1109/KCIC.2016.7883649.
- Jesavel A. Iguchi, Xerxes T. Seposo and Yasushi Honda. (2018). Meteorological factors affecting dengue incidence in Davao, Philippines, BMC Public Health (2018) 18:629. doi: 10.1186/s12889-018-5532-4
- Paul KK, Dhar-Chowdhury P, Haque CE, Al-Amin HM, Goswami DR, Kafi MAH, et al. (2018). Risk factors for the presence of dengue vector mosquitoes, and determinants of their prevalence and larval site selection in Dhaka, Bangladesh. PLoS ONE 13(6): e0199457. doi: 10.1371/journal.pone.0199457
- Hu Suk Lee, Hung Nguyen-Viet, Vu Sinh Nam, Mihye Lee, Sungho Won, Phuc Pham Duc and Delia Grace. (2017). Seasonal patterns of dengue fever and associated climate factors in 4 provinces in Vietnam from 1994 to 2013. BMC Infectious Diseases (2017) 17:218. Doi: 10.1186/s12879-017-2326-8
- Datoc, H. I., Caparas, R., Caro, J. (2016). Forecasting and Data Visualization of Dengue spread in the Philippine Visayas Island group. 7th International Conference on Information, Intelligence, Systems & Applications (IISA), doi: 10.1109/IISA.2016.7785420.
- Xiang, J., Hansen, A., Liu, Q., Liu, X., Tong, M. X., Sun, Y., & Weinstein, P. (2016). Association between dengue fever incidence and meteorological factors in Guangzhou, China, 2005–2014. Environmental Research, 153, 17-26. doi.10.1016/j.envres.2016.11.009
- Hai-Yan Xu, Fu, X., Lee, L. K. H., Ma, S., Goh, K. T., Wong, J., & Lim, C. L. (2014). Statistical modeling reveals the effect of absolute humidity on dengue in Singapore. PLoS Negl Trop Dis, 8(5), e2805. doi: 10.1371/journal.pntd.0002805
- Lung, C.C., Hwa L.Y., (2014). Impact of meteorological factors on the spatiotemporal patterns of dengue fever incidence. Environment International 73: 46–56.
- Maha Bouzid, Felipe J Colón-González, Tobias Lung, Iain R Lake and Paul R Hunter. (2014). Climate change and the emergence of vector-borne diseases in Europe: case study of dengue fever. BMC Public Health 2014 14:781. doi:10.1186/1471-2458-14-781
- Felipe J., Colón-González, Fezzi, C., Lake, I. R., & Hunter, P. R. (2013). The effects of weather and climate change on dengue. PLoS Negl Trop Dis, 7(11), e2503. doi: 10.1371/journal.pntd.0002503
- Cheong, Y. L., Burkart, K., Leitão, P. J., & Lakes, T. (2013). Assessing weather effects on dengue disease in Malaysia. International journal of environmental research and public health, 10(12), 6319-6334. doi:10.3390/ijerph10126319
- Dom, N. C., Hassan, A. A., Latif, Z. A., & Ismail, R. (2013). Generating temporal model using climate variables for the prediction of dengue cases in Subang Jaya, Malaysia. Asian Pacific Journal of Tropical Disease, 3(5), 352-361. doi: 10.1016/S2222-1808(13)60084-5, Chicago
- Hii YL, Zhu H., Ng N., Ng LC., Rocklöv J. (2012). Forecast of Dengue Incidence Using Temperature and Rainfall. PLoS Negl Trop Dis 6(11): e1908. doi:10.1371/journal.pntd.0001908
- Zhaoxia Wang, Chan, H. M., Hibberd, M. L., & Lee, G. K. K. (2012). Delayed Effects of Climate Variables on Incidence of Dengue in Singapore during 2000-2010. APCBEE Procedia, 1, 22-26. doi: 10.1016/j.apcbee.2012.03.005
- Rachel, L., Bailey, T. C., Stephenson, D. B., Graham, R. J., Coelho, C. A.S., Carvalho, M. Sá., Barcellos, C. (2011). Spatio-temporal modelling of climate-sensitive disease risk: Towards an early warning system for dengue in Brazil. Computers & Geosciences. 37(3), 371-381. doi:10.1016/j.cageo.2010.01.008.
- Halide Halmar. (2010). Assessing Quality and Value of Predictive Models for Dengue Hemorrhagic Fever Epidemics. Nova Publisher, New York.
- Cetiner, B. G., Sari, M., & Aburas, H. M. (2009, May). Recognition of dengue disease patterns using artificial neural networks. In 5th International Advanced Technologies Symposium (IATS’09) 359-362.
- Rachata,N., Charoenkwan, P., Yooyativong, T., Chamnongthal, K., Lursinsap, C. & Higuchi, K. (2008). Automatic Prediction System of Dengue Haemorrhagic-Fever Outbreak Risk by Using Entropy and Artificial Neural Network. Communications and Information Technologies, 2008 (ISCIT). pp210−214. doi: 10.1109/ISCIT.2008.4700184.
- Promprou, S., Jaroensutasinee, M., & Jaroensutasinee, K. (2005). Climatic Factors Affecting Dengue Haemorrhagic Fever Incidence in Southern Thailand.
- Moriasi D. N., Arnold, J. G., Van Liew, M. W. Bingner, R. L., Harmel, R. D., Veith, T. L. (2007). Model Evaluation Guidelines For Systematic Quantification Of Accuracy In Watershed Simulations. Transactions of The Asabe. 50(3): 885−900. doi: 10.13031/2013.23153.
- Christophers, S.R. (1960). Aedes aegypti (L.) the yellow fever mosquito. Its life history.In: Bionomics and Structure. Cambridge Univ. Press, Cambridge. 133, (3463), 1473-1474. doi: 10.1126/science.133.3463.1473-a
- Yang HM, Macoris MLG, Galvani KC, Andrighetti MTM, Wanderley DMV .(2009). Assessing the effects of temperature on the population of Aedes aegypti, the vector of dengue. Epidemiol Infect 137: 1188-1202. doi: 10.1017/S0950268809002040.
- Ahmad R, Wong YC, Zamre I, Lee HL, Zurainee MN. (2009). The effect of extrinsic incubation temperature on development of dengue serotype 2 and 4 viruses in Aedes aegypti (L.). Southeast Asian J Trop Med Public Health 40(5): 942-650.
- Watts, D. M., Burke, D. S., Harrison, B. A., Whitmire, R. E., & Nisalak, A. (1987). Effect of temperature on the vector efficiency of Aedes aegypti for dengue 2 virus. The American journal of tropical medicine and hygiene, 36(1), 143-152. doi: 10.4269/ajtmh.1987.36.143
- Chan, M., Johansson, M.A. (2012) The Incubation Periods of Dengue Viruses. PLoS ONE 7(11): e50972. doi:10.1371/journal.pone.0050972
- Fathima, S. and Hundewale, N. (2011). Comparison of Classification Techniques-SVM and Naives Bayes to predict the Arboviral Disease-Dengue, International Conference on Bioinformatics and Biomedicine Workshops, doi: 10.1109/BIBMW.2011.6112426
- Hall M, Frank E, Holmes G, Pfahringer B, Reutemann P, Witten I.H (2009). The WEKA Data Mining Software: An Update. SIGKDD Explorations. 11(1): 10–18.
- Nasa .Ch and Suman (2012). Evaluation of Different Classification Techniques for WEB Data. International Journal of Computer Applications (0975 – 8887). 52(9): 34–40.
- Boyle, D. P., H. V. Gupta, & Sorooshian, S. (2000). Toward improved calibration of hydrologic models: Combining the strengths of manual and automatic methods. Water Resources Res. 36(12): 3663-3674. doi: 10.1029/2000WR900207
- Ahmad R, Suzilah I, Wan Najdah WMA, Topek O, Mustafakamal I, Lee HL (2018) Factors determining dengue outbreak in Malaysia. PLoS ONE 13(2): e0193326. https://doi.org/10.1371/journal.pone.0193326
- Saha, S. (2016). Combined committee machine for classifying dengue fever. In Microelectronics, Computing and Communications (MicroCom), 2016 International Conference on . pp. 1-6. doi: 10.1109/MicroCom.2016.7522585.
Table 1: Risk Factors for Dengue Outbreak Prediction Models
|
Reference |
Technique |
Year |
Geographical Data Used |
Temperature |
Humidity |
Rainfall |
|
||||||
|
Min |
Avg |
Max |
Relative (Mean) |
Cumulative Rainfall |
Total Rainfall |
Max 24-h Rainfall |
Max 1-H Rainfall |
Bi-Weekly |
Mean |
||||
|
[32] |
Wavelet coherence analysis / quasi-Poisson regression combined with distributed lag nonlinear model (DLNM) |
2018 |
Philippines |
|
* |
|
|
* |
|
|
|
|
|
|
[33] |
generalized linear model |
2018 |
Bangladesh |
|
* |
|
* |
|
* |
|
|
|
|
|
[34] |
negative binomial regression (NBR)/ generalized estimating equation (GEE) |
2017 |
Vietnam |
|
* |
|
|
|
* |
|
|
|
|
|
[35] |
Artificial Neural Network (ANN) |
2016 |
Philippine |
|
* |
|
* |
|
* |
|
|
|
|
|
[36] |
Distributed lag non-linear models (DLNM)/ Generalised estimating equation models (GEE) |
2016 |
China |
* |
|
* |
* |
|
|
|
|
|
* |
|
[37] |
Spearman rank correlation / Distributed Lag Non-linear Model (DLNM) |
2014 |
Singapore |
* |
* |
* |
* |
|
* |
|
|
|
* |
|
[38] |
Distributed lag nonlinear model (DLNM) and Markov random fields |
2014 |
Taiwan |
* |
* |
* |
|
|
* |
* |
* |
* |
|
|
[39] |
Generalized Additive Model (GAM) |
2014 |
Europe |
* |
|
* |
* |
|
* |
|
|
|
|
|
[40] |
Generalized Additive Model (GAM) |
2013 |
Mexico |
* |
|
* |
|
|
* |
|
|
|
|
|
[41] |
Poisson generalized additive model/ distributed non-linear lag model (DLMN) |
2013 |
Malaysia , |
* |
* |
* |
* |
|
|
|
|
* |
* |
|
[17] |
Poisson multivariate regression models |
2013 |
Singapore |
|
* |
|
|
* |
|
|
|
|
|
|
[42] |
Autoregressive Integrated Moving Average (ARIMA) |
2013 |
Malaysia |
|
* |
|
* |
|
* |
|
|
|
|
|
[43] |
Poisson multivariate regression |
2012 |
Singapore |
|
* |
|
|
* |
|
|
|
|
|
|
[44] |
Spearman's rank correlation coefficient (SRCC) |
2012 |
Singapore |
* |
|
|
* |
|
* |
|
|
|
|
|
[3] |
vector–host transmission model |
2012 |
Taiwan |
* |
|
* |
* |
|
* |
|
|
|
|
|
[11] |
Neural Network and Genetic Algorithm |
2012 |
Malaysia |
|
|
|
|
|
* |
|
|
|
|
|
[45] |
Generalised linear model (GLM) / Bayesian framework using Markov Chain Monte Carlo (MCMC) |
2011 |
Brazil |
|
* |
|
* |
|
* |
|
|
|
|
|
[12] |
Artificial Neural Networks (ANN) |
2010 |
Singapore |
|
* |
|
* |
|
* |
|
|
|
|
|
[46] |
multiple regression and discriminant analysis techniques / Peirce skill score |
2010 |
Indonesia |
* |
* |
* |
* |
|
* |
|
|
|
|
|
[47] |
Artificial Neural Networks (ANN) |
2009 |
Turkey |
|
* |
|
* |
|
* |
|
|
|
|
|
[48] |
Entropy and Artificial Neural Network |
2008 |
Thailand |
* |
* |
* |
* |
|
* |
|
|
|
|
|
[49] |
Kolmogorov-Sminov test / Pearson’s correlation Coefficient / Stepwise regression techniques |
2005 |
Thailand |
* |
* |
* |
* |
|
* |
|
|
|
|
|
|
Total |
11 |
16 |
10 |
15 |
3 |
17 |
1 |
1 |
2 |
3 |
||
Table 2: Correlation between Dengue Incidence Cases and Climate Factors
|
Temperature |
Mean relative Humidity |
Rainfall |
||
|
Minimum Temperature |
Mean Temperature |
Maximum Temperature |
||
|
0.447 |
0.339 |
0.316 |
-0.176 |
-0.020 |
Table 3: PCC between Climatic Factors and Incidence of Dengue Cases
|
|
Average Minimum Temperature |
Cumulative Rainfall |
|
Current Week |
0.447 |
–0.0201 |
|
1 Week Prior |
0.465 |
0.0065 |
|
2 Week Prior |
0.480 |
0.0071 |
|
3 Week Prior |
0.494 |
–0.0005 |
|
4 Week Prior |
0.498 |
–0.0123 |
|
5 Week Prior |
0.499 |
–0.0139 |
|
6 Week Prior |
0.489 |
–0.0045 |
|
7 Week Prior |
0.476 |
0.0020 |
Table 4: Input Factors with and without TRF
|
Input Factors without TRF |
Input Factors with TRF |
||
|
Type |
Parameter Description |
Type |
Parameter Description |
|
Weather Factors |
Minimum temperature (°C) |
Weather Factors |
|
|
Mean temperature (°C) |
Mean temperature (°C) |
||
|
Maximum temperature (°C) |
Maximum temperature (°C) |
||
|
Mean relative humidity (%) |
Mean relative humidity (%) |
||
|
Cumulative of rainfall (mm) |
|
||
|
|
TRF Factors |
Average of minimum temperature 5 weeks before the current week (°C) |
|
|
|
Cumulative of rainfall for 2 weeks prior to the current week (mm) |
||
Table 5: Machine Learning Classifier Models Using Cross -validation (10-fold) with TRF
|
Models |
Accuracy (%) |
|
Root Mean Squared Error (RMSE) |
|
|
Bayes Net |
With TRF |
92.35 |
|
0.26 |
|
Without TRF |
91.39 |
|
0.28 |
|
|
SVM |
With TRF |
88.04 |
|
0.35 |
|
Without TRF |
88.00 |
|
0.33 |
|
|
RBF Tree |
With TRF |
89.47 |
|
0.29 |
|
Without TRF |
89.47 |
|
0.28 |
|
|
Decision Table |
With TRF |
90.41 |
|
0.28 |
|
Without TRF |
89.95 |
|
0.28 |
|
|
Naive Bayes |
With TRF |
89.4737 |
|
0.3064 |
|
Without TRF |
88.9952 |
|
0.2904 |
|
Table 6: Benchmarking with Previous Studies
|
Reference |
Year |
Model |
Accuracy (%) |
|
[60] |
2018 |
Correlation and Autoregressive Distributed Lag Model |
84.90 |
|
[16] |
2016 |
C-SVC Kernel and RBF |
90.50 |
|
[17] |
2013 |
Poisson Multivariate Regression Models |
90.00 |
|
[12] |
2010 |
Artificial Neural Networks |
82.39 |
|
[48] |
2008 |
Automatic Prediction System by Using Entropy and Artificial Neural Network |
85.92 |
|
Our Proposed Model |
Bayes Network Model using TempeRain Factor (TRF) |
Accuracy = 92.35 |
|