Evaluation Criteria
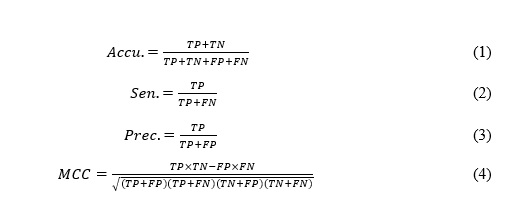
In this paper, accuracy (Accu.), sensitivity (Sen.), precision (Prec.), and Matthews correlation coefficient (MCC) are used to estimate the performance of DTIRF. Their formulas are as follows: (see Formulas 1 - 4 in the Supplementary Files)
where TP is the number of drug-target pairs that are related to each other to be correctly identified; FP is the number of drug-target pairs that are related to each other to be incorrectly identified; TN is the number of drug-target pairs that are not related to each other to be correctly identified; FN is the number of drug-target pairs that are not related to each other to be incorrectly identified. Moreover, the receiver operating characteristic (ROC) curve [16, 17] and area under the ROC curve (AUC) are used to visually display the performance of the classifier.
Model Construction
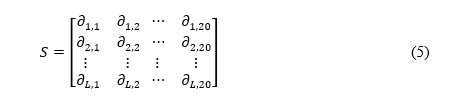
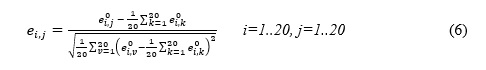
To optimize the performance of the DTIRF, the grid search method is applied to explore the parameters of PsePSSM and FwRF. When extracting feature by PsePSSM, the parameters in the formula 5 can be adjusted to increase the amount of information. In the experiment we explored the effects of different PsePSSM parameters on the performance of classifiers on Enzyme data set. After optimization, we set the parameter of PsePSSM to 34, and the parameters the feature selection ratio , the feature subset and the decision tree number of FwRF classifier to 0.8, 16 and 21, respectively. Figure 1 display the prediction results of different FwRF parameters, where an optimal choice of K=16 and L=21 are finally selected.
Evaluation of Model Prediction Ability
After finding the optimal parameters of the DTIRF, we put them in benchmark data sets, including Enzyme, Ion Channel, GPCR and Nuclear Receptor. In order to avoid over-fitting of the model, we use five-flod cross-validation method to evaluate the performance of the model. More specifically, we split the data set into five subsets, one of which is taken as the test set, and the remaining four are used as the training set. Then, the cross-validation process will be repeated five rounds. The results from the 5 times are then averaged to produce the final result.
Table 1-4 list the predicted results by the proposed approach on four benchmark data sets. In Enzyme data set, we gained the average of accuracy, sensitivity, precision, MCC, and AUC were 91.68%, 90.84%, 92.39%, 83.39%, and 91.72%. Their standard deviations were 0.84%, 1.68%, 1.37%, 1.68%, and 1.06%. In Icon Channel data set, we achieved these evaluation criteria were 88.11%, 90.30%, 86.57%, 79.02%, and 88.27%. Their standard deviations were 1.01%, 1.61%, 2.29%, 1.55%, and 1.36%. In GPCR data set, we yielded the average of these evaluation criteria were 84.72%, 84.73%, 84.73%, 74.06%, and 85.57%. Their standard deviations were 1.94%, 3.45%, 4.21%, 2.68%, and 2.28%. In Nuclear Receptor data set, we gained the average of these evaluation criteria were 78.33%, 81.97%, 78.08%, 65.56%, and 75.31%. Their standard deviations were 5.34%, 7.85%, 12.56%, 6.05%, and 5.87%. Figure 2-5 draws the ROC curve generated from DTIRF on the four benchmark data sets.
Table 1. Experimental results of cross-validation of the proposed model on Enzyme data set.
|
Test set
|
Accu.(%)
|
Sen.(%)
|
Prec.(%)
|
MCC(%)
|
AUC(%)
|
|
1
|
90.51
|
89.20
|
91.27
|
81.03
|
90.04
|
|
2
|
92.82
|
93.22
|
92.59
|
85.64
|
92.96
|
|
3
|
91.62
|
90.19
|
92.74
|
83.28
|
92.09
|
|
4
|
91.97
|
89.68
|
94.40
|
84.05
|
91.79
|
|
5
|
91.47
|
91.90
|
90.96
|
82.94
|
91.73
|
|
Average
|
91.68±0.84
|
90.84±1.68
|
92.39±1.37
|
83.39±1.68
|
91.72±1.06
|
Table 2. Experimental results of cross-validation of the proposed model on Icon Channel data set.
|
Test set
|
Accu.(%)
|
Sen.(%)
|
Prec.(%)
|
MCC(%)
|
AUC(%)
|
|
1
|
86.61
|
90.38
|
83.76
|
76.76
|
86.16
|
|
2
|
87.63
|
91.92
|
84.78
|
78.22
|
87.83
|
|
3
|
88.98
|
91.61
|
87.22
|
80.36
|
89.68
|
|
4
|
88.31
|
89.67
|
87.62
|
79.33
|
89.07
|
|
5
|
89.02
|
87.93
|
89.47
|
80.43
|
88.59
|
|
Average
|
88.11±1.01
|
90.30±1.61
|
86.57±2.29
|
79.02±1.55
|
88.27±1.36
|
Table 3. Experimental results of cross-validation of the proposed model on GPCR data set.
|
Test set
|
Accu.(%)
|
Sen.(%)
|
Prec.(%)
|
MCC(%)
|
AUC(%)
|
|
1
|
82.28
|
86.21
|
77.52
|
70.73
|
82.86
|
|
2
|
87.01
|
88.62
|
85.16
|
77.38
|
88.82
|
|
3
|
86.22
|
86.52
|
88.41
|
76.00
|
86.72
|
|
4
|
84.63
|
80.33
|
86.73
|
73.83
|
84.37
|
|
5
|
83.46
|
81.95
|
85.83
|
72.37
|
85.11
|
|
Average
|
84.72±1.94
|
84.73±3.45
|
84.73±4.21
|
74.06±2.68
|
85.57±2.28
|
Table 4. Experimental results of cross-validation of the proposed model on Nuclear Receptor data set.
|
Test set
|
Accu.(%)
|
Sen.(%)
|
Prec.(%)
|
MCC(%)
|
AUC(%)
|
|
1
|
69.44
|
83.33
|
65.22
|
55.90
|
72.22
|
|
2
|
77.78
|
85.00
|
77.27
|
64.34
|
69.69
|
|
3
|
80.56
|
92.31
|
66.67
|
67.47
|
74.25
|
|
4
|
83.33
|
77.78
|
87.50
|
72.05
|
75.31
|
|
5
|
80.56
|
71.43
|
93.75
|
68.03
|
85.08
|
|
Average
|
78.33±5.34
|
81.97±7.85
|
78.08±12.56
|
65.56±6.05
|
75.31±5.87
|
Due to the high redundancy of DTI network, in order to fully evaluate the performance of the proposed model, we also use leave-one-cluster-out cross-validation method to experiment on four benchmark data sets. Leave-one-cluster-out cross-validation uses a cluster-based (i.e., similarity-driven) approach to separating datasets into training sets and test sets that systematically explore the effects of non-uniform training data. Specifically, we implemented a series of leave-one-cluster-out cross-validation at the protein and drug levels on the benchmark data sets. Taking protein as an example, our implementation process is as follows: firstly, we perform a standard normalization of the input data; secondly, we use Yamanishi’s “Protein sequence similarity matrix” to cluster proteins at 0.4 thresholds; thirdly, each time one cluster is used as the validation set and the remaining clusters are used as the training set to perform leave-one-cluster-out cross-validation; finally, we summarize the results of each cluster to get the final results. Similarly, for drugs we use Yamanishi's "Compound structure similarity matrix" for clustering and use the same method. The results of leave-one-cluster-out cross-validation on the four benchmark data sets are shown in table 5. It can be seen from the table that the proposed model can also achieve good results under the leave-one-cluster-out cross-validation method. These results indicate that the proposed model has good robustness and can effectively predict the relationship between drugs and targets.
Table 5. Experimental results of leave-one-cluster-out cross-validation of the proposed model on four benchmark data sets
|
Data set
|
level
|
Accu.(%)
|
Sen.(%)
|
Prec.(%)
|
MCC(%)
|
AUC(%)
|
|
Enzyme
|
drug
|
90.67
|
91.18
|
90.26
|
81.34
|
90.44
|
|
protein
|
91.32
|
91.08
|
91.52
|
82.64
|
91.46
|
|
average
|
90.99
|
91.13
|
90.89
|
81.99
|
90.95
|
|
Icon Channel
|
drug
|
88.52
|
90.79
|
86.84
|
77.11
|
88.68
|
|
protein
|
87.77
|
90.31
|
85.94
|
75.64
|
88.22
|
|
average
|
88.14
|
90.55
|
86.39
|
76.38
|
88.45
|
|
GPCR
|
drug
|
84.72
|
86.46
|
83.56
|
69.49
|
82.81
|
|
protein
|
81.97
|
82.99
|
81.33
|
63.95
|
79.71
|
|
average
|
83.35
|
84.72
|
82.44
|
66.72
|
81.26
|
|
Nuclear Receptor
|
drug
|
77.78
|
74.44
|
79.76
|
55.68
|
76.76
|
|
protein
|
76.67
|
80.00
|
75.00
|
53.45
|
77.65
|
|
average
|
77.22
|
77.22
|
77.38
|
54.57
|
77.21
|
Comparison between the proposed model and LPQ descriptor models
To evaluate the impact of PsePSSM algorithm on the proposed model, we compare it with Local Phase Quantization (LPQ) on four benchmark data sets in this section. The LPQ feature extraction algorithm is based on the blur invariance property of the Fourier phase spectrum [18-20] and originally described in the article for texture description by Ojansivu and Heikkila [21]. Table 6 summarizes the cross-validation results generated by LPQ algorithm combined with FwRF classifier on four benchmark data sets. From the table we can see that DTIRF has achieved the best results in all the evaluation indicators including accuracy, sensitivity, precision, MCC and AUC. Detailed five-fold cross-validation results on four benchmark data sets are presented in Supplementary Materials Table S1-S4. In the comparison experiment, we set the same parameters for the FWRF classifier. We can see from the comparison results that PsePSSM algorithm combined with FwRF classifier does helps to improve the performance of the model.
Table 6. Experimental results of the FwRF classifier combined with LPQ algorithm on four benchmark data sets.
|
Data set
|
Method
|
Accu.(%)
|
Sen.(%)
|
Prec.(%)
|
MCC(%)
|
AUC(%)
|
|
Enzyme
|
FwRF+LPQ
|
89.63±0.39
|
89.69±1.82
|
89.64±2.16
|
79.32±0.79
|
89.40±0.98
|
|
DTIRF
|
91.68±0.84
|
90.84±1.68
|
92.39±1.37
|
83.39±1.68
|
91.72±1.06
|
|
Icon Channel
|
FwRF+LPQ
|
83.97±2.32
|
86.93±3.03
|
81.89±3.66
|
68.13±4.54
|
84.66±2.01
|
|
DTIRF
|
88.11±1.01
|
90.30±1.61
|
86.57±2.29
|
79.02±1.55
|
88.27±1.36
|
|
GPCR
|
FwRF+LPQ
|
82.52±2.17
|
83.87±3.58
|
81.79±3.78
|
65.19±4.15
|
83.19±1.79
|
|
DTIRF
|
84.72±1.94
|
84.73±3.45
|
84.73±4.21
|
74.06±2.68
|
85.57±2.28
|
|
Nuclear Receptor
|
FwRF+LPQ
|
66.67±7.35
|
67.64±16.23
|
67.97±9.98
|
35.46±10.89
|
69.56±6.85
|
|
DTIRF
|
78.33±5.34
|
81.97±7.85
|
78.08±12.56
|
65.56±6.05
|
75.31±5.87
|
Comparison between FwRF and SVM classifier models
As the most versatile Support Vector Machine (SVM) classifier has been widely used by various problems. In order to estimate DTIRF clearly, we compare the results of DTIRF and SVM classifier model on the same data set. The SVM parameters are determined by grid search, and finally set the value of c to 0.5 and the value of g to 0.6. The results of the SVM classifier optimization can be viewed in the supplementary materials table S9. From the table we can see that DTIRF has achieved excellent results on the four benchmark balance data sets. Among the evaluation parameters Accuracy, sensitivity, MCC and AUC, DTIRF have achieved the highest results, and DTIRF on precision is only slightly lower than that of SVM model in Enzyme and Icon Channel data sets. Detailed five-fold cross-validation results on four benchmark data sets are presented in Supplementary Materials Table S5-S8. This result indicates that the FwRF classifier is suitable for the proposed model and can effectively improve the performance of the model.
Table 7. Experimental results of the SVM classifier model on four benchmark data sets
|
Data set
|
Method
|
Accu.(%)
|
Sen.(%)
|
Prec.(%)
|
MCC(%)
|
AUC(%)
|
|
Enzyme
|
PsePSSM +SVM
|
84.20±0.60
|
69.90±1.70
|
98.00±0.50
|
71.50±1.00
|
84.30±1.20
|
|
DTIRF
|
91.68±0.84
|
90.84±1.68
|
92.39±1.37
|
83.39±1.68
|
91.72±1.06
|
|
Icon Channel
|
PsePSSM +SVM
|
81.90±1.20
|
69.70±3.70
|
92.40±2.20
|
66.00±1.90
|
81.70±1.20
|
|
DTIRF
|
88.11±1.01
|
90.30±1.61
|
86.57±2.29
|
79.02±1.55
|
88.27±1.36
|
|
GPCR
|
PsePSSM +SVM
|
70.00±2.10
|
50.40±7.80
|
82.30±3.30
|
42.80±4.90
|
70.10±2.70
|
|
DTIRF
|
84.72±1.94
|
84.73±3.45
|
84.73±4.21
|
74.06±2.68
|
85.57±2.28
|
|
Nuclear Receptor
|
PsePSSM +SVM
|
63.30±3.60
|
57.60±7.90
|
67.50±14.60
|
29.60±7.40
|
61.80±5.80
|
|
DTIRF
|
78.33±5.34
|
81.97±7.85
|
78.08±12.56
|
65.56±6.05
|
75.31±5.87
|
Comparison with existing methods
The prediction of the relationship between drugs and targets has drawn increasing interest of researchers. So far, a lot of excellent computational approaches have been designed. To better verify the proposed approach, we compare it with other existing methods using five-fold cross-validation on the same benchmark data sets. Table 8 lists the details of other excellent methods and DTIRF on four benchmark data sets in terms of the AUC. It is seen that the results obtained by DTIRF on Enzyme data set are significantly higher than those of other existing methods, and the results achieved on Icon Channel and GPCR data sets by DTIRF only lower than the highest result 0.73% and 0.13%. The performance of DTIRF on Nuclear Receptor data set is not very good, it may be because the sample number of the Nuclear Receptor data set is too small, and the training of the classifier is not sufficient
Table 8. Performances of other excellent methods and DTIRF on four benchmark data sets in terms of the AUC.
|
Data set
|
DTIRF
|
KBMF2K [22]
|
NetCBP [23]
|
SIMCOMP[24]
|
RFDT[25]
|
|
Enzyme
|
0.9172
|
0.832
|
0.8251
|
0.863
|
0.915
|
|
Icon Channel
|
0.8827
|
0.799
|
0.8034
|
0.776
|
0.890
|
|
GPCR
|
0.8557
|
0.857
|
0.8235
|
0.867
|
0.845
|
|
Nuclear Receptor
|
0.7531
|
0.824
|
0.8394
|
0.856
|
0.723
|
Case study
To further validate DTIRF's ability to predict potential DTI, we use all known interactions to train the model and then predict unknown interactions. We selected 10 drug-target pairs with the highest predictive score to validate in SuperTarget [26]. SuperTarget is a database that collects drug-target relations and currently stores 332,828 DTIs. As shown in Table 9, 7 of the top 10 predicted highest scores were confirmed. This result indicates that DTIRF can effectively predict the potential DTIs. It is worth noting that although we have not found evidence of the interaction of the remaining 3 drug-target pairs, we can not completely deny the possibility of their interactions.
Table 9.The top 10 new predicted interactions by DTIRF
|
Drug ID
|
Drug name
|
Taregt protein ID
|
Target protein name
|
Validation source
|
|
D00691
|
Dihydroxypropyltheophylline
|
hsa5150
|
PDE7A_HUMAN
|
SuperTarget
|
|
D00348
|
Isotretinoino
|
hsa6256
|
RXRA_HUMAN
|
SuperTarget
|
|
D00139
|
Xanthotoxine
|
hsa1543
|
CP1A1_HUMAN
|
SuperTarget
|
|
D02340
|
Loxapinsuccinate
|
hsa1812
|
DRD1_HUMAN
|
SuperTarget
|
|
D00493
|
Prochlorpermazine
|
hsa3356
|
5HT2A_HUMAN
|
unconfirmed
|
|
D00542
|
Bromochlorotrifluoroethane
|
hsa1571
|
CP2E1_HUMAN
|
SuperTarget
|
|
D00585
|
Mifepristone
|
hsa2099
|
ESR1_HUMAN
|
SuperTarget
|
|
D00454
|
Olanzapine
|
hsa1813
|
DRD2_HUMAN
|
unconfirmed
|
|
D03365
|
Transdermal Nicotine
|
hsa1137
|
ACHA4_HUMAN
|
SuperTarget
|
|
D00106
|
Epoprostenol
|
hsa5733
|
PE2R3_HUMAN
|
unconfirmed
|