Background The opiorphin family of genes (represented in humans by ProL1, hSMR3A and hSMR3B) encode peptides which act as potent neutral endopeptidase (NEP) inhibitors. Because modulated NEP activity is associated with cancer development, several years ago a review postulated that dysregulated opiorphin expression may be involved in oncogenesis. This has recently been supported by reports associating changes in expression of opiorphin-encoding genes with breast and oropharyngeal cancer. Based on these reports, we initiated the studies described here to determine if opiorphin-encoding genes play a role in prostate cancer (PrCa).Methods We screened publicly available data bases for evidence of an association between PrCa and opiorphin gene expression and then confirmed these findings using PrCa tissue arrays. Cell-lines representing early (LNCaP) and late stage (PC3) PrCa were engineered to overexpress ProL1 and the growth of xenografted tumors from these lines compared to parent cell lines in male and female nude mice. The changes in global gene expression caused by overexpression of ProL1 in these cell lines was determined by RNA-Seq to identify possible genetic mechanisms related to growth and progression of PrCa.Results Two datasets available on GEO showed an association between upregulation of opiorphin-encoding genes and PrCa, which was confirmed using tissue arrays. Xenografted tumors derived from PC3 engineered to overexpress ProL1 had an initial growth advantage over parent cell lines whilst tumors derived from LNCaP cells overexpressing ProL1 had impaired growth in female mice. Global gene expression analysis suggested that overexpression of ProL1 causes modulated expression of genes involved in signaling, angiogenesis and steroid response pathways. These pathways might be involved in overcoming the hypoxic barrier of the growing tumor and the development of androgen insensitivity.Conclusions This is the first report to show an association between upregulation of opiorphin-encoding genes and PrCa and that their overexpression in PrCa cell-lines modulates tumor growth in mouse xenograft models. Overexpression of opiorphin-encoding genes modulates genetic pathways that previous reports have associated with PrCa growth, suggesting possible genetic mechanisms for tumor development.
Research article
Investigating the role of opiorphin genes in prostate cancer and the possible genetic mechanisms by which they modulate tumor growth and androgen-sensitivity
https://doi.org/10.21203/rs.2.15829/v1
This work is licensed under a CC BY 4.0 License
Version 1
posted
You are reading this latest preprint version
Prostate Cancer
opiorphin
ProL1
hSMR3A
hSMR3B
xenograft
hypoxia
androgen-sensitivity.
Prostate cancer (PrCa) is the most prevalent of all cancers in men in the United States and the second most common cause of all cancer deaths. Despite high long-term survival rates with localized PrCa, metastatic PrCa remains largely incurable, even after intensive multimodal therapy (1). Identifying novel molecular markers of PrCa and their involvement in genetic mechanisms leading to tumor growth and progression may lead to new therapeutic strategies to prevent and treat PrCa. Based on recent reports that dysregulated expression of opiorphin-encoding genes are associated with some cancers we initiated the present studies to determine if they might also play a role in PrCa.
In humans, the opiorphin family genes are represented by ProL1, hSMR3A and hSMR3B, which are highly homologous genes that have neighboring genomic locations on chromosome 4 (cytogenetic location: 4q13.3) and have coregulated expression. Of the family of opiorphin-encoding genes, ProL1 has been the most studied in the determination of their molecular and biochemical functions. The genes encode pre-proteins that are post-translationally processed to generate a bioactive pentapeptide, opiorphin, which acts as a potent endogenous neutral endopeptidase (NEP) inhibitor (2). Because changes in NEP activity are associated with cancer development, a review article published in 2015 suggested that because opiorphin is an NEP inhibitor, it may play a role in cancer. This has been supported by several recent reports associating dysregulated expression opiorphin-encoding genes with cancer. Upregulated ProL1 expression was observed in invasive multifocal/multicentric compared to unifocal breast cancer (3) and increased hSMR3A expression was associated with unfavorable survival outcomes following surgery for oropharyngeal squamous cell carcinoma (4, 5). With the exception of a brief conference report from our laboratory (6), there are no published reports associating dysregulated expression of opiorphin-encoding genes with PrCa.
In addition to their activity as NEP inhibitors, members of opiorphin-encoding gene family have also been shown to play a role in the hypoxic response. For example, the rat homologue of ProL1, vcsa1, is upregulated in corporal smooth muscle cells in response to hypoxia, where it acts as a “master regulator” of the hypoxic response. Since the metabolic demands of growing tumors creates a growth limiting hypoxic microenvironment(7-9) this might be expected to result in upregulation of ProL1 which may then play a role in PrCa by overcoming the limits in tumor size imposed by the hypoxic barrier. Given reports suggesting hypoxia may be a driver of malignant progression (10), ProL1 might also be a factor in development of castration-resistant/androgen-insensitive PrCa.
In the present report we demonstrate that upregulated expression of opiorphin-encoding genes are associated with human PrCa and confirmed that ProL1 overexpression modulates the growth of mouse xenografted PrCa tumors. Global gene expression analysis on the effects of overexpressing ProL1 in PrCa cell-lines suggested possible genetic mechanisms by which ProL1 modulates tumor growth and androgen-sensitivity consistent with its known biochemical and functional activities as an NEP inhibitor and master regulator of the hypoxic response.
Identification of upregulated ProL1 expression in prostate cancer
An initial screen was conducted of publicly available gene expression datasets on the Gene Expression Omnibus (GEO) profiles database at NCBI (11) to determine if there was prior but unregognized evidence of an association between modulated expression of opiorphin encoding genes and PrCa. Using the search term “prostate cancer” identified 79 datasets. However, only 6 of these data sets allowed both gene expression comparison between benign and cancerous prostate cancer tissue and included the opiorphin-encoding genes ProL1, hSMR3A or hSMR3B. These 6 datasets were analyzed using the NCBI online data analysis tool (GEO2R) to compare expression of ProL1 (referred to as OPRN is this data set), hSMR3A and hSMR3B between cancerous and non-cancerous prostate tissue.
In order to confirm the upregulation of ProL1 in PrCa, a cDNA array from normal and cancerous prostate tissue was purchased from OriGene (HPRT103; TissueScanTM cDNA Arrays; Rockville, MD, USA). This array has 48 samples covering 9-normal and 18-Stage II, 19-III and 2-IV PrCa. Quantitive RT-PCR analysis of the ProL1 transcripts was performed as described below.
Cell-lines
PC3 (NCI-PBCF-CRL1435 (PC-3)/ATCC®CRL-1435™) and LNCaP clone FGC (NCI-PBCF-CRL1740 (LNCaP Clone FGC)/ATCC® CRL-1740™; hereafter termed LNCaP) prostate cancer cell-lines were obtained from the American Type Culture Collection (ATCC, Rockville, MD), and maintained in Roswell Park Memorial Institute (RPMI) 1640 medium (Invitrogen, Carlsbad, CA) with 10% Fetal Calf Serum (Thermo Fisher Scientific, Waltham, MA), supplemented with 100 U/ml penicillin G and 100 ng/ml streptomycin (Invitrogen). All cell-lines were passaged at 2–3 day intervals on reaching 70% confluency using a 0.25% Trypsin-EDTA solution (Thermo Fisher Scientific). Cell morphology and viability were monitored by microscopic observation and regular Mycoplasma testing was performed (Universal Mycoplasma Detection Kit; ATCC).
Generation of ProL1 overexpressing cell-lines
PC3 and LNCaP cells (as described above) were transduced with commercially available human ProL1 lentiviral particles (Origene Technologies, Rockville, MD) according to manufacturers’ protocol. The transduced cell-lines were designated PC3-ProL1+ and LNCaP-ProL1+. RNA seq data indicated ProL1 was overexpressed 5 995-fold in PC3-ProL1+ (see Supplemental Table 1) and 28 560-fold in LNCaP-ProL1+ (Supplemental Table 2) compared to their respective parent cell-lines.
Mice Xenograft stuies
All animal studies were conducted in accordance with the Animal (Scientific Procedures) Act 1986 and approved by the Institutional Animal Care and Use Committee (IACUC) of Albert Einstein College of Medicine. Athymic nude (homozygous, nu/nu aged 8-12 weeks) male and female mice (Charles River Laboratories, Wilmigton, MA) were housed under standard pathogen-free conditions at a maximum of four mice per cage. Tumours were established by subcutaneous injection on the upper left flank of nude mice randomly ascribed to groups that received PC3, PC3-ProL1+, LNCaP or LNCaP-ProL1+ cells in a 1:1 mixture of Matrigel (Corning Life Science, Teterboro, NJ) and HBSS using a 27-gauge needle. For PC3 and PC3-ProL1+ cell-lines, 1.5 x 10⁶ cells, and for LNCaP and LNCaP-ProL1+ cell-lines, 2.5 × 10⁶ cells were injected. The numbers of animals in each group are described in the Figure legends. Tumors were measured twice a week using Vernier Calipers and volume (mm3) calculated by length × width × height × 0.52. When tumors reached a diameter > 1 cm mice were euthanized through inhalation of CO2 to effect.
RNA Isolation
To prepapre total RNA from in vitro experimental samples to be used for quantitive-RT-PCR or RNA-seq analysis was isolated with the RNeasy Plus Mini Kit (Qiagen, Hilden, Germany) following the manufacturers’ protocol. To prepare total RNA from xenografted tumors for quantitive-RT-PCR analysis, tumors were first flash-frozen in liquid nitrogen and then ground to a homogenate using a pestle and mortar. RNA was isolated from 30 mg of the homogenate using a combination of the TRIzol (Invitrogen) method and the RNeasy Plus Mini Kit (Qiagen).
Quantitative RT-PCR
Generation of cDNA was achieved using the SuperScript III First-Strand Synthesis System (Invitrogen) using 1 µg total RNA as the starting material. For PCR analysis, samples were prepared in a 25 µL reaction mix containing the PowerUp SYBR Green PCR Master Mix (Thermo Fisher). Real-time PCR was performed by the Applied Biosystems 7300 Real Time PCR System (Thermo Fisher) using the standard cycling mode recommended by the PowerUp SYBR protocol (50 ºC for 2 minutes, 95 ºC for 2 minutes, and then 40 cycles of 95 ºC for 15 seconds along with 60 ºC for 1 minute). Commercially available primers were obtained from Qiagen (RPL19, cat. # PCRPPH18637A, ProL1 cat. # PPH10360A and VEGFA cat. # PPH00251C). Quantitative RT-PCR was performed in triplicate for each sample. Data was analyzed using the ∆∆Ct method, with gene expression normalized to 60S ribosomal protein L19 (RPL19) and expressed as the average fold-change relative to controls.
RNA-sequencing (RNA-seq)
Prior to RNA-seq, RNA samples were treated with RNase-free DNase I and then quantified using RiboGreen (Thermo Fisher Scientific, Waltham, MA, USA). RNA integrity number (RIN) was assessed with an Agilent 2100 Bioanalyzer (Agilent, Santa Clara, CA, USA) to ensure each sample had a RIN ≥8. RNA libraries were prepared using the Illumina TruSeq Stranded Total RNA kit, with Ribosomal depletion (Illumina, San Diego, CA, USA). Each library was sequenced using the Illumina HiSeq2500 platform and generated 125 nt paired-end (PE) reads at either 30 million or 60 million reads per sample. RNA-seq analysis of gene expression for each cell-line was performed in triplicate (each sample prepared separately). [Raw sequencing data sets will be deposited in the Sequence Read Archive of NCBI (http://www.ncbi.nlm.nih.gov/sra) upon acceptance of this publication with accession number included here)]
Bioinformatics analysis
The reads were aligned with STAR (version 2.4.0c) (12) and genes annotated in Gencode v18 were quantified with featureCounts (v1.4.3-p1)(13). Normalization and differential expression analyses were performed with the Bioconductor package DESeq2 (14). Differentially expressed gene (DEG’s) were assessed using a two-sided t-test and fold-change on log-transformed expression values. All samples were median centered. Cut-off criteria for DEG was >1 log2-fold or <-1 log2-fold change in gene expression with a p-value <0.01.
Gene ontology (GO) annotation analysis of differentially expressed genes (DEG) was performed using online analysis tools available from the database for annotation, visualization and integrated discovery (DAVID, vers 6.8, Homo sapien GOTERM_GO_Direct database (15, 16)), the Gene Ontology Consortium (GOC, Homo sapien, biological function database (17, 18)) and the Kyoto Encyclopedia of Genes and Genomes database (KEGG, (19-21)).
Statistical analyses
Statistical analyses were performed using either Microsoft Excel (Microsoft, Seattle, WA) or Prism 8.2. (GraphPad Software, Inc., La Jolla, CA). To determine statistical significance of two group comparisons, unpaired, two-tailed t-tests were performed, and results reported in Tables and Figures. Error bars represent standard error of mean or standard deviation (as described in figure legends).
ProL1 is overexpressed in prostate cancer
Of the 6 data sets available data sets on the GEO database that were suitable for our analysis, 2 demonstrated a significant associateion between PrCa and opiorphin-encoding genes (Table 1).
DataSet GSE55945 was generated from a study aimed at identifying novel biomarkers and immunotherapy targets for PrCa (22) and contained 8 normal (benign) prostate tissue samples and 13 prostate cancer tissues (sub-divided into ERG fusion positive (N=6) and ERG fusion negative (N=7) PrCa). As shown in Table 1, comparing the 8 normal prostate tissue samples and 13 prostate cancer tissues and using a p-value of <0.05 to define significance, PrCa was associated with overexpression of both ProL1 and hSMR3A. When the group of prostate cancer tissues was sub-divided into ERG fusion positive and ERG fusion negative PrCa, there was a greater significance and fold-increase of ProL1 expression in ERG fusion positive PrCa tissue compared to non-cancerous prostate tissue (2.25-fold, p-value 9.7x10⁻⁴) than when the same analysis was performed with ERG fusion negative PrCa tissue (2.16-fold, p-value 1.3x10⁻²).
Dataset GSE3325 (23) was generated in a study to identify the genetic signatures of metastatic progression and contained 6 samples from normal (benign) prostate tissue samples and 13 PrCa tissues (sub-divided into localized (N=6) and metastatic (N=7) PrCa). As shown in Table 1, PrCa was associated with overexpression of hSMR3B, with a trend for greater overexpression with progression from localized to metastatic disease, from 5-fold (p-value 0.0035) to 9.32-fold, (p-value 0.00038), respectively.
Given that ProL1 has been the most intensily studied memebr of the opiorphin gene family, we focused on this gene as represetative of the opiorphin family. Figure 1A shows the relative expression levels of Prol1 determined in a tissue cDNA array containing human non-cancerous and cancerous (at different stages) prostate tissue. This data, shown in Figure 1B, is consistent with the microarray analysis and demonstrates that ProL1 is overexpressed in PrCa tissue, with a trend for higher levels of expression as the cancer stage increased.
Xenografted tumors derived from PC3 cell show time-dependent increase in the expression of ProL1 and VEGFA
Expression levels of two markers of the hypoxic response, ProL1 and VEGFA, were compared between the PC3 cell-line (isolated from castration-resistant/androgen-insensitive PrCa) prior to injection and in tumors derived from this cell-line at 2- and 4-weeks post-injection into nude male mice. As shown in Figure 2, the PC3-derived tumors showed a progressive and significant increase in both ProL1 and VEGFA expression, such that the 4-week old tumors had approximately a 20-fold increase in ProL1 expression, and approximately a 3.2-fold increase in VEGFA expression, compared to the levels of these genes in the parent PC3 cell-line.
Xenografted tumors derived from a PC3 cell-line engineered to over-express ProL1 (PC3-ProL1+) initially exhibit accelerated growth compared to its parent cell-line in male nude mice
In order to determine if overexpression of ProL1 might directly affect PrCa tumor growth we compared the growth of xenografted tumors in male and female nude mice derived from a PC3 cell-line genetically engineered to overexpress ProL1 (PC3-ProL1+) with its parent cell-line (PC3). As can be seen in Figure 3, in male nude mice at early stages of tumor detection (at 10- and 13- days post-implantation), there was a significantly greater rate of tumor growth in mice implanted with PC3-ProL1+ compared to PC3. However, at later time-points (from 17-days onwards) in the male mice, and at any time-point in female nude mice, there was no significant size difference in the tumors derived from PC3-ProL1+ or parent PC3 cells (data not shown).
Overexpression of ProL1 in PC3 cells modulates expression of genes associated with the hypoxic response
In order to identify possible genetic mechanisms by which upregulated ProL1 expression in PC3 cells might modulate tumor growth, we compared global gene expression between PC3 and PC3-ProL1+ cell-lines. This analysis identified 1 698 DEG’s between the two cell lines (Supplemental Table 1) with ProL1 being the most DEG (5 995-fold, p-value 2.82 x 10⁻²⁶). To identify biological functions that may be regulated through overexpression of ProL1 in PC3 cells, the list of DEG’s (minus ProL1) was submitted to the DAVID, GOC and KEGG databases, which identified 1 250, 1 366 and 480 unique genes within each database, respectively, which were then used for ontological analysis. The most significant, broadly defined, functional ontologic groups with over-representation of DEG’s were involved in morphogenesis and signal transduction (Supplemental Tables 3 and 4). For example, there was over-representation of DEG’s in the ontological groups “anatomical structure development/morphogenesis” (GOC: GO:0048856 and GO:0009653, p-value 2.05x10⁻²² and 2.21x10⁻²⁰, respectively, and more specifically “prostate gland morphogenesis” GOC: GO:0060512, p-value 6.39x10⁻⁴), “extracellular matrix organization” (DAVID: GO:0030198, 1.54x10⁻⁹), “signaling” (GOC: GO:0023052, p-value 3.35 x 10⁻¹⁴) and “signal transduction” (DAVID: GO:0007165, p-value 4.29x10⁻⁵). In Table 2 we present the more defined ontologic groups where there was significant over-representation of DEG’s. Both DAVID and GOC analysis identified DEG’s in ontological groups involved in vascularization (such as genes involved in angiogenesis, blood vessel development, organ growth and morphogenesis) and also groups that function in hypoxia and direct modulation of blood flow (such as genes involved in over-coming hypoxia, vasodilation, blood vessel diameter and regulation of smooth muscle contraction). Analysis of the list of DEG’s using the KEGG database identified the ontologic group “pathways in cancer” as having the greatest number of DEG’s (41 genes, p-value 8.96x10⁻³) (Supplemental Table 5). DEG’s were also identified with significant overrepresentation in specific biochemical pathways, such as the P13K-Akt, VEGF and MAPK signaling pathways and steroid metabolic pathways (Table 2).
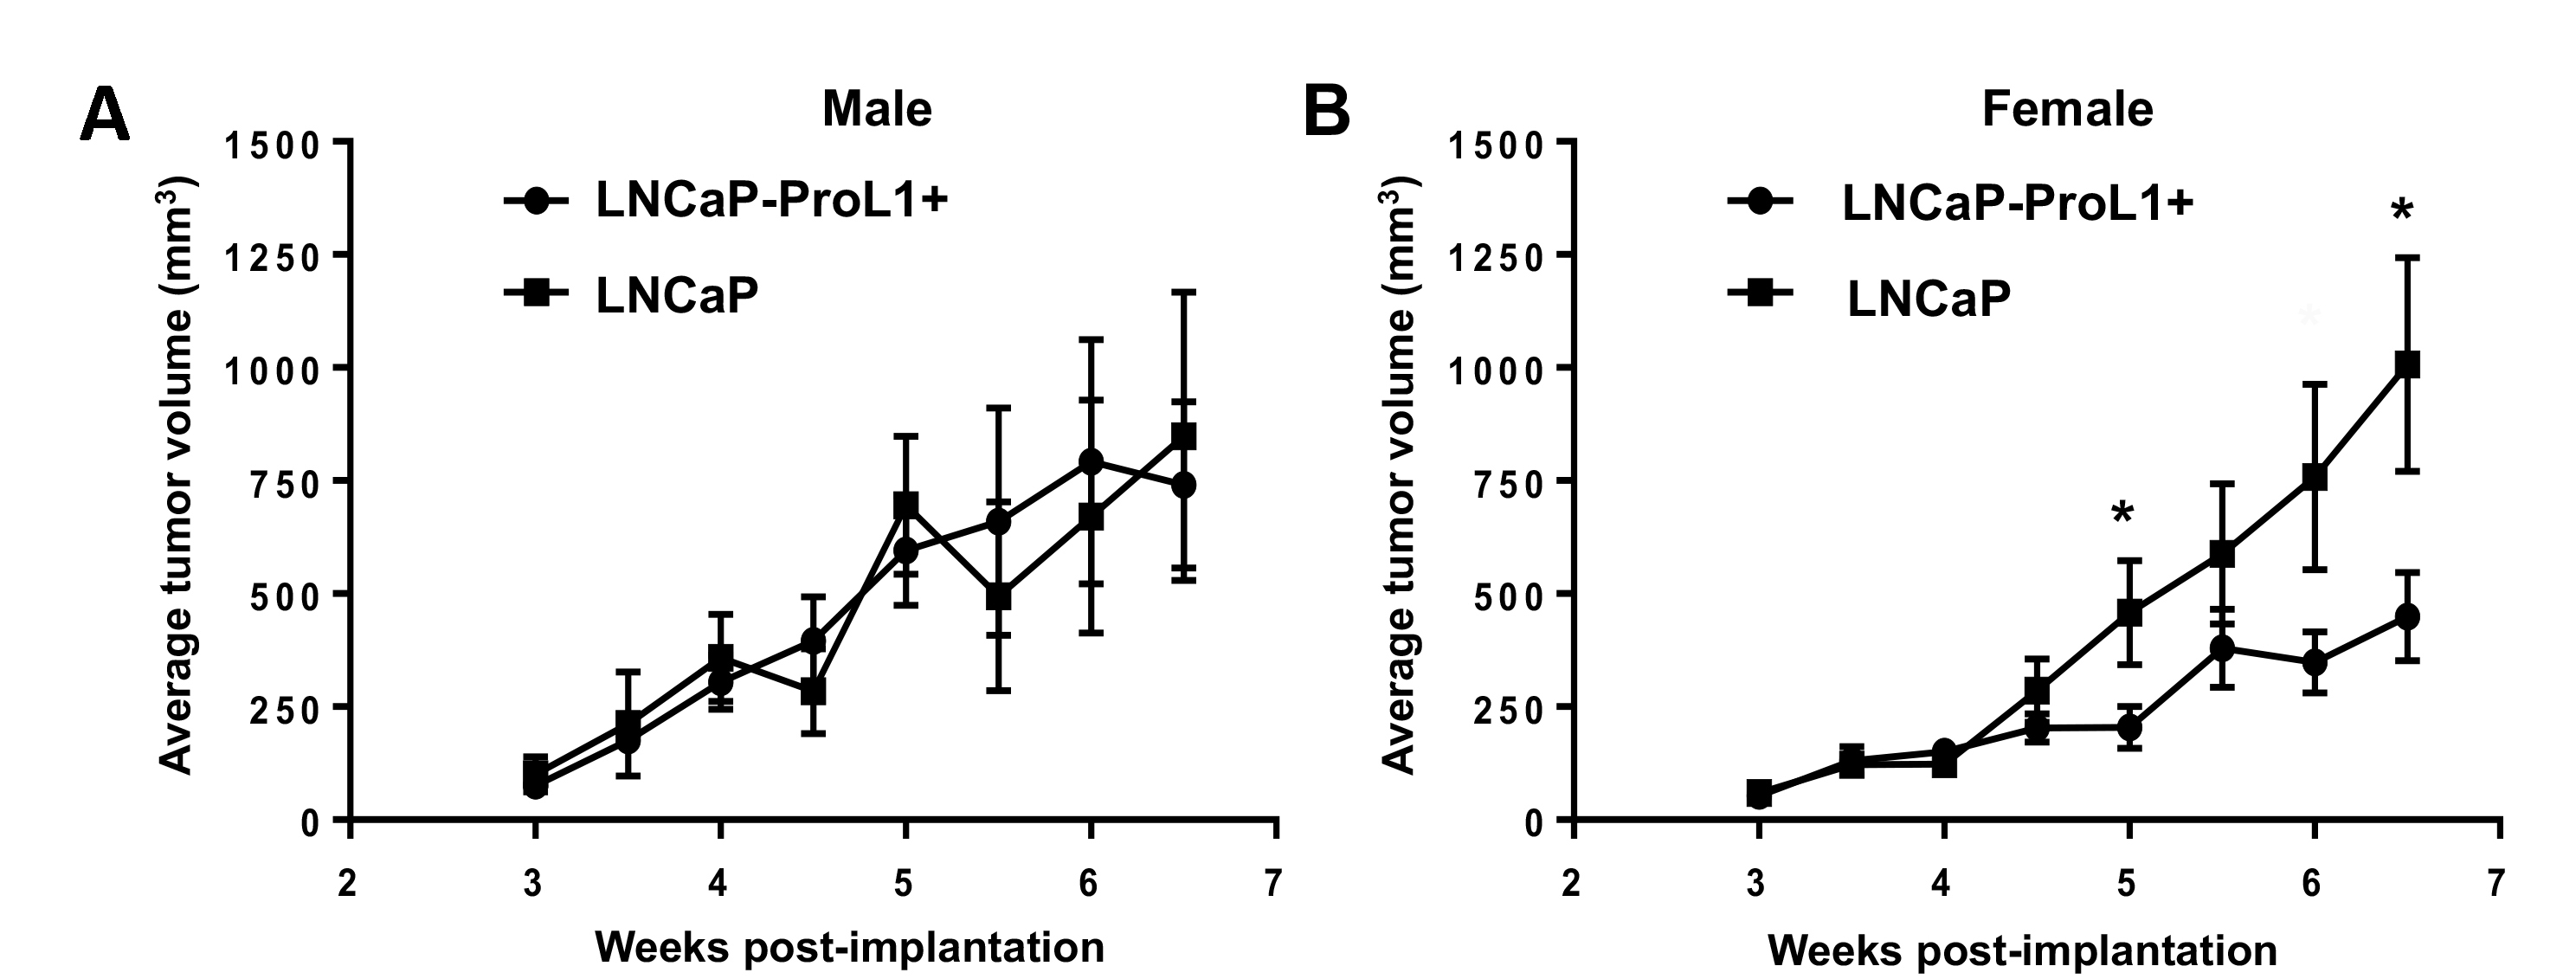
Xenografted tumors derived from LNCaP cells engineered to over-express ProL1 (LNCaP-ProL1+) have gender-specific modulated growth compared to its parent cell-line.
The PC3 cell-line used in the preceding experiments was isolated from advanced stage, castration-resistant/androgen-independent PrCa. In order to determine if upregulated ProL1 expression might also play a role in earlier stages of PrCa growth, we compared the growth of xenografted tumors in nude male and female mice derived from LNCaP cells (isolated from androgen-sensitive PrCa) engineered to over-express ProL1 (LNCaP-ProL1+) with tumors derived from its parent cell-line (LNCaP). Similar to previous studies (24), xenografted tumors derived from LNCaP are more rapidly established in male compared to female nude mice (the LNCaP tumor size at 4-weeks post-implantation is significantly greater in male compared to female mice, Figure 4A). We also observed (as previously reported (24)) that once LNCaP tumors are established their growth rate is not significantly different between male and female mice (Figure 4A). However, overexpression of ProL1 in LNCaP cells significantly modulated these gender specific growth characteristics. LNCaP-ProL1+ derived tumors have a significantly impaired growth rate in female compared to male mice (Figure 4B). Although there was no significant difference in growth rate of tumors derived from LNCaP-ProL1+ or LNCaP in male mice (Supplemental Figure 1A), there was significantly impaired growth of tumors derived from LNCaP-ProL1+ compared to tumors derived from LNCaP in female mice (Supplemental Figure 1B). Therefore, the observed gender specific differences in xenografted tumor growth caused by overexpression of ProL1 is primarily mediated by impairing LNCaP tumor growth in female mice, rather than conferring a growth advantage in male mice. This contrasts to our observations in PC3 cells, where overexpression of ProL1 conferred (at least during the early time-points following transplant) a growth advantage to xenografted tumors in male mice, but had no effect on growth of tumors in female mice (Figure 3).
Overexpression of ProL1 in LNCaP cells modulates expression of genes associated with steroid metabolism and the androgen response
In order to determine possible mechanisms for the difference in xenografted LNCaP tumor growth when ProL1 is overexpressed, we compared global gene expression between the LNCaP-ProL1+ and its parent cell-line, LNCaP identifying 1 110 DEG’s (Supplemental Table 2). Of these 1 100 DEG’s, 209 were in common with PC3 when ProL1 was overexpressed (Supplemental Table 2). ProL1 was the most DEG (28 560-fold, p-value 24.36 x 10-36). To identify biological functions that may be regulated through overexpression of ProL1 in LNCaP cells, the list of DEG’s (minus ProL1) was submitted to the DAVID, GOC and KEGG databases, identifying 665, 812 and 287 unique genes within each database, respectively, which were then used for ontological analysis. Although the analysis identifed fewer ontologic groups with significant overrepresentation of DEG’s caused by ProL1 overexpression in LNCaP compared to PC3 cells, many these ontologic groups were the same, or served similar functions (Supplemental Tables 6-8). In common with PC3, ProL1 overexpression regulated gene expression in ontological groups involved in morphogenesis and signal transduction (Supplemental Tables 6 and 7). For example, there was over-representation of genes in the ontological groups “anatomical structure development/morphogenesis” (GOC: GO:0048856/GO:0009653, p-value 2.76x10⁻⁸ and 2.09x10⁻⁸, respectively), “cell-cell signaling” (GOC: GO:0007267, p-value 1.46x10⁻¹⁰ and DAVID: GO 0007267, p-value 6.00x10⁻³) and “signal transduction” (GO:0007165, p-value 2.66x10⁻⁴). DEG’s were also overrepresented in more definded ontological groups potentially involved in vascularization (angiogenesis, circulatory system development and organ morphogenesis) and regulation of blood flow (smooth muscle contraction and blood pressure) (Table 3). Analysis for overrepresentation of DEG’s in biochemical pathways using the KEGG database, also identified similar effects caused by overexpression of ProL1 in PC3 and LNCaP cells (Supplemental Table 8). For example, overexpressing ProL1 regulated genes that were significantly over-represented in the ontologic groups “pathways in cancer” (p-value 5.97x10⁻²,), steroid metabolism and the regulation of MAPK signaling (Table 3).
However, there were differences in the regulation of specific genes related to the androgen response between LNCaP and PC3. Unlike PC3, where overexpression of ProL1 caused a significant increase in expression of the androgen receptor gene (AR, 7.46-fold, p-value 3.16x10-197) and a decrease in expression of the estrogen receptor (ESR1, 2.7-fold reduced, p-value 3.38x10-49), in LNCaP neither of these genes were changed in expression (Supplemental Table 1 and 2). In contrast, overexpression of ProL1 in LNCaP reduced expression of the progesterone receptor gene (PGR, 2.17-fold reduced, p-value 4.41x10⁻³), whereas PGR expression was not changed in PC3 cells.
This is the first report associating elevated expression levels of opiorphin-encoding genes with the development of human PrCa. Our data suggests that expression levels of the opiorphin-encoding genes correlate with PrCa progression. As shown in Table 1 there is a much greater significance of elevated ProL1 expression in ERG-fusion positive PrCa (which is generally considered to represent a more advanced stage PrCa (25)) compared to ERG-fusion negative PrCa (Table 1) and a trend for higher levels of ProL1 with cancer stage (Figure 1D). Also shown in Table 1 there was over-expression of the ProL1 homologue, hSMR3B, in localized PrCa compared to non-cancerous prostate tissue (5-fold, p-value 0.0035), with greater over-expression in metastatic PrCa compared to non-cancerous prostate tissue (9.32-fold, p-value 0.00038). Although other DataSets did not show significant differences in expression of opiorphin encoding genes in cancerous compared to non-cancerous prostate tissue samples, this may be a result of differences in sample preparation. It has been shown that many PrCa DataSets have significant stromal contamination which has a tendency to mask epithelial gene expression across PrCa profiling studies (26).
We also demonstrate that there is significantly modulated growth of xenografted tumors derived that PrCa cell-lines engineered to overexpress ProL1 compared to their parent cell-lines. In PC3 cells (isolated from castration-resistant/ androgen-insensitive PrCa) overexpression of ProL1 increases the growth rate of xenografted tumors in nude male mice at early time-points post-transplantation (Figure 3), whereas in LNCaP cells (isolated from androgen-sensitive PrCa) overexpression of ProL1 impairs the growth of xenografted tumors in nude female mice (Figure 4). As discussed in more detail below, comparing global gene expression in cell-lines overexpressing ProL1 with their parent cell-lines suggests possible genetic mechanisms by which ProL1 overexpression might modulate the growth rate of PrCa tumors.
In order to gain insight into the possible genetic mechanisms by which upregulated ProL1 modulates PrCa growth, we compared global gene expression between PrCa cell-lines engineered to over-express ProL1 and their parent cell-lines. Overexpression of ProL1 resulted in relatively large numbers of genes being identified as significantly differentially expressed in both PC3 and LNCaP cell-lines (1 698 and 1 110, respectively). There was both a lower total number and average fold-change in DEG’s when ProL1 was overexpressed in LNCaP compared to PC3. For example, the average fold-change of the top 250 most upregulated DEG’s in PC3 was 11.2-fold and in LNCaP, 3.49-fold (p-value <1x10⁻⁵). The differences in numbers and fold-change caused by ProL1 overexpression in the two cell-lines may arise because of a greater intrinsic choromosome instability reported for PC3 relative to LNCaP, resuting in increased copy numbers of genes in PC3 (27). This would result in a proportionately greater change in the expression levels of genes regulated by ProL1 in PC3 compared to LNCaP aswell as increasing the number of the total number of significant DEG’s.
Ontologic analysis of the genes regulated by ProL1 in PC3 cells demonstrated that it primarily affects genetic pathways involved in morphogenesis and signalling (Supplemental Tables 3-5, and Table 2). Since ProL1 encodes opiorphin, a potent endogenous NEP inhibitor, its overexpression would be expected to inhibit the break-down of signal petides bound to their receptors, effectively increasing their half-lives. Therefore, the genes changed in expression within the ontologic groups related to signalling likely represent compensatory genetic pathways to dampen signalling pathways. In a previous study on rat corporal smooth muscle cell-lines, knock-down of vcsa1 (a rat ProL1 homologue, encoding an opiorphin homologue that functions as a potent NEP inhibitor) resulted in modulated expression of several genes in the G-protein coupled receptor (GPCR) family (28). This effect was proposed to be a compensatory mechanism to increased NEP activity, leading to shorter half-lives of signal peptides bound to their GPCR’s.
The regulation of genes involved in morphogensis by ProL1 may represent a genetic mechanism for the initial growth advantage in male mice of xenografted tumors derived from PC3-ProL1+ compared to PC3. By priming genetic pathways involved in the reorganization of tissues that increase local blood supply, tumors may more rapidly overcome the hypoxic barrier in the microenvironment generated through the metabolic demands assocaited with PrCa growth. Within the broad functional groups related to morphology there was significant over-representation of ProL1-regulated genes in more specific ontologic groups involved in angiogenesis, blood vessel development and vascularization. In addition, ProL1 overexpression also regulated genes in ontologic groups that might directly regulate blood flow to the tumor, such as vasodilation, blood vessel diameter and smooth muscle contraction. Evidence from previous studies has demonstrated that opiorphin-encoding genes act as “master regulators” of the hypoxic response in rat corporal smooth muscle cells (29, 30), regulating the expression of genes involved in angiogenesis and vascular smooth muscle tone. The data presented here would suggest that in PrCa cells, the expression of genes known to be involved in the hypoxic response are also regulated by Prol1.
ProL1 overexpression in PC3 cells had a significant effect on expression of genes in the PI3K-Akt signaling pathway (Table 2). The PI3K-Akt signaling pathway is considered one of the most commonly dysregulated pathways in PrCa. Approximately 40% of early stage, and 70–100% of advanced stage PrCa, exhibit dysregulation of this pathway, suggesting PI3K-Akt dysregulation is associated with PrCa progression (31-33). Furthermore, there is a direct connection between the PI3K-Akt pathway and androgen receptor (AR) signaling, which is also dysregulated with progression and development of castration resistant PrCa(31, 34). In PC3-ProL1+ cells we observed not only changes in the expression of genes in the PI3K-Akt pathway, but also a significant upregulation of the AR (7.46-fold, p-value 3.16x10-197, Supplemental Table 1). Increased activity of the AR could subsequently lead to the activation of secondary messengers involved in modulating the activity of other signaling pathways, such as the MAPK pathway, which was identified as having significant over-representation of DEG’s with ProL1 overexpression.
Similar to PC3, when ProL1 was overexpressed in LNCaP cells it also modulated expression of genes significantly over-represented in ontologic groups related to morphogensis and signaling (Supplemental Tables 6-8 and Table 3). As discussed above, compared to PC3, overexpression of ProL1 in LNCaP resulted in lower-fold and fewer total genes with changed expression in these ontological groups. Although expression of genes involved in morphogenesis might be expected to confer growth advantages to the developing tumor (as described above for PC3), no significant growth advantage was observed for xenografted tumors derived from LNCaP-ProL1+ compared to LNCaP cells in male mice. The differences in the growth of tumors derived from LNCaP compared to PC3 cell-lines overexpressing ProL1 may result from the proportionately greater fold-change in gene expression in PC3 cells, such that in PC3 DEG’s that impact tumor growth reach a threshold level for fold-change in expression that is not attained in LNCaP. Alternatively, given that ProL1 overexpression results in significantly greater numbers of DEG’s in PC3 compared to LNCaP, ProL1 may regulate expression of specific genetic pathways related to tumor growth in PC3, but not LNCaP cell-lines.
ProL1 overexpression in both LNCaP and PC3 cells resulted in overrepresentation of DEG’s involved in steroid metabolism, with the specific genes in these pathways having similar fold-changes and significance in the two cell lines (in contrast to the difference in fold-change and significance when the entire list of DEG’s was compared, as discussed above, Supplemental Table 1 and 2). However, because overexpression of ProL1 caused similar changes in genetic pathways of steroid metabolism in LNCaP and PC3 cell-lines, but only in the case of LNCaP did overexpression of ProL1 impair tumor growth in female mice, the changes in steroid metabolism were considered unlikely to represent a genetic mechanism for the impaired growth rate. Overexpression of ProL1 did however have significant and differential effects on the expression of androgen, estrogen and progesterone receptors in LNCaP and PC3 cells (Supplemental Tables 1 and 2). For example, overexpression of ProL1 in LNCaP reduced expression of the progesterone receptor gene, but had no effect on its expression in PC3 cells. Activation of PGR is a positive modulator of cell division, and its detection correlates with PrCa progression, with 54% of castration-resistant cases having >20% PGR positive cells in tumors(35, 36). Reduced expression of PGR in LNCaP-ProL1 cells would therefore be expected to have a negative effect on tumor growth in female mice.
Our global gene expression analysis on the effects of overexpressing ProL1 in PrCa cell-lines suggest possible genetic mechanisms by which ProL1 modulates tumor growth and androgen-sensitivity, consistent with its known biochemical and functional activities as an NEP inhibitor and master regulator of the hypoxic response. These mechanisms are summarized in Figure 5. The hypoxic barrier to growth developed when tumors reach about 2mm3 would be expected to upregulate ProL1 expression. As shown in Figure 2 xenografted tumors derived from PC3 cell-line do indeed demonstrate progressive upregulation of ProL1 expression. As a master regulator of the hypoxic response, overexpression of ProL1 would then be expected to activate genes involved in the vascularization and regulation of blood supply to the tumor. Our global gene expression studies on the effect of ProL1 overexpression in PrCa cell-lines confirm significant overrepresentation of genes in ontological groups with these functions (Table 2 and 3), which would allow tumors to overcome the hypoxic barrier and allow continued PrCa growth. In addition, overexpression of ProL1 in response to hypoxia may drive malignant progression of PrCa(10, 37) since overexpression of ProL1 was also shown to activate genes involved in steroid metabolism and androgen response which are pathways known to be associated with the progression of tumors to castration resistance/androgen insensitivity.
The studies reported here have focused on ProL1, which represents the best characterized of the opiorphin gene family. Since both hSMR3A and hSMR3B also encode the opiorphin pentapeptide, at least some of the effects of modulated opiorphin gene expression would be expected to be shared in common with ProL1. However, other bioactive peptides are known to be generated by processing of the protein product of ProL1, hSMR3A and hSMR3B, and which might also play roles in the genetic mechanisms by which they modulates tumor growth. As with the other studies associating opiorphin-encoding genes with other forms of cancer, our studies are limited to the transcriptional level, since at present there are no useful antibodies for determine expression of opiorphin or other proteins encoded by the genes.
In conclusion, this is the first report to provide evidence for a role of opiorphin-encoding genes in PrCa. We demonstrate significantly higher expression levels of ProL1 in cancerous, compared to non-cancerous, prostate tissue and that overexpression of ProL1 in PrCa cell-lines modulates tumor growth in mouse xenograft models. We have demonstrated that overexpression of ProL1 modulates genetic pathways that previous reports have associated with PrCa growth and progression and therefore may represent possible genetic mechanisms for the effect of ProL1 on tumor development. However, additional research will be needed to establish that the genetic pathways modulated by ProL1 are actually responsible for changes in tumor growth, and that the DEG’s caused by overexpression of ProL1 in cultured PrCa cells are similar to those in xenografted-tumors.
PrCa, Prostate Cancer; NEP, neutral endopeptidase; GEO, Gene Expression Omnibus; GO, gene ontology; DEG, differentially expressed genes; DAVID, database for annotation, visualization and integrated discovery; GOC, Gene Ontology Consortium; KEGG, Kyoto Encyclopedia of Genes and Genomes.
- Ethics approval and consent to participate
- All animal studies were conducted in accordance with the Animal (Scientific Procedures) Act 1986 and approved by the Institutional Animal Care and Use Committee (IACUC) of Albert Einstein College of Medicine.
- Consent for publication
- Not applicable.
- Availability of data and materials
· [Raw sequencing data sets will be deposited in the Sequence Read Archive of NCBI (http://www.ncbi.nlm.nih.gov/sra) upon acceptance of this publication with accession number included here)] .
·
· Competing interests
· The authors declare that they have no competing interests.
·
· Funding
· Funding for these studies were provided by NIH R01 DK107807 (PI: Kelvin P. Davies).
·
- Authors' contributions
- "AM conducted, analyzed and interpreted data in manuscript and contributed to writing the manuscript. AP conducted, analyzed and interpreted data in manuscript and contributed to writing the manuscript. LW AP conducted and analyzed data in manuscript. KPD conceived of the study, analyzed and interpreted data in manuscript and was the major contributer to writing the manuscript. All authors read and approved the final manuscript.
- Acknowledgements
- We thank Mark Schoenberg, MD, for his initial involvement in discussions in the study conception.
- Authors' information (optional)
- None.
- Wang G, Zhao D, Spring DJ, DePinho RA. Genetics and biology of prostate cancer. Genes Dev. 2018;32(17-18):1105-40.
- Wisner A, Dufour E, Messaoudi M, Nejdi A, Marcel A, Ungeheuer MN, et al. Human Opiorphin, a natural antinociceptive modulator of opioid-dependent pathways. Proc Natl Acad Sci U S A. 2006;103(47):17979-84.
- Lang Z, Wu Y, Pan X, Qu G, Zhang T. Study of differential gene expression between invasive multifocal/ multicentric and unifocal breast cancer. J BUON. 2018;23(1):134-42.
- Koffler J, Holzinger D, Sanhueza GA, Flechtenmacher C, Zaoui K, Lahrmann B, et al. Submaxillary gland androgen-regulated protein 3A expression is an unfavorable risk factor for the survival of oropharyngeal squamous cell carcinoma patients after surgery. Eur Arch Otorhinolaryngol. 2013;270(4):1493-500.
- Grunow J, Rong C, Hischmann J, Zaoui K, Flechtenmacher C, Weber KJ, et al. Regulation of submaxillary gland androgen-regulated protein 3A via estrogen receptor 2 in radioresistant head and neck squamous cell carcinoma cells. J Exp Clin Cancer Res. 2017;36(1):25.
- Mukherjee A, Wang L, Schoenberg M, Davies K. Upregulation of opiorphin is associated with prostate cancer; a potential novel therapeutic target. Urology. 2017;197(4):e1167-e8.
- Carmeliet P, Jain RK. Angiogenesis in cancer and other diseases. Nature. 2000;407(6801):249-57.
- Fox WD, Higgins B, Maiese KM, Drobnjak M, Cordon-Cardo C, Scher HI, et al. Antibody to vascular endothelial growth factor slows growth of an androgen-independent xenograft model of prostate cancer. Clin Cancer Res. 2002;8(10):3226-31.
- Chung LW, Baseman A, Assikis V, Zhau HE. Molecular insights into prostate cancer progression: the missing link of tumor microenvironment. The Journal of urology. 2005;173(1):10-20.
- Rudolfsson SH, Bergh A. Hypoxia drives prostate tumour progression and impairs the effectiveness of therapy, but can also promote cell death and serve as a therapeutic target. Expert Opin Ther Targets. 2009;13(2):219-25.
- Barrett T, Wilhite SE, Ledoux P, Evangelista C, Kim IF, Tomashevsky M, et al. NCBI GEO: archive for functional genomics data sets--update. Nucleic acids research. 2013;41(Database issue):D991-5.
- Dobin A, Davis CA, Schlesinger F, Drenkow J, Zaleski C, Jha S, et al. STAR: ultrafast universal RNA-seq aligner. Bioinformatics. 2013;29(1):15-21.
- Liao Y, Smyth GK, Shi W. featureCounts: an efficient general purpose program for assigning sequence reads to genomic features. Bioinformatics. 2014;30(7):923-30.
- Love MI, Huber W, Anders S. Moderated estimation of fold change and dispersion for RNA-seq data with DESeq2. Genome biology. 2014;15(12):550.
- Huang da W, Sherman BT, Lempicki RA. Systematic and integrative analysis of large gene lists using DAVID bioinformatics resources. Nature protocols. 2009;4(1):44-57.
- Huang da W, Sherman BT, Lempicki RA. Bioinformatics enrichment tools: paths toward the comprehensive functional analysis of large gene lists. Nucleic acids research. 2009;37(1):1-13.
- Ashburner M, Ball CA, Blake JA, Botstein D, Butler H, Cherry JM, et al. Gene ontology: tool for the unification of biology. The Gene Ontology Consortium. Nature genetics. 2000;25(1):25-9.
- The Gene Ontology C. The Gene Ontology Resource: 20 years and still GOing strong. Nucleic acids research. 2019;47(D1):D330-D8.
- Kanehisa M, Furumichi M, Tanabe M, Sato Y, Morishima K. KEGG: new perspectives on genomes, pathways, diseases and drugs. Nucleic acids research. 2017;45(D1):D353-D61.
- Kanehisa M, Sato Y, Furumichi M, Morishima K, Tanabe M. New approach for understanding genome variations in KEGG. Nucleic acids research. 2019;47(D1):D590-D5.
- Yamamoto S, Teng W, Kakiuchi T, Tsukada H. Disturbance of cerebral blood flow autoregulation in hypertension is attributable to ischaemia following subarachnoid haemorrhage in rats: A PET study. Acta neurochirurgica. 1999;141(11):1213-9.
- Arredouani MS, Lu B, Bhasin M, Eljanne M, Yue W, Mosquera JM, et al. Identification of the transcription factor single-minded homologue 2 as a potential biomarker and immunotherapy target in prostate cancer. Clin Cancer Res. 2009;15(18):5794-802.
- Varambally S, Yu J, Laxman B, Rhodes DR, Mehra R, Tomlins SA, et al. Integrative genomic and proteomic analysis of prostate cancer reveals signatures of metastatic progression. Cancer cell. 2005;8(5):393-406.
- Horoszewicz JS, Leong SS, Kawinski E, Karr JP, Rosenthal H, Chu TM, et al. LNCaP model of human prostatic carcinoma. Cancer research. 1983;43(4):1809-18.
- Song C, Chen H. Predictive significance of TMRPSS2-ERG fusion in prostate cancer: a meta-analysis. Cancer cell international. 2018;18:177.
- Tomlins SA, Mehra R, Rhodes DR, Cao X, Wang L, Dhanasekaran SM, et al. Integrative molecular concept modeling of prostate cancer progression. Nature genetics. 2007;39(1):41-51.
- Greene SB, Dago AE, Leitz LJ, Wang Y, Lee J, Werner SL, et al. Chromosomal Instability Estimation Based on Next Generation Sequencing and Single Cell Genome Wide Copy Number Variation Analysis. PloS one. 2016;11(11):e0165089.
- Tong Y, Tiplitsky SI, Tar M, Melman A, Davies KP. Transcription of G-protein coupled receptors in corporeal smooth muscle is regulated by the endogenous neutral endopeptidase inhibitor sialorphin. The Journal of urology. 2008;180(2):760-6.
- Fu S, Tar MT, Melman A, Davies KP. Opiorphin is a master regulator of the hypoxic response in corporal smooth muscle cells. FASEB J. 2014;28(8):3633-44.
- Fu S, Davies KP. Opiorphin-dependent upregulation of CD73 (a key enzyme in the adenosine signaling pathway) in corporal smooth muscle cells exposed to hypoxic conditions and in corporal tissue in pre-priapic sickle cell mice. International journal of impotence research. 2015;27(4):140-5.
- Carver BS, Chapinski C, Wongvipat J, Hieronymus H, Chen Y, Chandarlapaty S, et al. Reciprocal feedback regulation of PI3K and androgen receptor signaling in PTEN-deficient prostate cancer. Cancer cell. 2011;19(5):575-86.
- Edlind MP, Hsieh AC. PI3K-AKT-mTOR signaling in prostate cancer progression and androgen deprivation therapy resistance. Asian journal of andrology. 2014;16(3):378-86.
- Matsumoto K, Suehiro M, Iio M, Kawabe T, Shiratori Y, Okano K, et al. [13C]methacetin breath test for evaluation of liver damage. Digestive diseases and sciences. 1987;32(4):344-8.
- Crumbaker M, Khoja L, Joshua AM. AR Signaling and the PI3K Pathway in Prostate Cancer. Cancers. 2017;9(4).
- Bonkhoff H. Estrogen receptor signaling in prostate cancer: Implications for carcinogenesis and tumor progression. The Prostate. 2018;78(1):2-10.
- Bonkhoff H, Fixemer T, Hunsicker I, Remberger K. Progesterone receptor expression in human prostate cancer: correlation with tumor progression. The Prostate. 2001;48(4):285-91.
- Byrne NM, Nesbitt H, Ming L, McKeown SR, Worthington J, McKenna DJ. Androgen deprivation in LNCaP prostate tumour xenografts induces vascular changes and hypoxic stress, resulting in promotion of epithelial-to-mesenchymal transition. British journal of cancer. 2016;114(6):659-68.
Table 1. The publicly available datasets GSE55945 and GSE3325 were analyzed using the GEO2R online tool to compare expression of opiorphin encoding genes (ProL1, hSMR3A and hSMR3B) between cancerous and non-cancerous prostate tissue samples.
|
Comparison |
Gene |
p-value |
logFC |
Fold Change |
|
Dataset GSE55945 |
||||
|
All PrCa data compared to non-cancerous prostate tissue. |
ProL1(OPRN) |
0.0013 |
1.14 |
2.20 |
|
hSMR3A |
0.0098 |
0.52 |
1.43 |
|
|
ERG fusion positive PrCa data compared to non-cancerous prostate tissue. |
ProL1(OPRN) |
0.00097 |
1.17 |
2.25 |
|
hSMR3A |
0.026 |
0.38 |
1.30 |
|
|
ERG fusion negative PrCa data compared to non-cancerous prostate tissue. |
ProL1(OPRN) |
0.013 |
1.11 |
2.16 |
|
SMR3A |
0.012 |
0.64 |
1.56 |
|
|
Dataset GSE3325 |
||||
|
All PrCa data compared to non-cancerous prostate tissue. |
hSMR3B |
0.000083 |
2.74 |
6.68 |
|
Localized PrCa data compared to non-cancerous prostate tissue. |
hSMR3B |
0.0035 |
2.3 |
4.92 |
|
Metastatic PrCa data compared to non-cancerous prostate tissue. |
hSMR3B |
0.00039 |
3.22 |
9.32 |

