3.1. Structures of (SO2)n clusters (n = 1–7)
In this section, we will focus on the putative global minima (PGM) of (SO2)n clusters ( n = 2–7), whose optimized geometries are shown in Fig. 1. The other minimum energy geometries up to 12 numbers are provided in the supporting information Fig. S1 – S6. The PGM of SO2 dimer has a low symmetry geometry with Cs symmetry in which one of SO2 molecule is perpendicular to the other with an intermolecular S···O distance of 3.331 Å. The average S-O bond length in the PGM was 1.429 Å, which is shorter than observed for the SO2 molecule. By gas-phase infrared spectra study and ab initio calculations on SO2 clusters, Ito and Hirabayashi have the recommend that the PGM be stable geometry [41, 42]. There exits two low lying geometry with Ci symmetry 2S-1 and 2S-2 has a petite twist in the O-S···O-S dihedral angle and are 0.55 and 0.56 kcal mol-1 less stable than the PGM. The C2 symmetry geometry 2S-3 is 0.76 kcal mol-1 less stable than PGM. The existence of several low-lying isomers within a few kcal mol-1energy suggests that extreme low-temperature studies are needed for studying the SO2 clusters.
For the trimer SO2 cluster, a cyclic ring with C1 symmetric with two SO2 molecules binding one SO2 molecule was found to be the PGM. The average S-O bond length and intermolecular S···O bond lengths are 1.430 Å and 3.093 Å respectively. The above values are longer and shorter than the PGM dimer cluster. The low lying isomer 3S-1 shown in Fig. S2, with a chair conformation is just 0.07 kcal mol− 1 in energy. Besides these next four isomers were also in cyclic configuration, however, they were found to have different orientations of SO2 molecules. For example, the 3S2-2 isomer exists in chair form but the angle of orientation of SO2 differs from one other, while the 3S-5 isomer exists in a cup shape configuration. It is interesting to observe that the configuration other than cyclic forms such as the bent configuration (3S8–3S-11) is less stable than the cyclic configurations. Of the entire configuration, the linear 3S-12 was found to be the least stable.
The PGM and the 12 low-lying geometries along with selected bond parameters for the SO2 tetramer clusters are provided in Fig. 1(c) and Fig. S3 respectively. The PMG of the tetramer cluster has a tetrahedral geometry in which the SO2 molecules occupy the corners. The average S-O bond length in these cluster remains at 1.430 Å, while there is an increase in average intermolecular S···O bond length to 3.138 Å compared to the trimer PGM cluster. The first five low-lying isomers of tetramer clusters shown in Fig. S3 (4S-1–4S-5) are found to exist in the tetrahedral geometry, with a small change in the angle of orientation of SO2 molecules. It is interesting to find that these are just 0.04–0.74 kcal mol− 1 energy differences than the PGM. The butterfly-like configurations shown in Fig. S3 (4S-7, 4S-8, 4S-10, 4S-11) have nearly twice less stable as the tetrahedral configurations. Moreover, the planar geometry shown in Fig. S3, 4S-12 are the least stable conformers. This indicates that 3D growth is preferred in the SO2 clusters. It is worth point out that our previous studies on DMSO clusters show them to have ouroboros structure with 2D growth [43, 44].
With the increase in the number of SO2 molecules and the existence of several closely positioning isomers, the complexity of finding the PGM for larger clusters becomes more complex and computationally expensive [45]. Hence, for the pentamer to heptamer cluster, the possible guessed structures are obtained by adding one, two, and three SO2 molecules to the lowest energy tetramer and trimer clusters in all possible directions. The PGM for the pentamer is shown in Fig. 1(d) and the low-lying isomers are shown in Fig. S4. In the pentamer to heptamer clusters, we have noticed that those SO2 molecules whose oxygen atoms both are in bonding with nearly by the sulfur atom of sulfur dioxide have a shorter S···O bond distance. The average S-O bond length in pentamer, hexamer, and heptamer clusters remain at 1.430 Å, while the intermolecular S···O bond distance in these clusters are 3.216, 3.257, and 3.187 Å respectively. Furthermore, in these clusters, the SO2 molecules exist in near tetrahedron geometry when one, two, and three sulfur dioxides are removed from the pentamer, hexamer, and heptamer clusters.
3.2. Structure of (SO2)n–H2O (n = 1–7)
The sulfur dioxide molecule can interact with hydrogen atoms in water and make a hydrogen bond or the π-hole observed on the sulfur atom can interact with the electron-rich oxygen atom of water to make a chalcogen bonding. The PGM of SO2–H2O hetrodimer is shown in Fig. 2(a) and the other three low-lying isomers (SH-1, SH-2, and SH-3) are shown in Fig. S7. The PGM of SO2–H2O was found to have the S···O chalcogen bonding with an intermolecular distance of 2.719 Å. The intramolecular S-O bond length has contracted from 1.440 in the free SO2 molecule to 1.431 Å in the SO2–H2O complex. On the contrary intramolecular O-H distance of water got stretched from 0.957 in free water to 0.959 Å. This may be envisaged due to the electron density transfer from the sulfur atom to the water molecule. We noticed three low-lying isomers (SH-1, SH-2, and SH-3) with H-bonding and intermolecular distances of 2.414, 2.430, 2.168 Å, with 1.72, 2.09, and 2.87 kcal mol− 1 higher than the PGM respectively. The lower stability of the H-bonded isomers shows that chalcogen bonds are stronger than the H-bonds (vide infra).
The (SO2)2–H2O hetrotrimer can be in various isomeric forms. The PGM of the trimer cluster is shown in Fig. 2(b) and the other low-lying isomers are provided in Fig. S7. The trimer PGM has one S···O chalcogen with an intramolecular distance of 2.630 Å, which is shorter than observed in the SO2-H2O cluster. The average Ow-H···O distance between water and the SO2 was 2.420 Å, while the average intramolecular S-O bond length was 1.432 Å which is slightly higher than observed in the SO2-H2O cluster. The low-lying isomer 2SH-1 has 0.78 kcal mol− 1 higher in energy than PGM and exist in a cyclic chair conformation with two intermolecular chalcogen bond and one hydrogen bond. The next three low-lying isomers 2SH-2, 2SH-3, and 2SH-4 all exist in a cyclic conformation similar to the 2SH-1, but the orientation of the SO2 molecule differ in these isomers. The linear isomers 2SH-5, 2SH-6, and 2SH-7 are less stable than the cyclic conformers. Comparison between the linear structures shows that 2SH-5 in which the two SO2 molecules has chalcogen bond with water molecule is more stable than structures where there exists intermolecular chalcogen bonding between SO2 molecules as in 2SH-6 and 2SH-7. From the above discussion, we can conclude that the structures which exist with chalcogen bonding alone and with only H-bonding are less stable and the existence of cooperativity between these two bonding’s helps in stabilizing the PGM of SO2-water clusters.
The PGM of the hetrotetramer cluster occurs with two SO2 molecules in hydrogen bonding with water and the other SO2 to be in chalcogen S···Ow bonding with water as shown in Fig. 2(c). Interestingly, the molecules occupy the corners in a tetrahedral geometry. The SO2 molecules are in intermolecular bonding with one another. The average intermolecular S-O bond length is shorter than the hetrotrimer but longer than the pristine SO2 molecule. Furthermore, the intermolecular H-bonds between water and SO2 got reduced to 2.161 Å compared to the 2.419 Å observed for the hetrotrimer cluster. The low-lying isomers of hetrotetramer are shown in Fig. S8. One may notice that all the low-lying hetrotetramer clusters have both hydrogen bonding and one or two chalcogen S···Ow bondings with water. The PGM clusters of hetropentamer and hetrohexamer are shown in Fig. 2(d) and 2(e) have three intermolecular H-bonding and one S-Ow bonding with water. The PGM clusters of hetroheptamer and hetrooctamer have three intermolecular H-bonding two chalcogen S-Ow bonding with the water molecule.
3.3 Energetics of (SO2)n and (SO2)n–H2O (n = 1–7)
To understand the stability of the SO2 and hydrated SO2 clusters, we have computed their total binding energy, the average binding energy per SO2 molecule, and the incremental binding energy. The total binding energy is obtained as the difference in total energy of the cluster with the size of the cluster multiplied by the total energy of the optimized SO2 molecule. The incremental binding energy is computed as shown in bellow
IBE = E(SO2)n – E(SO2)n-1 – E(SO2)
where E(SO2)n is the total energy of the sulfur dioxide cluster, E(SO2)n-1 is the total energy of n-1th cluster and E(SO2) is the energy of the sulfur dioxide monomer. The computed energy parameters for the sulfur dioxide clusters are provided in Table 1. The computed binding energy and binding energy per SO2 molecule for the sulfur dioxide cluster increases monotonically with the increase in the cluster size. The incremental binding energy decreases with the increase in cluster size and nears the saturation limit.
Table 1
Binding energy (BE), binding energy per SO2 molecule (BE/n), incremental binding energy (IBE), polarizability (α) for SO2 and hydrated SO2 cluster and cluster adsorption energy (CAE) for hydrated clusters. All the energies are in kcal mol− 1.
| n | (SO2)n | (SO2)n–H2O |
| BE | BE/n | IBE | α (a.u) | BE | BE/n | IBE | CAE | α (a.u) |
| 1 | - | - | - | 21.15 | -5.86 | -5.86 | -5.86 | -5.86 | 29.65 |
| 2 | -19.37 | -9.69 | -19.37 | 42.82 | -13.71 | -6.86 | -13.71 | -9.98 | 52.30 |
| 3 | -32.84 | -10.95 | -13.46 | 66.55 | -20.70 | -6.90 | -6.99 | -11.32 | 75.90 |
| 4 | -47.14 | -11.79 | -14.30 | 90.06 | -27.77 | -6.94 | -7.07 | -11.91 | 98.28 |
| 5 | -62.09 | -12.42 | -14.95 | 111.14 | -33.76 | -6.75 | -6.00 | -10.78 | 122.18 |
| 6 | -74.84 | -12.47 | -12.75 | 132.60 | -40.16 | -6.69 | -6.40 | -12.25 | 145.44 |
| 7 | -89.78 | -12.83 | -14.95 | 156.91 | -47.81 | -6.83 | -7.65 | -12.77 | 166.10 |
For the hydrated sulfur dioxide clusters, the binding energy increases monotonically, while the binding energy per SO2 shows no regular trend. The IBE of hydrated sulfur dioxide clusters shows the increase in the values with the cluster size except for the hetrohexamer with five SO2 molecules. The cluster adsorption energy is a useful parameter to understand the adsorption of sulfur dioxide cluster onto the water molecule which is computed as
CAE = E((SO2)n–H2O) – E(H2O) – E((SO2)n)
where E(SO2)n–H2O) is the total energy of the hydrated sulfur dioxide cluster, E(H2O) is the total energy of the water molecule, and E((SO2)n) is the total energy of the sulfur dioxide cluster. The cluster adsorption energy increase with the sulfur dioxide cluster size and reaches a near saturation. This implies that small sulfur dioxide clusters get adsorbed onto the water molecule more efficiently than the larger clusters.
The comparison of energetic parameters between SO2 and hydrated SO2 clusters would help in understanding their relative stability and reactivity. Compared to the binding energy of the pristine SO2 cluster, the hydrated SO2 cluster has 53–70 % lower values. Similarly, the incremental binding energy of hydrated SO2 clusters is nearly half the value observed for the pristine SO2 clusters. This shows that hydrated SO2 clusters are relatively less stable and are more reactive.
The plot of the total binding energy vs the number of SO2 molecules for the pristine SO2 and hydrated SO2 clusters are shown in Fig. 3(a) and (b), which have a perfect linear correlation with a coefficient of 0.999. Previous studies on acetonitrile and interhalogen derivatives account such behavior to the existence of cooperatively in those clusters [46, 47]. It is worth specifying that in the absence of cooperativity, the binding energy variation would be minimal and will be closer to the binding energy of the dimer cluster. Recently, Bartkowiak et.al found that in formamide and HCN clusters the computed mean polarizabilities show exceptional linearity with the cluster size [48, 49]. Our previous studies on linear DMSO clusters also show the existence of cooperativity when the mean polarizability is plotted as a function of cluster size [42, 43]. To test the above hypothesis, we plotted the polarizability as a function of cluster size for pristine and hydrated SO2 clusters as shown in Fig. 3(c) and 3(d), and observed excellent linearly with a correlation coefficient of 0.999, indicating the existence of cooperativity in these clusters.
One can also examine the presence of cooperativity in these clusters by computing their pairwise interaction energies [50]. The pairwise energies for the trimer to heptamer for SO2 clusters and dimer to octamer in hydrated sulfur dioxide clusters and their results are presented in Tables 2 and 3 respectively, while their numbering pattern is provided in Figs. 1 and 2. In the sulfur dioxide trimer, the interaction between (I, II) is higher than the other two pairs. It is interesting to observe the SO2 molecule I have the maximum bonding with the nearby cluster. A similar observation has been noticed in the tetramer cluster, wherein the interaction energy is higher from the (II, III) in with II has maximum bonding than the other molecules. In the pentamer cluster, the highest interaction is observed for the pair (I, II) and the least interaction occurs between the pair (II, V) are at the nonbonding distance. In the hexamer and heptamer clusters, pair (III, IV) and (V, VI) which are in close contact and with maximum bonding have the highest interaction energy. The least interaction energies for the above clusters are for the pairs which are at the nonbonding distances.
Table 2
Pairwise interaction energies (kcal mol− 1) of the trimer, tetramer, pentamer, hexamer and heptamer for sulfur dioxide clusters
| Pair | Trimer | Tetramer | Pentamer | Hexamer | Heptamer |
| I, II | -18.74 | -18.03 | -18.67 | -18.53 | -16.99 |
| I, III | -18.18 | -18.08 | -17.55 | -15.77 | -15.63 |
| I, IV | – | -17.72 | -18.60 | -15.48 | -15.68 |
| I, V | – | – | -18.15 | -17.96 | -17.79 |
| I,VI | – | – | – | -16.56 | -16.50 |
| I, VII | – | – | – | – | -18.29 |
| II, III | -18.26 | -18.93 | -18.18 | -16.52 | -18.13 |
| II, IV | – | -17.64 | -16.88 | -17.74 | -15.69 |
| II, V | – | – | -15.71 | -17.19 | -15.81 |
| II, VI | – | – | – | -18.08 | -18.26 |
| II, VII | – | – | – | – | -18.05 |
| III, IV | – | -17.77 | -17.81 | -17.74 | -17.69 |
| III, V | – | – | -17.63 | -15.84 | -15.80 |
| III, VI | – | – | – | -18.69 | -16.56 |
| III, VII | – | – | – | – | -18.13 |
| IV, V | – | – | -18.12 | -18.05 | -16.75 |
| IV, VI | – | – | – | -17.70 | -16.53 |
| IV, VII | – | – | – | – | -18.78 |
| V, VI | – | – | – | -18.33 | -18.55 |
| V, VII | – | – | – | – | -16.50 |
| VI, VII | – | – | – | – | -17.36 |
Table 3
Pairwise interaction energies (kcal mol− 1) of the trimer, tetramer, pentamer, hexamer and heptamer for hydrated sulfur dioxide clusters
| Pair | Dimer | Trimer | Tetramer | Pentamer | Hexamer | Heptamer |
| I, II | -3.94 | -2.83 | -2.21 | -2.90 | -1.08 | -1.82 |
| I, III | -5.55 | -5.02 | -2.75 | -2.07 | -2.79 | -2.04 |
| I, IV | - | -2.32 | -4.27 | -2.11 | -2.32 | -2.61 |
| I, V | - | - | -2.19 | -5.72 | -5.40 | -2.69 |
| I,VI | - | - | - | -4.52 | -4.38 | -5.26 |
| I, VII | - | - | - | - | -0.67 | -4.25 |
| I, VIII | - | - | - | - | - | 0.24 |
| II, III | -18.02 | -17.84 | -15.53 | -15.46 | -15.53 | -17.37 |
| II, IV | - | -17.13 | -17.35 | -15.99 | -16.87 | -15.59 |
| II, V | - | - | -17.17 | -16.63 | -17.57 | -17.39 |
| II, VI | - | - | - | -18.27 | -18.09 | -18.91 |
| II, VII | - | - | - | - | -18.36 | -15.97 |
| II, VIII | - | - | - | - | - | -15.73 |
| III, IV | - | -18.64 | -17.64 | -17.08 | -15.37 | -17.49 |
| III, V | - | - | -16.85 | -18.09 | -17.06 | -15.37 |
| III, VI | - | - | - | -15.82 | -18.33 | -17.49 |
| III, VII | - | - | - | - | -15.39 | -18.06 |
| III, VIII | - | - | - | - | - | -15.61 |
| IV, V | - | - | -18.44 | -18.45 | -16.14 | -16.45 |
| IV, VI | - | - | - | -15.87 | -16.05 | -16.33 |
| IV, VII | - | - | - | - | -17.92 | -18.09 |
| IV, VIII | - | - | - | - | - | -18.42 |
| V, VI | - | - | - | -16.32 | -16.28 | -17.56 |
| V, VII | - | - | - | - | -17.88 | -15.84 |
| V, VIII | - | - | - | - | - | -19.22 |
| VI, VII | - | - | - | - | -15.57 | -15.94 |
| VI, VIII | - | - | - | - | - | -15.20 |
| VII, VIII | - | - | - | - | - | -15.44 |
Table 4
The summation of QTAIM parameters corresponding to intermolecular bonding between the SO2 molecules and water and SO2 molecules.
| n | Σρ(r) | Σ∇2ρ(r) | Σλ1 | Σλ2 | Σλ3 | ΣV(r) | ΣG(r) | ΣH(r) |
| (SO2)n |
| 2 | 0.005801 | 0.024560 | -0.00284 | -0.00094 | 0.028335 | -0.00320 | 0.004671 | 0.001470 |
| 3 | 0.037336 | 0.142938 | -0.02775 | -0.02584 | 0.196520 | -0.02228 | 0.029006 | 0.006730 |
| 4 | 0.070984 | 0.284806 | -0.05323 | -0.04332 | 0.381350 | -0.04253 | 0.056865 | 0.014340 |
| 5 | 0.079889 | 0.321754 | -0.05929 | -0.04624 | 0.427283 | -0.04650 | 0.063467 | 0.016970 |
| 6 | 0.108563 | 0.444075 | -0.07704 | -0.05043 | 0.571547 | -0.06118 | 0.086101 | 0.024920 |
| 7 | 0.168147 | 0.670360 | -0.12468 | -0.09915 | 0.894189 | -0.09544 | 0.131515 | 0.036080 |
| (SO2)n – H2O |
| 1 | 0.021179 | 0.065943 | -0.018941 | -0.018082 | 0.102966 | -0.014198 | 0.015342 | 0.001144 |
| 2 | 0.047099 | 0.158607 | -0.042776 | -0.038174 | 0.239558 | -0.030624 | 0.035138 | 0.004514 |
| 3 | 0.089639 | 0.320626 | -0.089272 | -0.079022 | 0.488922 | -0.058731 | 0.069443 | 0.010713 |
| 4 | 0.124010 | 0.444185 | -0.126779 | -0.113284 | 0.684248 | -0.082626 | 0.096837 | 0.014210 |
| 5 | 0.138661 | 0.538339 | -0.126911 | -0.109121 | 0.774373 | -0.088226 | 0.111405 | 0.023177 |
| 6 | 0.165726 | 0.650145 | -0.154341 | -0.132530 | 0.937017 | -0.107058 | 0.134796 | 0.027739 |
In the hydrated (SO2)2–H2O hetrodimer cluster the highest interaction is observed for the pair (II, III), the interaction between the sulfur dioxides. The H-bonding interaction between the pair (I, II) has the least interaction energy, while the interaction between water and sulfur dioxide (I, III) has interaction energy higher than the H-bonding dimer but far less than the sulfur dioxide dimer interaction. A similar scenario has been seen in the other larger clusters, wherein the hydrogen bonding has lower interaction energy and the intermolecular sulfur dioxide have higher interaction energies. In the case of hetroheptamer clusters, we observe a destabilization interaction between the water and the SO2 which well away from it. The highest interaction energy is observed in the case of SO2 which is in bonding with water and SO2 which is nonbonding with water. It is worth point out that the pair-wise interaction energy is higher for the H-bonding dimers in the DMSO cluster [43, 44]. Moreover, the interaction energy decreases with the increase in distance between the water and the sulfur dioxide molecule. Despite the above, the total binding energy shows excellent linearly when plotted against the number of SO2 molecules, which confirms the cooperativity effect which stabilized the SO2 and hydrated SO2 clusters.
3.4. Nature of Intermolecular Interaction
To understand the nature of intermolecular interactions between sulfur dioxides molecules in sulfur dioxide clusters and water and sulfur dioxide clusters in hydrated sulfur dioxides, we used quantitative molecular electrostatic potential analysis (MESP), electron density difference (EDD) atoms in molecule (AIM), noncovalent interaction – reduced density gradient (NCI-RDG) and Energy decomposition analysis. The acquired results are presented below.
3.4.1. Molecular electrostatic potential (MEP) and Electron Density Difference (EDD) analysis
Figure 4(a) illustrates the MEP of SO2 monomer, in which the red region of positive MEP designated as Vs,max occurs around the sulfur atom, and the negative regions categorized as Vs,min is around the oxygen atom. The former positive regions which lie perpendicular to the S-O bond are designated as π-hole [51, 52]. The Vs,max associated with the π-hole has a magnitude of 33.98 kcal mol− 1 The MEP of SO2 dimer illustrated in Fig. 4(b), in which the sulfur atom which is at the free end has a magnitude of 36.83 kcal mol− 1 a value closer to the pristine SO2 molecule. The Vs,max on the sulfur atom which gets adsorbed to the oxygen atoms of adjacent SO2 molecule got reduced to 29.59 kcal mol− 1. A similar situation has been observed on all the studied SO2 clusters, in which the sulfur atoms at the terminal nearly retain their Vs,max values. The Vs,min value on SO2 was observed on the oxygen atoms with a value of -19.85 kcal mol− 1. As the name π-hole was misleading, in recent year’s π-hole interactions are redesigned as chalcogen, pniocogen, and tetrel bond if it occurs on group 14, 15, and 16 atoms respectively [53, 54]. Upon complex formation, the values observed on the oxygen which is in bonding with nearby sulfur atom gets reduced, while the oxygen atoms which are at the terminal have enhanced values generating an intramolecular S···O chalcogen bond between the SO2 molecules. Very recently, Esrafili and Mohammadian-Sabet observe the Vs,max, and Vs,min values are persistent on linear clusters of (OCS)2−8 and (OCSe)2−8 [55]. The presence of Vs,max, and Vs,min on the surface of the clusters helps for the additional SO2 adsorption on the surface and growth of cluster.
The MEP of hydrated sulfur dioxide clusters are shown in Fig. 4(g-x). In the hydrated dimer cluster, the Vs,max on bonding side of sulfur got vanished, while the opposite side has a magnitude of 24.91 kcal mol− 1 much less than observed in the case of pristine SO2 cluster. This implies that if SO2 gets added to it will have lower stability. Moreover, the Vs.max on hydrogen atom was 50.02 kcal mol− 1. Hence the addition of SO2 occurs at the site, leading to an H-bonding. In the case of the timer ((SO2)2-H2O) cluster, Vs,max on hydrogen atom was 37.39 kcal mol− 1 which is larger than the π-hole value observed on the free SO2 molecule. Thus in the tetramer cluster ((SO2)3-H2O) the SO2 prefers to be an H-bonding state. In the larger clusters the Vs,max on hydrogen atom is far less than the values observed on the sulfur atom π-hole and hence bonding occurs at the site leading to the chalcogen bonding. The reduction of the Vs,max on hydrogen atom upon complexation implies that electron density on oxygen atoms are polarized towards the positive hydrogen and tend to move from the oxygen atom on complexation. In the pentamer cluster, a Vs,min value of 23.49 kcal mol− 1 on the oxygen atom of water was observed. Henceforth in the octamer cluster, we observe the presence of two intermolecular chalcogen bonding between two sulfur dioxide and water molecule. Thus the value of Vs,max or Vs,min dictates the direction of the interaction of new SO2 molecule in larger clusters.
To provide a visualization of the changes in the electron density on complexation, the electron density difference (EDD) maps [56] for the hydrated sulfur dioxide clusters have been plotted and depicted in supporting information Fig S12. Red regions indicate regions of an increase of electron density, and blue regions are associated with regions of decreased electron density. These EDD maps are obtained by subtraction of electron densities of the complex and the corresponding monomers on their complex geometries. In the case of SO2 clusters, the monomers are SO2 molecule which binds with two oxygen as unit one and other as unit two. In the case of hydrated complexes, water is considered as unit one and SO2 cluster as unit two. In the pristine SO2 clusters, the noticeable aspect is the build of blue regions encamping the regions where sulfur atom which is in S···O chalcogen bonding. In the larger clusters, these regions were found to merge generating a large surface. Also, notice that the oxygen adjacent to the sulfur atoms gains electron density envisaged by the red regions. Thus a substantial electron density shift from the sulfur (donor) to the oxygen atom (acceptor) occurs during the cluster formation. This was also observed in the hydrated sulfur dioxide clusters. Besides the above, we also notice a presence of red regions fully surrounding the water molecules in hydrated clusters. This corresponds to the gain of electron density by water molecules similar to the previously reported hydrated complexes.
3.4.2 Atoms in molecules
The quantum theory of atoms in molecules provides detailed information about the existence, strength, and characteristics of different intermolecular interactions in various complexes [56–59]. The presence of a bond critical point (BCP) between sulfur dioxide and sulfur dioxide/water can be used to characterize the chalcogen bonds. Molecular graphs for all the pristine SO2 cluster and hydrated SO2 clusters is depicted in Fig. 5. The electron density properties at the BCPs for sulfur dioxide clusters are provided in Table S1 and for hydrated clusters in Table S2. The electron density ρ(r) at the intermolecular S···O in sulfoxide clusters are in the range of 0.005–0.0133 a.u. which fall in the accepted range of chalcogen bonding [60, 61]. However, these values are much smaller than observed in hydrogen bonds (0.002–0.035 a.u.), which indicates that these interactions are weak. The Laplacian of electron density were all positive values in the range 0.019–0.052 a.u. and are closed-shell weak interactions. The ratio of kinetic and potential energy density at BCP, -G(r) /V(r) is greater than unity at all the BCPs revealing the presence of noncovalent interactions. Ellipticity is a measure of delocalization of electron and thus the bond stability or weakness of the bond. A high ellipticity value indicates the instability of the bond [62]. As a general trend the ellipticity values of some chalcogen bonds in dimer sulfoxide clusters increases with the cluster size indicating that those bonds are less stable. In the hydrated complexes, the observed at the BCPs between water and sulfur dioxides have ρ(r) values in the range 0.005–0.018 a.u. which closer to the values suggested by Koch and Popelier for H-bonding’s [63]. Based on the values at BCPs with hydrogen bonding ∇2ρ(r) and H(r) > 0 and hence can be classified as weak and electrostatic dominant. From Table S1, it is evident that ρ(r) values for the chalcogen bonds are in the range of 0.004–0.033 au. which are higher than the H-bond values observed in the same complexes, however ∇2ρ(r) and H(r) > 0 and hence can be classified as weak and electrostatic dominant. The Laplacian at all BCPs are positive and the ration –G(r)/V(r) values for most of the BCPs are greater than unity revealing the presence of noncovalent nature. The intermolecular interaction energy computed using the Espinosa method is in the range of -0.99 – -4.38 kcal mol− 1. The above values in the acceptable range of previously reported weakly H-bonding systems [64, 65]. The computed summation of electron density properties at the BCPs is provided in Table 3. The results indicate that the summation of ρ(r) and ∇2ρ(r) values of clusters increases with the size of the cluster and is always higher than that of dimers. Recently, Esrafili et al observed that the average ρ(r) and ∇2ρ(r) values of larger clusters of OCS and OCSe are greater than those of dimers and associated it with the existence of chalcogen bond cooperativity due to the redistribution of electronic density in the clusters [55]. In our present study, we observe a very ρ(r) and ∇2ρ(r) value for the BCPs with H-bonding, while the other sulfur dioxide part of hydrated clusters were found to have higher low ρ(r) and ∇2ρ(r) compared to the pristine sulfur dioxide clusters. Thus, the presence of H-bond and chalcogen bond act cooperatively which resulted in the redistribution of electronic density in the hydrated clusters.
3.4.3. EDA analysis
Decomposition of the total interaction energy into repulsive and attractive terms opens a window to know the nature of the interaction. In Table 5, we provide the energy decomposition analysis results for the hydrated system obtained using the Morokuma's bond energy decomposition method [66]. In the Morokuma's method the attractive terms are partitioned into electrostatic, orbital, dispersion energies. It can be seen from Table 5, the destabilization Pauli’s terms increase with the cluster size and are highest for the pentamer cluster (SO2)4–H2O, presumable due to the addition of one more sulfur dioxide molecule to the tetramer which exists in a tetrahedral geometry. In attractive terms, the dominant is the electrostatic attraction which accounts for 60%. In the hydrated complexes, the highest electrostatic forces are observed in the case of the dimer SO2–H2O complex which doesn’t have an intermolecular hydrogen bonding. In all the complexes with the increase in the number of H-bonding, electrostatic attraction decreases. The orbital contribution, which corresponds to 29.12 to 37.80 % of the total attractive terms, increases with the increase in the number of intermolecular H-bonds. Among the attractive interactions, the weakest was the dispersion term and is least for tetramer (SO2)3–H2O complex and highest for the octamer complex (SO2)7–H2O. Overall the electrostatic interaction is dominated in complexes with more intermolecular chalcogen bonding and orbital interaction is higher for systems with more intermolecular H-bonding.
Table 5
Energy decomposition analysis for the hydrated sulfur dioxide clusters at the B3LYP-D3/TZ2P level on the PW6B95-D3/Def2TZVP optimized geometry. The percentage of contribution of the electrostatic interaction to the total attractive interactions is given in parenthesis.
| | ΔEPauli | ΔEelstat | ΔEorb | ΔEdisp |
| SO2–H2O | 11.95 | -10.49 (62.22) | -4.91 (29.12) | -1.46 (8.66) |
| (SO2)2–H2O | 20.34 | -17.90 (59.13) | -8.97 (29.63) | -3.40 (11.23) |
| (SO2)3–H2O | 29.45 | -24.03 (56.61) | -14.94 (35.19) | -3.48 (8.20) |
| (SO2)4–H2O | 40.38 | -31.16 (54.66) | -21.55 (37.80) | -4.30 (7.54) |
| (SO2)5–H2O | 33.13 | -30.95 (58.57) | -16.26 (30.77) | -5.63 (10.65) |
| (SO2)6–H2O | 35.31 | -31.99 (58.02) | -17.85 (32.37) | -5.30 (9.61) |
| (SO2)7–H2O | 36.98 | -32.75 (56.99) | -17.75 (30.89) | -6.97 (12.13) |
3.4.4. Non-covalent interactions-Reduced density gradient analysis
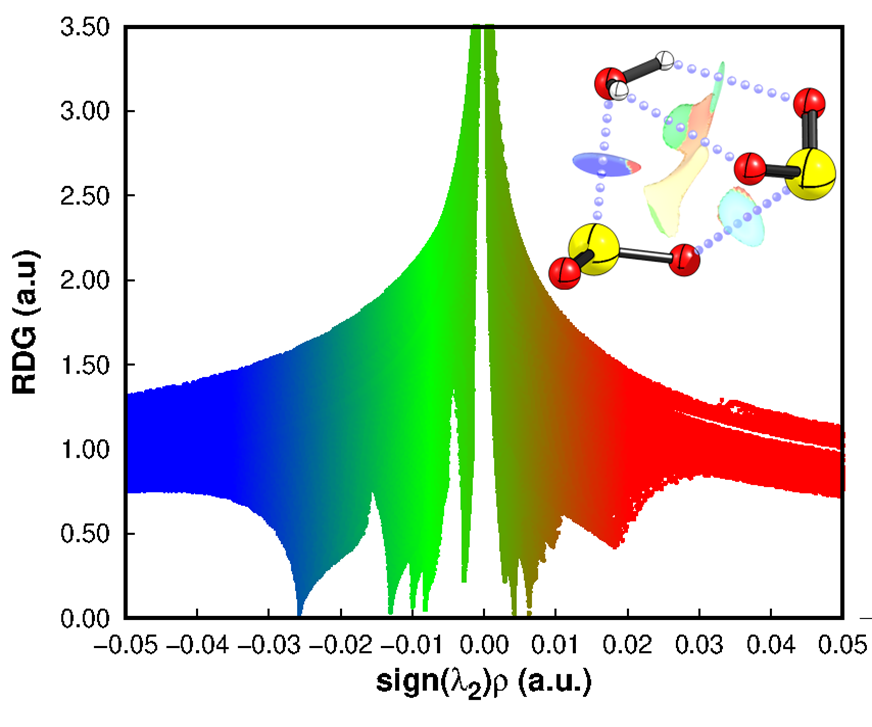
To visualize the noncovalent interactions, including weak van der Waals interaction, hydrogen bonding, and steric repulsion NCI-RDG analysis were carried out on the sulfur dioxide and hydrated sulfur dioxide clusters [68,69]. The 2D NCI graphs with inserted RDG isosurfaces for the sulfur dioxide and hydrated sulfur dioxide clusters are provided in Fig. 6 and supporting information in Fig. S13. In the NCI graphs, low density and low gradient spikes that appear on the negative λ2(r) values are for attractive interactions (specifically electrostatic/hydrogen bonding) and positive values are for the repulsive interactions. For the SO2 molecule, the NCI graphs is shown in Fig. 6(a), spikes are not visible due to the absence of attractive and repulsive forces. In the dimer (SO2)2 clusters, there were spikes at sign(λ2)ρ= − 0.006X and 0.006X a.u. appeared due to the attractive chalcogen bonding and sulfur–sulfur repulsive forces respectively. These interactions are evident from the RDG isosurfaces shown at the right top of Fig. 6(b) with green and yellowish-brown patches. In the trimer (SO2)3 cluster, we also notice the appearance of a pale green patch surrounded by a yellowish-brown patch between the oxygen–oxygen atoms. Their corresponding spikes were also noticed in the NCI graph. Interestingly, the presence of such interaction is not visible in the AIM analysis. The number of S···O bonds increases with the increases in cluster size; thus the number of spikes in the attractive regions also got increased with the cluster size. The negative λ2(r) values are very close and in the range − 0.006 to − 0.015 a.u. In the cluster sizes above n > 5, the spikes got merged and hence not visible as distinctly for each of the chalcogen bonding.
In the hydrated sulfur dioxide cluster SO2–H2O, we notice the presence of a spike at -0.02 a.u. and a broad spike in the region 0.018 a.u. The corresponding RDG isosurfaces show the presence of a blue patch indicating the presence of a strong electrostatic component between the water and SO2 molecule. Besides, a red patch at the edges of the blue patch is also noticed which is due to the repulsive forces between them. In the trimer cluster (SO2)2–H2O, the S···O chalcogen bond between a water molecule and SO2 molecules appears in the more negative region at -0.028 a.u. and green spikes due to intermolecular chalcogen bonding between the SO2 appears between 0.010–0.015 a.u. It is worth point out the intermolecular chalcogen regions are observed in the range − 0.006 to − 0.015 a.u for the pristine SO2 clusters. In the tetramer and pentamer clusters, the blue spikes are shifted to more negative regions along with the increase in the number of green spikes. In the larger clusters, the spike due to the intermolecular chalcogen bonding between water and SO2 molecules gets splattered, indicating the intermolecular SO2 chalcogen bonding’s cooperatively act to enhances the increased interaction between the water and SO2 molecule. These results are in good agreement with the geometry, pairwise energetic, MESP, AIM, and EDA analysis.