Patients’ characteristics and survival
We enrolled 200 patients with ECA for analysis, of which 185 were HPVA and 15 NHPVA (Table 1). Across both groups, the median follow-up period was 68 months (range: 1.5–125.1 months). The 1, 3, and 5-year OS rates were 99.5%, 90.5%, and 85.0%, respectively.
Table 1
Patient demographics and clinical charateristics.
|
Characteristic
|
Total (n = 200)
|
HPVA (n = 186)
|
NHPVA (n = 16)
|
|
| |
No. (%)
|
No. (%)
|
No. (%)
|
Pa
|
|
Age
|
|
|
|
0.014
|
|
≤ 37
|
34 (17.0%)
|
28 (82.4%)
|
6 (17.6%)
|
|
|
> 37
|
166 (83.0%)
|
157 (94.6%)
|
9 (5.4%)
|
|
|
HPV DNA
|
|
|
|
< 0.001
|
|
Negative (0-1pg/ml)
|
34 (17.0%)
|
26 (76.5%)
|
8 (23.5%)
|
|
|
Positive (≥ 1pg/ml)
|
110 (55.0%)
|
108 (98.2%)
|
2 (1.8%)
|
|
|
Not avaiable
|
56 (28.0%)
|
51 (51.8%)
|
5 (4.2%)
|
|
|
HPV genotype
|
|
|
|
0.273
|
|
HPV 16
|
49 (24.5%)
|
47 (95.9%)
|
2 (4.1%)
|
|
|
HPV 18
|
60 (30.0%)
|
57 (95.5%)
|
3 (5.0%)
|
|
|
Other
|
11 (5.5%)
|
11 (100.0%)
|
0 (0.0%)
|
|
|
Negative
|
72 (36.0%)
|
63 (87.5%)
|
9 (12.5%)
|
|
|
Not avaiable
|
8 (4%)
|
7 (87.5%)
|
1 (12.5%)
|
|
|
HPV RNAscope
|
|
|
|
0.003
|
|
≤ 3.3
|
99 (49.5%)
|
86 (46.5%)
|
13 (13.1%)
|
|
|
> 3.3
|
101 (50.5%)
|
99 (98.0%)
|
2 (2.0%)
|
|
|
Tumor size (cm)
|
|
|
|
0.004
|
|
≤ 4.5
|
178 (89.0%)
|
168 (94.4%)
|
10 (5.6%)
|
|
|
> 4.5
|
22 (11.0%)
|
17 (77.3%)
|
5 (22.7%)
|
|
|
FIGO stage
|
|
|
|
< 0.001
|
|
I
|
141 (70.5%)
|
137 (97.2%)
|
4 (2.8%)
|
|
|
II
|
51 (25.5%)
|
43 (84.3%)
|
8 (15.7%)
|
|
|
III
|
5 (2.5%)
|
4 (80.0%)
|
1 (20.0%)
|
|
|
IV
|
3 (1.5%)
|
1 (33.3%)
|
2 (66.7%)
|
|
|
Differentiation
|
|
|
|
0.537
|
|
Good
|
10 (5.0%)
|
7 (70.0%)
|
3 (30.0%)
|
|
|
Moderate
|
106 (53.0%)
|
96 (90.6%)
|
10 (9.4%)
|
|
|
Poor
|
84 (42.0%)
|
82 (97.6%)
|
2 (2.4%)
|
|
|
LVI
|
|
|
|
0.141
|
|
None (0)
|
138 (69.0%)
|
130 (94.2%)
|
8 (5.8%)
|
|
|
Focal (1–4)
|
37 (18.5%)
|
31 (83.8%)
|
6 (16.2%)
|
|
|
Moderate (5–9)
|
15 (7.5%)
|
14 (93.3%)
|
1 (6.7%)
|
|
|
Extensive (≥ 10)
|
10 (66.7%)
|
10 (100.0%)
|
0 (0.0%)
|
|
|
Invasion level of uterine cervix
|
|
|
|
0.008
|
|
< 1/3
|
54 (27.0%)
|
53 (98.1%)
|
1 (1.9%)
|
|
|
1/3 − 2/3
|
61 (31.0%)
|
60 (96.8%)
|
2 (3.2%)
|
|
|
≥ 2/3
|
84 (42.0%)
|
72 (85.7%)
|
12 (14.3%)
|
|
|
Lymph nodes invasion
|
|
|
|
0.024
|
|
No
|
154 (77.0%)
|
146 (94.8%)
|
8 (5.2%)
|
|
|
Yes
|
46 (23.0%)
|
39 (84.8%)
|
7 (46.7%)
|
|
|
Parametrium invasion
|
|
|
|
0.599
|
|
No
|
181 (90.5%)
|
168 (92.8%)
|
13 (7.2%)
|
|
|
Yes
|
19 (9.5%)
|
17 (89.5%)
|
2 (10.5%)
|
|
|
Surgical margin
|
|
|
|
< 0.001
|
|
No
|
187 (93.5%)
|
177 (94.7%)
|
10 (5.3%)
|
|
|
Yes
|
13 (6.5%)
|
8 (61.5%)
|
5 (38.5%)
|
|
|
Treatment
|
|
|
|
0.235
|
|
Surgery
|
83 (41.5%)
|
80 (96.4%)
|
3 (3.6%)
|
|
|
Surgery + chemotherapy
|
21 (10.5%)
|
20 (95.2%)
|
1 (4.8%)
|
|
|
Surgery + radiotherapy
|
41 (20.5%)
|
36 (87.8%)
|
5 (12.2%)
|
|
|
Surgery + chemoradiation
|
55 (27.5%)
|
49 (89.1%)
|
6 (10.9%)
|
|
|
MMR status
|
|
|
|
0.978
|
|
dMMR
|
13 (6.5%)
|
12 (92.3%)
|
1 (7.7%)
|
|
|
pMMR
|
187 (93.5%)
|
173 (92.5%)
|
14 (7.5%)
|
|
|
P16 IHC
|
|
|
|
0.001
|
|
Negative
|
82 (41.0%)
|
70 (85.4%)
|
12 (14.6%)
|
|
|
Positive
|
118 (59.0%)
|
115 (97.5%)
|
3 (2.5%)
|
|
|
Ki-67 IHC
|
|
|
|
0.131
|
|
≤ 12.5%
|
48 (24%)
|
42 (87.5%)
|
6 (12.5%)
|
|
|
> 12.5%
|
152 (76%)
|
143 (94.1%)
|
9 (5.9%)
|
|
| aChi-square test. HPVA, HPV-associated adenocarcinoma; NHPVA, nonHPV-associated adenocarcinoma; IHC, immunohistochemistry; LVI, lymph vascular invasion; dMMR, delete mismatch repair; pMMR, proficient mismatch repair. |
Diagnostic performance of HPV E6/E7 mRNA in situ hybridization in ECA compared to other assays.
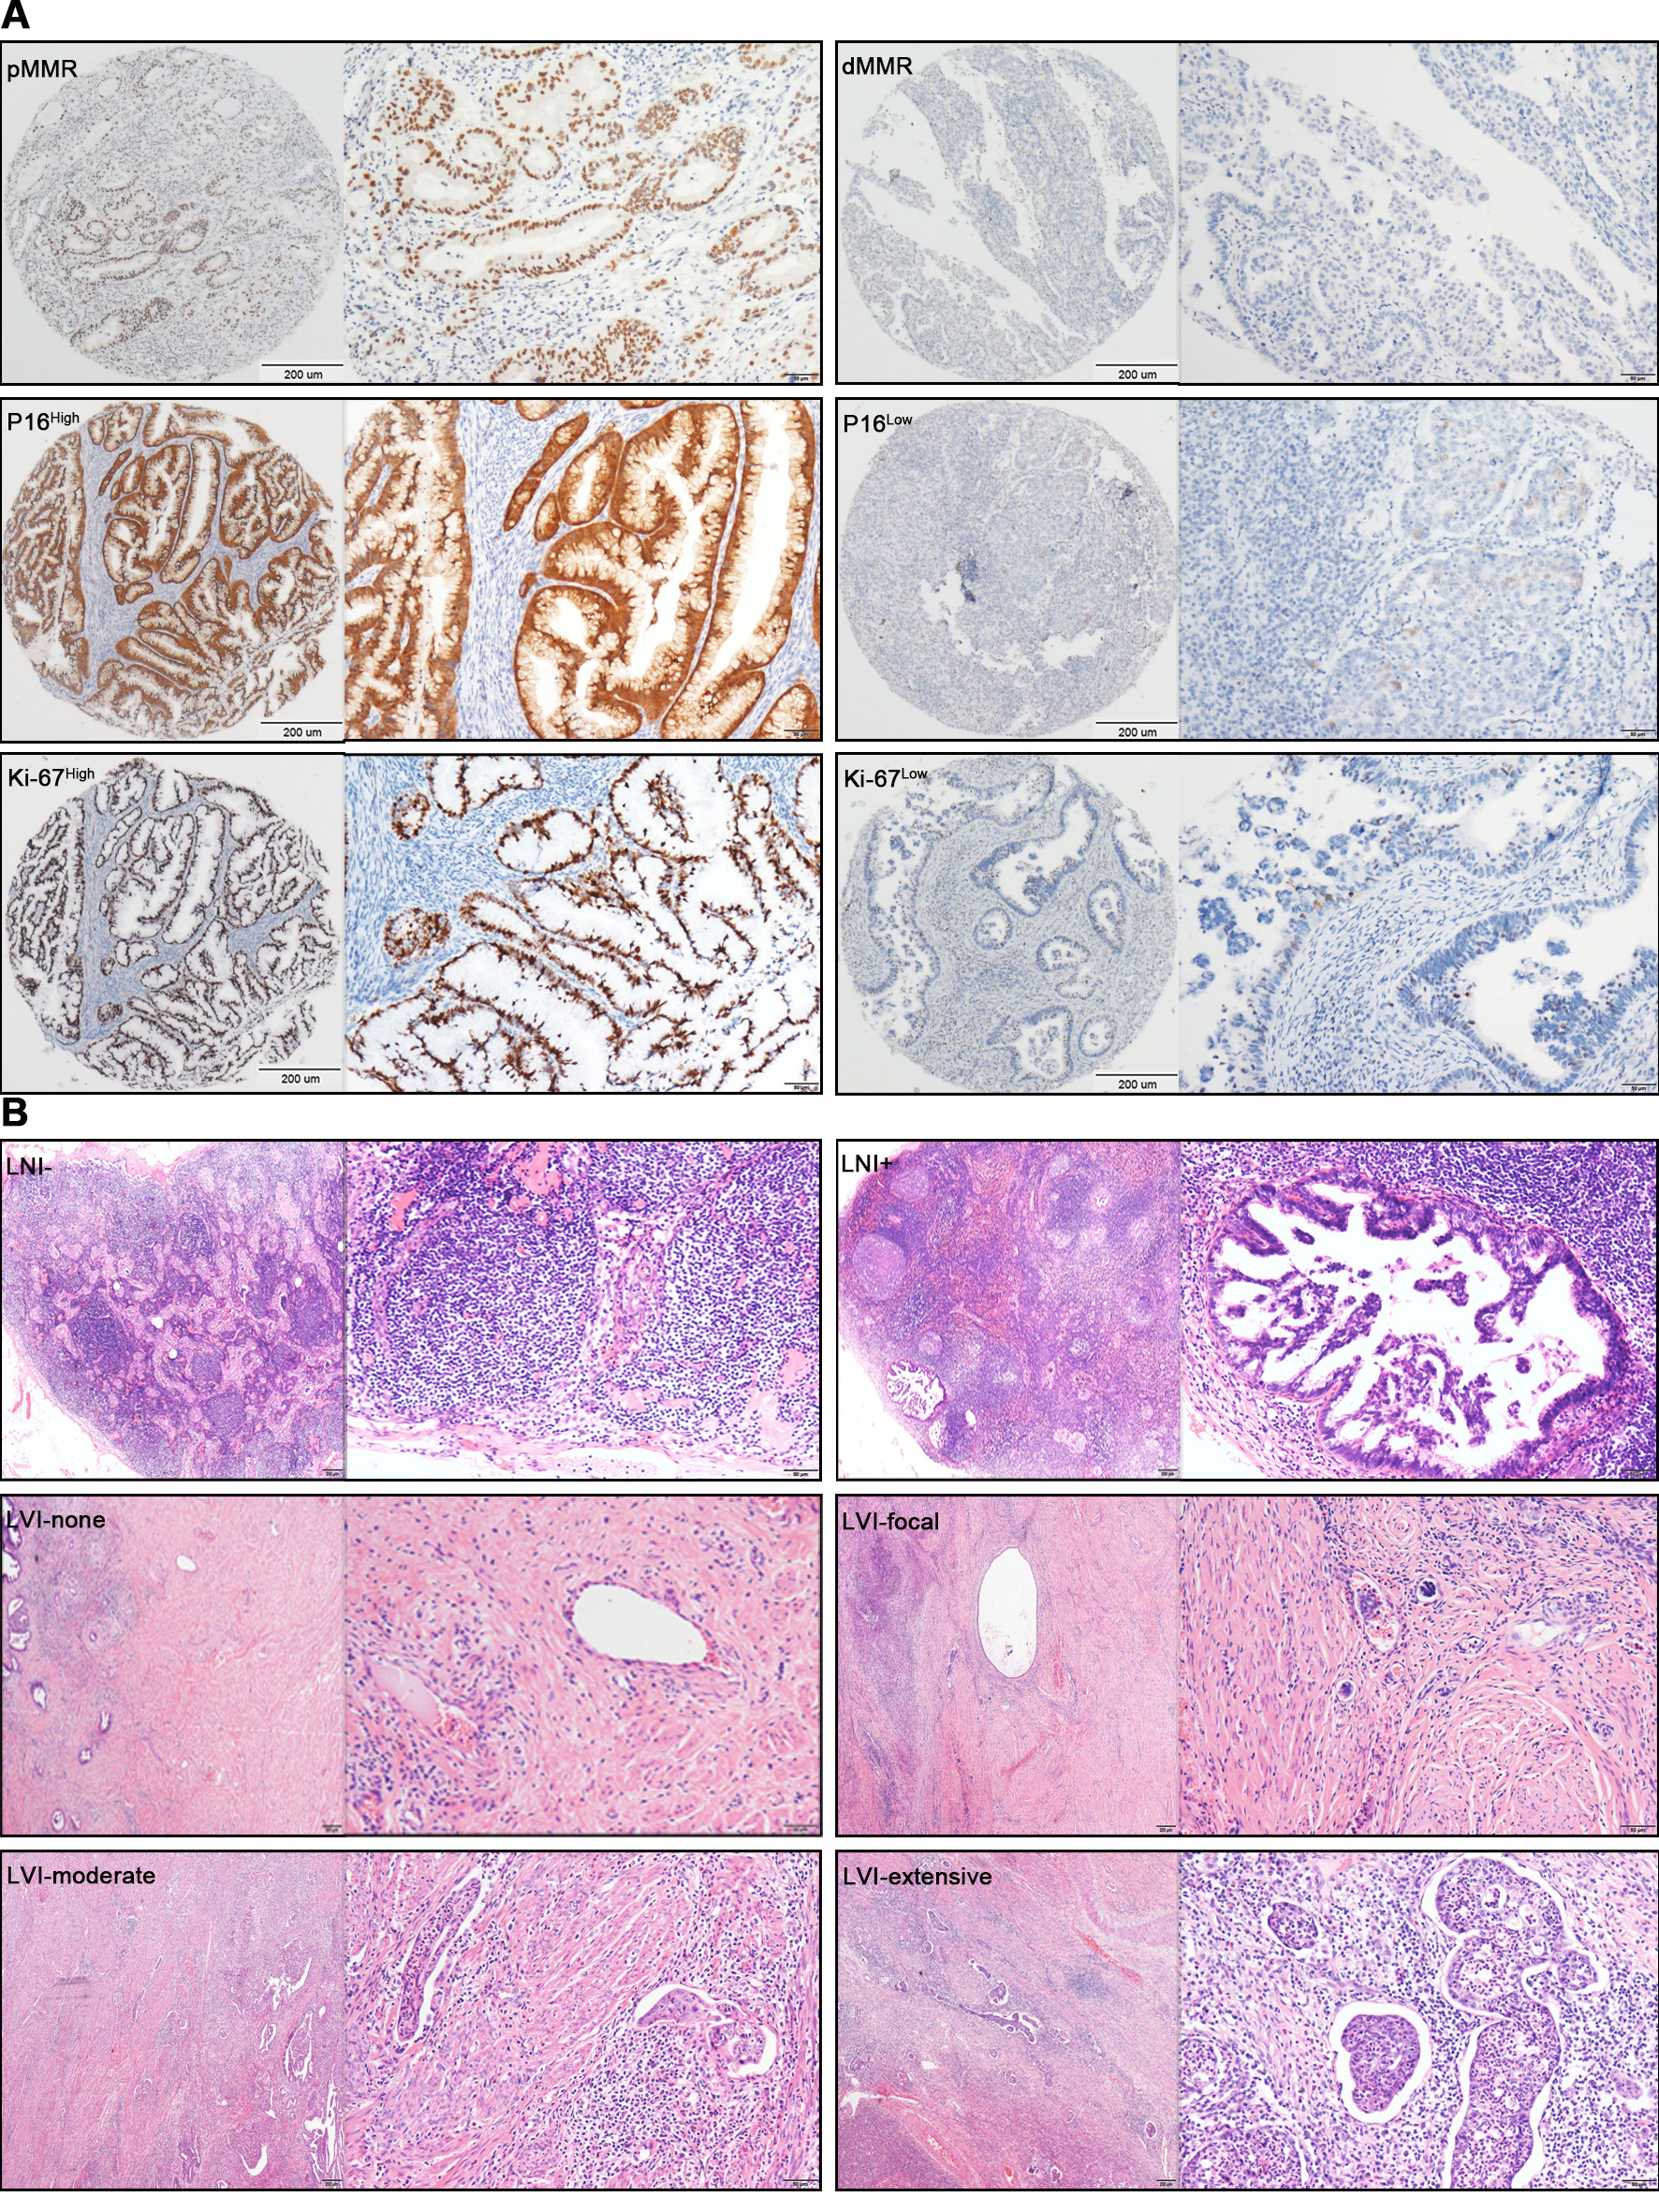
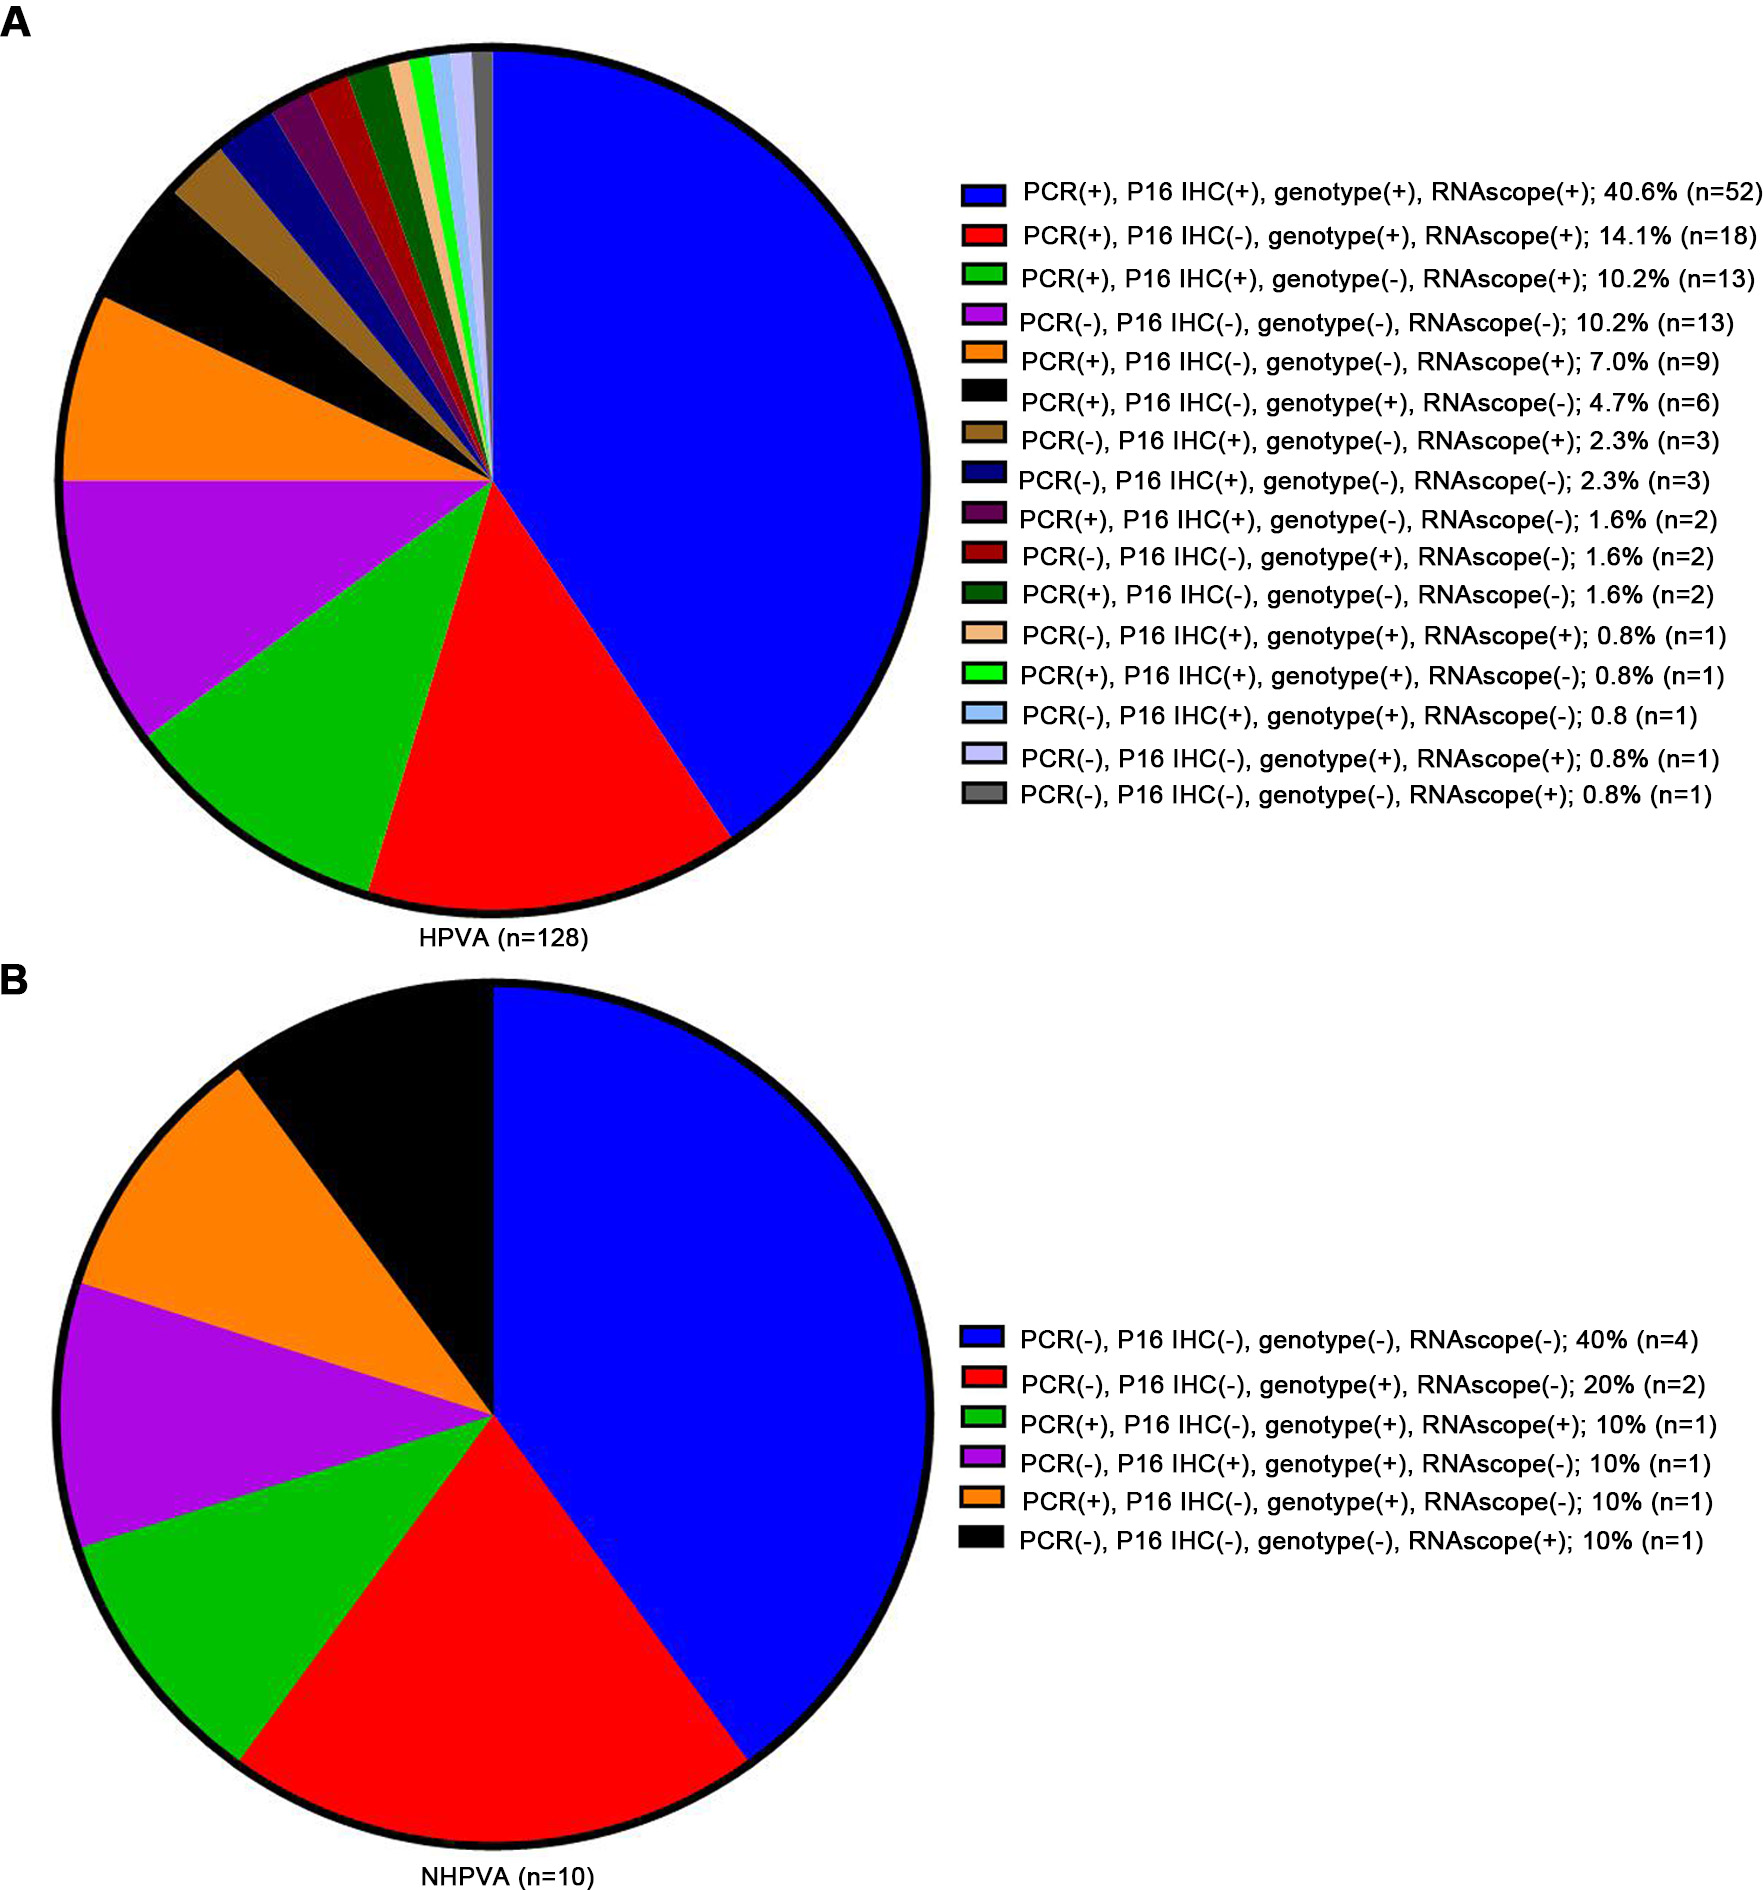
The RNAscope scores of 0 to 4 are shown in Fig. 1A and 1B. The diagnostic implications of the HPV E6/E7 RNAscope scores were evaluated in 200 ECA samples that included both HPVA and NHPVA cases (Table S1). The positive rates of HPV DNA, p16 IHC, HPV genotype, and HPV E6/E7 RNAscope across all ECA cases were 76.4%, 59.0%, 62.5%, and 72.0%, respectively (Fig. 1C and Fig. S3). HPV RNAscope and other assays were closely related (Table S2). ROC curves suggested that HPV DNA and HPV E6/E7 RNAscope showed similar results in terms of distinguishing HPVA from NHPVA (area under the curve [AUC] = 0.802, sensitivity = 80.5%, specificity = 80% vs. AUC = 0.799, sensitivity = 75.8%, specificity = 80%, respectively), outperforming both p16 IHC (AUC = 0.751, sensitivity = 60.2%, specificity = 90%) and HPV genotype (AUC = 0.566, sensitivity = 63.3%, specificity = 50%; Fig. 1D and Table 5).
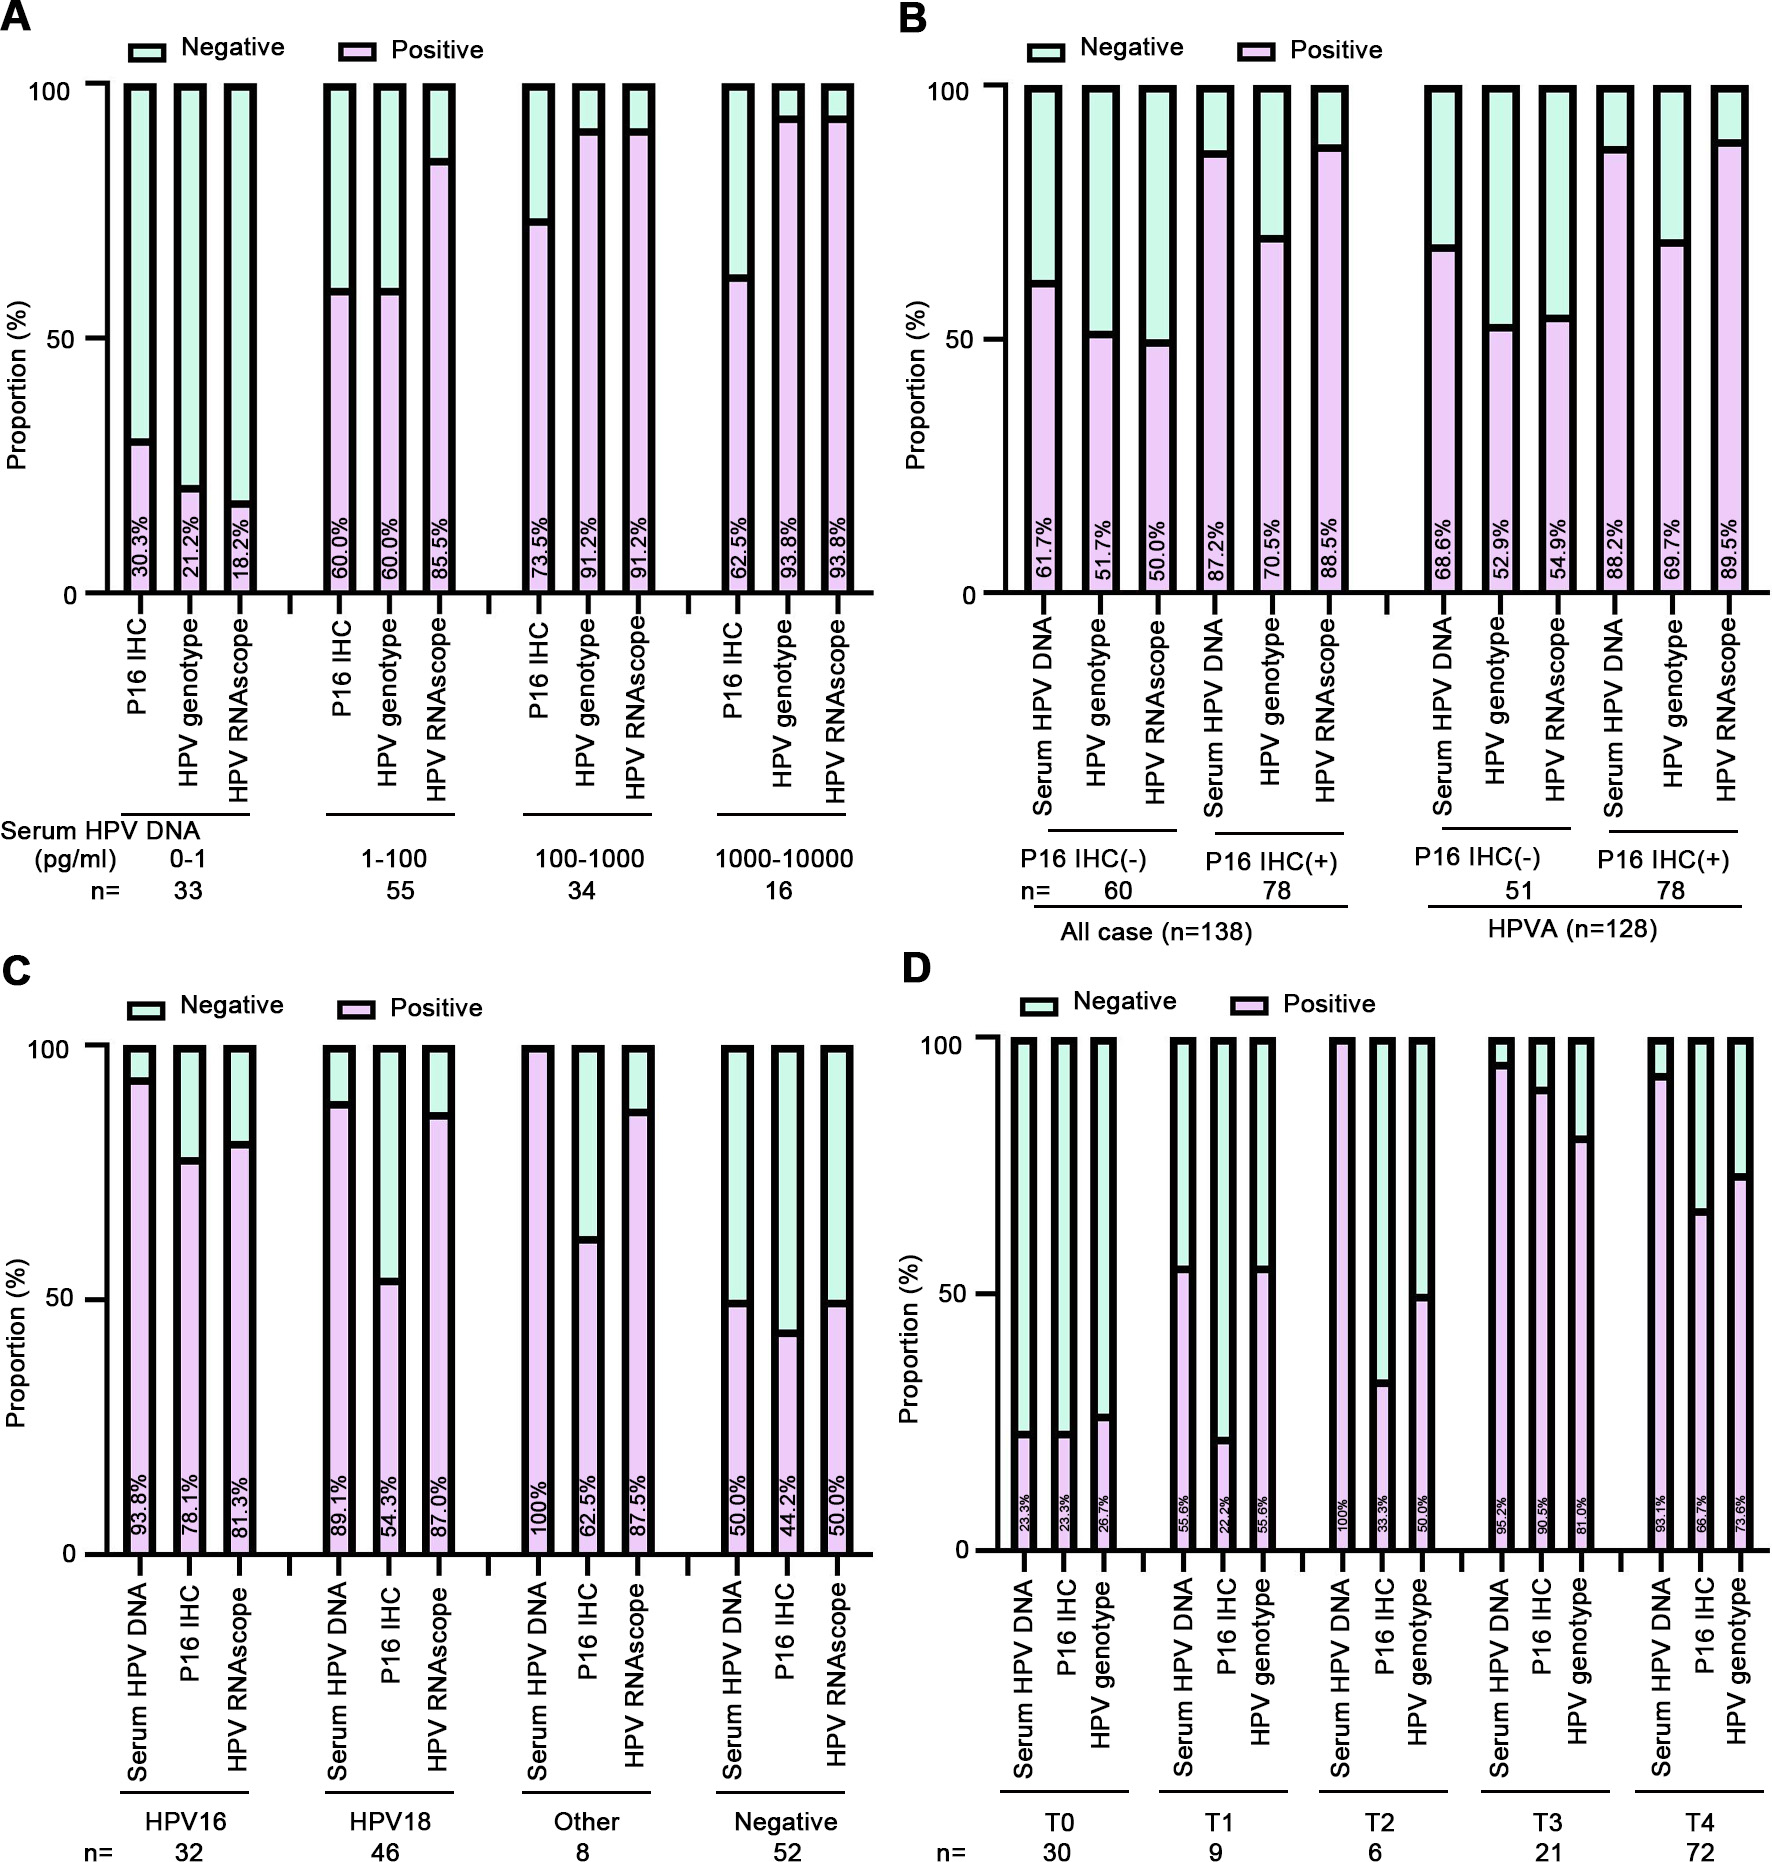
The correlations among serum HPV DNA level, p16 IHC, HPV genotype, and HPV E6/E7 RNAscope were also studied (Table S2). A significantly higher proportion of ECA cases were positive for p16 IHC, HPV genotype, and HPV E6/E7 RNAscope in subgroups with HPV DNA levels that differed by 10-fold. In patients with serum HPV DNA levels of 1–100 pg/mL, the p16 IHC positivity was similar to that of HPV genotype (60%), while those with serum HPV DNA levels of 100–10,000 pg/mL, HPV genotype positivity was similar to that of HPV E6/E7 RNAscope (93.8%). The HPV E6/E7 RNAscope positivity for the diagnosis of ECA was much higher compared to p16 IHC and HPV genotype (Fig. S4A). We also elicited that HPV E6/E7 RNAscope was positive in almost all cases that were p16 IHC positive (88.5% of all cases, 89.5% of HPVA cases), only that more cases were negative by IHC and serum levels (Fig. S4B). In different HPV subtypes, the positivity of RNAscope for the diagnosis of ECA was much higher compared to that of p16 IHC, but lower than HPV DNA (Fig. S4C). The HPV subtypes in patients with HPVA and NHPVA are listed in Table S3. In cases with RNAscope scores of 3 and 4, the HPV DNA positivity was higher than both p16 IHC and HPV genotype (Fig. S4D).
Multivariate analysis of overall survival
Univariate analysis indicated that the following variables were related to OS in patients with ECA: age (p = 0.002), HPV E6/E7 RNAscope (p = 0.006), tumor size (p = 0.005), FIGO stage (p < 0.001), histological type (p = 0.004), LVI (p < 0.001), invasion level of uterine cervix (p < 0.001), LNI (p < 0.001), parametrium invasion (p < 0.001), surgical margin (p = 0.006), chemotherapy (p = 0.009), radiotherapy (p < 0.001), p16 (p = 0.039), and Ki-67 (p = 0.025). In a multivariate analysis, the following items remained independently prognostic: age (HR = 0.250, 95% confidence interval [CI]: 0.099–0.632, p = 0.003), HPV E6/E7 RNAscope (HR = 0.240, 95% CI: 0.093–0.616, p = 0.003), LVI (HR = 1.924, 95% CI: 1.295–2.857, p = 0.001), and LNI (HR = 3.047, 95% CI: 1.183–7.849, p = 0.021). The results are shown in Table 2, with a forest plot in Fig. 2A. Kaplan–Meier analysis showed significant diversity (Fig. 2B–E).
Table 2
Univariate and multivariate Cox proportional hazards regression analysis for OS.
|
Variables
|
Univariate analysis
|
|
Multivariate analysis
|
|
HR (95% CI)
|
P value
|
|
HR (95% CI)
|
P value
|
|
Age (≤ 37 vs. >37 years)
|
0.316 (0.154–0.649)
|
0.002
|
|
0.224 (0.095–0.530)
|
0.001
|
|
HPV DNA (negative vs. positive vs. na)
|
0.868 (0.500-1.509)
|
0.616
|
|
|
|
|
HPV genotype (negative vs. positive vs. na)
|
1.004 (0.523–1.926)
|
0.992
|
|
|
|
|
HPV RNAscope (≤ 3.3 vs. >3.3)
|
0.337 (0.156–0.730)
|
0.006
|
|
0.288 (0.124–0.673)
|
0.004
|
|
Tumor size (≤ 4.5 vs. >4.5 cm)
|
3.165 (1.414–7.083)
|
0.005
|
|
0.773 (0.223–2.674)
|
0.684
|
|
FIGO stage (I vs. II vs. III vs. IV)
|
2.821 (1.703–4.672)
|
< 0.001
|
|
1.120 (0.613–2.013)
|
0.705
|
|
Histological type (HPVA vs. NHPVA)
|
0.266 (0.108–0.657)
|
0.004
|
|
1.365 (0.334–5.589)
|
0.665
|
|
Differentiation (good vs. moderate vs. poor)
|
1.435 (0.768–2.684)
|
0.258
|
|
|
|
|
LVI (none vs. focal vs. moderate vs. extensive)
|
2.056 (1.508–2.803)
|
< 0.001
|
|
1.770 (1.212–2.587)
|
0.003
|
|
Invasion level of uterine cervix (1/3 vs. 1/3 − 2/3 vs. 2/3)
|
3.147 (1.754–5.648)
|
< 0.001
|
|
1.532 (0.791–2.967)
|
0.206
|
|
Lymph nodes invasion (no vs. yes)
|
9.310(4.533–19.120)
|
< 0.001
|
|
2.838 (1.162–6.931)
|
0.022
|
|
Parametrium invasion (no vs. yes)
|
0.231 (0.094–0.568)
|
0.001
|
|
0.696 (0.217–2.234)
|
0.543
|
|
Surgical margin (no vs. yes)
|
0.263 (0.101–0.687)
|
0.006
|
|
1.621 (0.435–6.048)
|
0.472
|
|
Treatment (s vs. s + ct vs. s + rt vs. s + cr)
|
1.733 (1.298–2.313)
|
< 0.001
|
|
1.182 (0.851–1.641)
|
0.318
|
|
MMR status (dMMR vs. pMMR)
|
1.401 (0.426–4.610)
|
0.579
|
|
|
|
|
P16 IHC (negative vs. positive)
|
0.478 (0.237–0.963)
|
0.039
|
|
1.203 (0.507–2.854)
|
0.675
|
|
Ki-67 IHC (≤ 12.5% vs. >12.5%)
|
0.446 (0.220–0.906)
|
0.025
|
|
0.841 (0.348–2.035)
|
0.701
|
| HR, hazard ratio; CI, confidence interval. HPVA, HPV-associated adenocarcinoma; NHPVA, non HPV-associated adenocarcinoma; IHC, immunohistochemistry; LVI, lymph vascular invasion; dMMR, delete mismatch repair; pMMR, proficient mismatch repair; HPV genotype positive, HPV16, HPV18 and other types; s, surgery; s + ct, surgery + chemotherapy; s + rt, surgery + radiotherapy; s + cr, surgery + chemoradiation; na, not avaiable. |
Construction of the prognostic nomogram model and comparison of predictive accuracy between Nomogram model, FIGO stage and treatment.
Two different nomograms that predict the OS of ECA patients were built and compared for efficiency. Nomogram A included age, HPV E6/E7 RNAscope, LVI, and LNI, while nomogram B included age, HPV E6/E7 RNAscope, LVI, LNI, FIGO stage, and treatment. The results of time-dependent ROC curve for OS showed that AUCs of nomogram A and FIGO stage were higher than treatment (Fig. 3A). The resulting variables from the Cox proportional analysis were used to build the prognostic nomograms for OS (Fig. 3B and 3C). Each prognostic factor within the nomogram was assigned a point. By sum of the total points from all variables combined with the location the total point scale allowed us to obtain the probabilities of the outcomes by drawing a vertical line towards the axis labeled “1-, 3-, 5-Year survival probability” (Fig. 3B and 3C). The results of the comparison of efficiency between our nomogram and the conventional systems are shown in Table 3. In the two nomograms, no significant difference was observed (C-index: 0.825, 95% CI = 0.754–0.896 vs. 0.836, 95% CI = 0.771–0.902). The C-index of nomogram A (0.825, 95% CI = 0.754–0.896) was better than those of the FIGO system (0.653, 95% CI = 0.567–0.740) and treatment (0.578, 95% CI = 0.506–0.651). In Fig. 4A and 4B, the calibration plot for the OS rates for 1, 3, and 5-years was in line with both the nomogram and the actual observation. Besides, our model seemed to have a higher prediction accuracy (Fig. 4C).
Table 3
The C-index of our model, FIGO stage, Treatment for prediction of OS in the ECA.
|
Factors
|
C-index
|
95 CI%
|
P
|
|
Nomogram A
|
0.825
|
0.754–0.896
|
|
|
FIGO stage
|
0.653
|
0.567–0.740
|
|
|
Treatment
|
0.578
|
0.506–0.651
|
|
|
Nomogram B
|
0.836
|
0.771–0.902
|
|
|
Nomogram A vs FIGO stage
|
|
|
0.002
|
|
Nomogram A vs Treatment
|
|
|
< 0.001
|
|
Nomogram A vs Nomogram B
|
|
|
0.139
|
| Nomogram A: age + HPV RNA scope + LVI + LNI |
| Nomogram B: age + HPV RNA scope + LVI + LNI + FIGO stage + Treatment |
| C-index = concordance index; LVI, lymph vascular invasion; LNI, lymph node involvement; P values are calculated based on normal approximation using function rcorrp.cens in Hmisc package. |
Risk stratification of prognosis
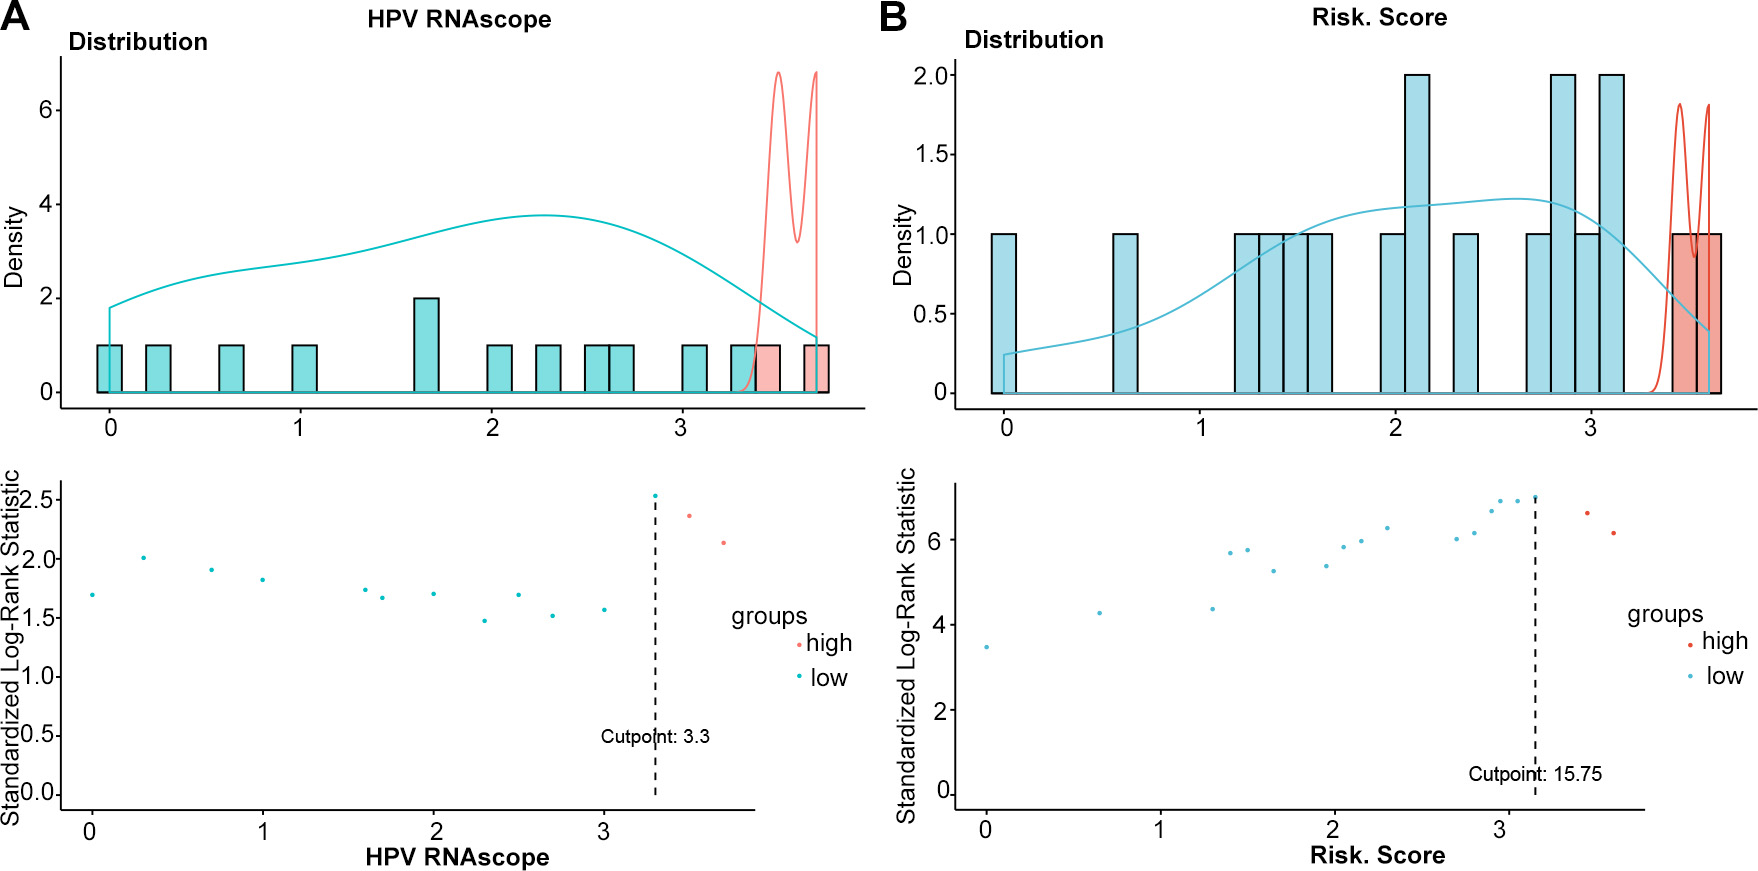
All patients were divided into a low (≤ 15.75) and a high-risk group (> 15.75) for OS (Fig. S2B). The 1,3, and 5-year OS rates were 94.2%, 84.3%, 70.3%, respectively, in the low-risk group and 71.4%, 46.4%, 10.7%, respectively, in the high-risk group (Table 4). Moreover, significant differences in OS were noted between patients with stage I/II ECA and those with III/IV ECA (Fig. 5). Each risk subgroup represented a distinct prognosis, and our system accurately separated the OS rates of the two subgroups.
Table 4. Point Assignment and Prognostic Score of the nomogram model
|
Variables
|
Prognostic Score
|
1-Year OS (%)
|
3-Year OS (%)
|
5-Year OS (%)
|
|
Age (years)
|
|
|
|
|
|
≤ 37
|
7.5
|
11.8
|
26.5
|
35.3
|
|
> 37
|
0
|
1.8
|
6.0
|
10.8
|
|
HPV RNA scope
|
|
|
|
|
|
≤ 3.3
|
7
|
5.1
|
13.1
|
21.2
|
|
> 3.3
|
0
|
2.0
|
5.9
|
8.9
|
|
Lymph nodes invasion
|
|
|
|
|
|
No
|
0
|
1.9
|
4.5
|
7.1
|
|
Yes
|
8.25
|
8.7
|
26.1
|
41.3
|
|
Lymph vascular invasion
|
|
|
|
|
|
None
|
0
|
1.4
|
6.5
|
10.1
|
|
Focal
|
3.25
|
2.7
|
10.8
|
13.5
|
|
Moderate
|
6.5
|
13.3
|
20.0
|
26.7
|
|
Extensive
|
9.75
|
20.0
|
30.0
|
70.0
|
|
Total prognostic Score
|
|
|
|
|
|
≤ 15.75
|
|
94.2
|
84.3
|
70.3
|
|
> 15.75
|
|
71.4
|
46.4
|
10.7
|
Table 5
Diagnostic performances of studied testing for ECA patients.
|
Table Table 4. Point Assignment and Prognostic Score of the nomogram model
|
|
Variables
|
Prognostic Score
|
1-Year OS (%)
|
3-Year OS (%)
|
5-Year OS (%)
|
|
Age (years)
|
|
|
|
|
|
≤ 37
|
7.5
|
11.8
|
26.5
|
35.3
|
|
> 37
|
0
|
1.8
|
6.0
|
10.8
|
|
HPV RNA scope
|
|
|
|
|
|
≤ 3.3
|
7
|
5.1
|
13.1
|
21.2
|
|
> 3.3
|
0
|
2.0
|
5.9
|
8.9
|
|
Lymph nodes invasion
|
|
|
|
|
|
No
|
0
|
1.9
|
4.5
|
7.1
|
|
Yes
|
8.25
|
8.7
|
26.1
|
41.3
|
|
Lymph vascular invasion
|
|
|
|
|
|
None
|
0
|
1.4
|
6.5
|
10.1
|
|
Focal
|
3.25
|
2.7
|
10.8
|
13.5
|
|
Moderate
|
6.5
|
13.3
|
20.0
|
26.7
|
|
Extensive
|
9.75
|
20.0
|
30.0
|
70.0
|
|
Total prognostic Score
|
|
|
|
|
|
≤ 15.75
|
|
94.2
|
84.3
|
70.3
|
|
> 15.75
|
|
71.4
|
46.4
|
10.7
|
|
HPVA vs. NHPVA
|
AUC
|
95%CI
|
Sensitivity
|
Specificity
|
|
P16 IHC
|
0.751
|
0.620–0.882
|
0.602
|
0.900
|
|
HPV DNA
|
0.802
|
0.653–0.951
|
0.805
|
0.800
|
|
HPV genotype
|
0.566
|
0.379–0.754
|
0.633
|
0.500
|
|
HPV RNAscope
|
0.799
|
0.629–0.929
|
0.758
|
0.800
|
| AUC, area under curve; 95%CI, 95% confident interval; HPVA, HPV-associated adenocarcinoma; NHPVA, nonHPV-associated adenocarcinoma; IHC, immunohistochemistry; HPV RNAscope. |