The objective of the present work was to optimize ritonavir (RTV) loaded nanostructured lipid carriers (NLCs) to improve bioavailability using quality by design (QbD) based technique. Risk assessment was studied using ‘cause and effect’ diagram followed by failure mode effect analysis (FMEA) to identify the effective high-risk variables for the formulation development. Quality target product profile (QTPP) and critical quality attributes (CQAs) were initially assigned for the proposed product. Central composite rotatable design (CCRD) was used to identify the individual and combined interactions of formulation variables. RTV loaded NLC (RTV-NLC) was prepared using emulsification-ultrasonication method. The effect of formulation variables like ultrasound amplitude, lipid concentration, surfactant concentration on their responses like particle size, polydispersity index (PDI), and entrapment efficiency (EE) were studied by CCRD. The optimized formulation was subjected to lyophilization to obtain dry NLCs for solid-state analysis. DSC and PXRD investigations showed RTV was molecularly dispersed in lipid matrix indicating amorphous form present in the formulation. FESEM and AFM depicted the spherical and uniform particles. The enhanced solubility and dissolution may be attributed due to the reduced particle size. The optimized NLCs showed good physical stability during storage for six months. RTV-NLC was further subjected to in vitro studies and found a successful sustained release rate of 92.37±1.03 %. The parallel artificial membrane permeability assay (PAMPA) and everted gut sac model have demonstrated the permeation enhancement of RTV. In vivo study observed the enhanced bioavailability with 2.86 fold suggesting optimized NLC successfully overcome the issue of solubility.
Research Article
Development of Ritonavir Loaded Nanostructured Lipid Carriers Employing Quality By Design (QbD) As A Tool: Characterizations, Permeability, And Bioavailability Studies
https://doi.org/10.21203/rs.3.rs-695187/v1
This work is licensed under a CC BY 4.0 License
You are reading this latest preprint version
Ritonavir
Quality by design (QbD)
Central composite rotatable design (CCRD)
Nanostructured lipid carriers (NLCs)
Permeability
Table 1. QTPP and CQAs for the preparation of NLCs and their justifications.
|
QTPP |
Target |
Justification(s) |
|
Dosage form |
Freeze-dried Nanocarriers |
Solid dosage form is a preferred choice of the patient because it easily enhances the lymphatic uptake due to its nanosize thereby increases the bioavailability. |
|
Dosage type |
Controlled release |
Superior absorption is possible with controlled release from NLCs.
|
|
Route of administration |
Oral |
Most preferred route for all including adults and child for the HIV treatment.
|
|
Drug content |
85-95 % |
IT is important to maintain the therapeutic requirement and need for treatment. |
|
Drug release |
More than 85 % |
Required for effective treatment and therapy inventiveness for improvement of bioavailability of the drug.
|
|
Pharmacokinetics |
Maximum Cmax, Tmax and AUC determine performance.
|
The maximum plasma concentration attained versus time provides a higher drug absorption rate and enhance bioavailability. |
|
Stability |
12 months |
The therapeutic potential of the drug in NLCs depends on particle size. The formulation should not have great variation during storage. |
|
Alternate route |
- |
NA |
|
CQAs |
Target |
Justification(s) |
|
Particle size |
Average particle size below 250 nm |
Reduced particle size and increased surface area enables efficient active movement in permeation through GI epithelial lining. The benefit of reduced size is in the enhancement of solubility and bioavailability. |
|
Dispersity index |
Less than 0.300 |
The dispersity higher than 0.3 indicates the broader dispersity of particles. The dispersity index below 0.3 is acceptable for the nanoformulation. |
|
EE |
Higher |
Higher EE ensures higher encapsulation and drug loading. The controlled release from the carrier can be obtained for higher therapeutic benefits. |
Table 2 CCRD for different experimental run and their responses
|
|
Independent variables |
Dependent variable (Response) |
||||
|
Run |
Ultrasound amplitude (A) (%) |
Lipid concentration (B) (%) |
Surfactant concentration (C) (%) |
Particle size (Y1) |
PDI (Y2) |
EE (Y3) |
|
1 |
40 |
2 |
0.29 |
191.1±1.01 |
0.311±2.12 |
87.01±1.20 |
|
2 |
40 |
2.70 |
1 |
213.5±2.05 |
0.204±2.93 |
92.03±2.12 |
|
3 |
54.14 |
2 |
1 |
164.4±1.03 |
0.362±1.03 |
68.04±0.23 |
|
4 |
50 |
1.5 |
1.5 |
159.3±1.06 |
0.215±0.32 |
81.10±1.32 |
|
5 |
40 |
2 |
1 |
187.9±1.23 |
0.209±1.06 |
83.20±1.43 |
|
6 |
30 |
2.5 |
1.5 |
227.4±2.01 |
0.214±0.34 |
94.30±3.23 |
|
7 |
40 |
2 |
1 |
190.1±2.03 |
0.186±1.32 |
84.12±1.32 |
|
8 |
25.85 |
2 |
1 |
247.4±1.13 |
0.288±3.02 |
80.01±3.12 |
|
9 |
40 |
2 |
1 |
184.8±1.04 |
0.209±1.43 |
81.10±0.32 |
|
10 |
40 |
1.29 |
1 |
172.1±0.53 |
0.135±0.23 |
91.04±0.43 |
|
11 |
40 |
2 |
1 |
202.2±0.94 |
0.144±0.34 |
74.03±1.04 |
|
12 |
40 |
2 |
1.70 |
162.2±1.04 |
0.241±1.07 |
92.10±1.23 |
|
13 |
30 |
1.5 |
0.5 |
161.1±2.32 |
0.221±1.22 |
84.05±1.42 |
|
14 |
50 |
2.5 |
0.5 |
228.9±1.32 |
0.188±0.43 |
94.03±0.33 |
|
15 |
40 |
2 |
1 |
189.5±0.34 |
0.231±1.08 |
84.20±0.12 |
Mean ± SD, (n=3); Lower values (-1) were represented by 30 % (A), 1.5 % (B), 0.5 % (C); Middle values (0) were represented by 40 % (A), 2 % (B), 1 % (C); and Higher values (+1) were represented by 50 % (A), 2.5 % (B), 1.5 % (C). Minimum alpha values (axial points) (-α) were represented by 25.85 %, 1, 29 % and 0.29 %; Maximum alpha values (axial points) (+α), were represented by 54.14 %, 2.70 %, and 1.70 %
Table 3. Results for confirming optimization of formulation (RTV-NLCs).
|
Experimental variables |
|
|
|
|
||
|
Ultrasound amplitude (%) |
Lipid conc. (%) |
Surfactant conc. (%) |
Responses |
Predicted values |
Observed values |
% Bias |
|
40 |
1.82 |
1.43 |
Particle size |
189.86 |
187.23±1.03 |
1.3 |
|
|
|
|
PDI |
0.110 |
0.219±0.02 |
99 |
|
|
|
|
EE |
95.96 |
92.01±1.21 |
4.11 |
Table 4. Stability study for optimized RTV loaded NLCs.

Values are expressed as mean ± SD, (n=3) and statistical significant difference (p-value < 0.05).
Table 5. Apparent permeability through intestine in rat gut sac model and pharmacokinetic profile of RTV-NLCs, PM, and RTV-suspension in rat plasma.
|
Formulations |
Apparent permeability (Papp) |
|
Optimized RTV-NLCs |
18.32 |
|
RTV-PM |
7.825 |
|
RTV-Suspension |
6.25 |
Table 6. Pharmacokinetic profile of RTV-NLCs, PM and RTV-suspension in rat plasma.
|
Pharmacokinetic parameters |
RTV-Suspension |
RTV-PM |
RTV-NLCs |
|
Tmax (h) |
2 |
4 |
4 |
|
Cmax (µg/mL*h) |
0.165 ±0.12 |
0.255±0.03 |
0.472 ±0.21 |
|
AUC 0-t (µg/mL*h) |
2.40 ±0.24 |
2.99±2.32 |
4.44 ±0.11 |
|
AUC 0-∞ (µg/mL*h) |
2.67 ±0.02 |
3.90±2.10 |
3.44 ±2.82 |
|
MRT |
10.15±1.25 |
16.28±1.12 |
11.62±0.21 |
|
Vz/F |
1418.5±1.32 |
1695.24±1.01 |
802.04±0.21 |
|
Cl/F |
153.38±0.01 |
102.51±0.21 |
78.26±0.12 |
|
Relative bioavailability |
- |
- |
286 |
Values are expressed as mean±SD, (n=3) and statistical data were analyzed by one-way ANOVA and followed by Dunnett’s tests, with significance level p < 0.05. Cmax: maximum concentration, AUC: Area under curve, MRT: mean residence time; Tmax: time to attain maximum concentration.
- Fig.S1Overlayplot.pptx
Fig. S1. An overlay plot.
- Fig.S2xrpd.pptx
Fig. S2. PXRD spectra of pure RTV and optimized RTV-NLCs.
- Supplementarydata.docx
- TableS1FMEA.docx
- TableS2ANOVA.docx
- TableS3Fitsumary.docx
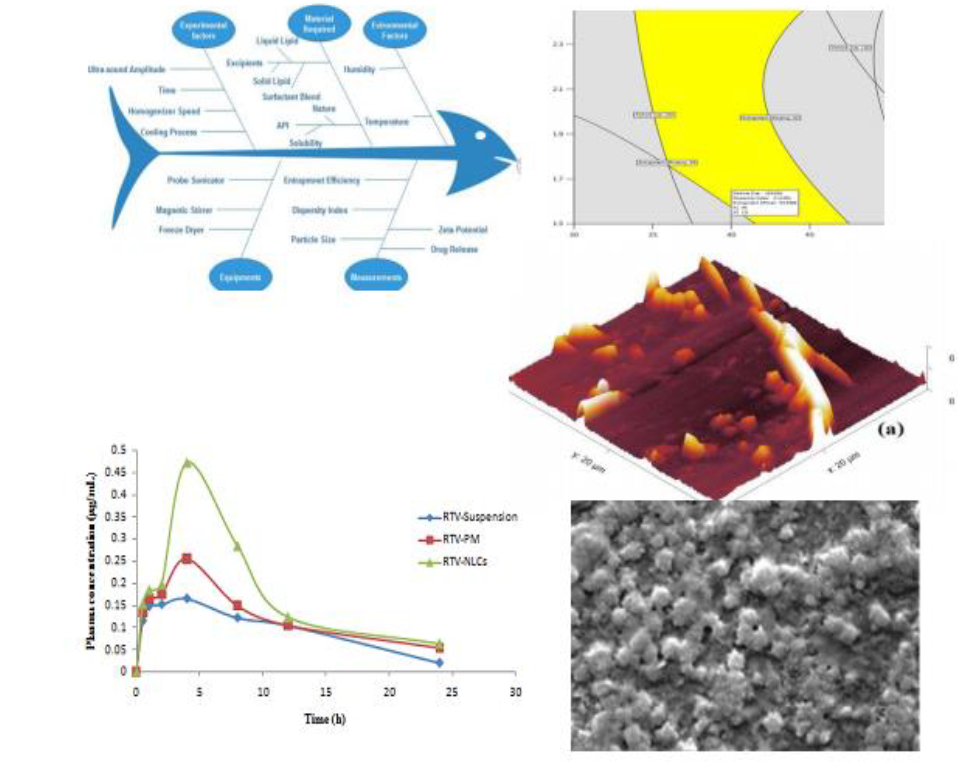
- GraphicalAbstract.png