Effects of combinatorial silencing of G1 cyclins on cell growth
The rate of CCND1 and CCNE mRNA expression was significantly reduced (P <0.05) following 72 h post-transfection than the non-treated cells. At this point, the qPCR analysis showed a 0.48- and 0.41-fold change in expression of CCND1 and CCNE genes (down-regulation) after transfection (Figure 2A).
Treatment of cells by dual shRNA plasmid depleted G1 cyclins proteins after 48 and 72 h post-transfection. Following 72 h post-transfection, the protein expression of CCND1 and CCNE was reduced by 36% and 26%, respectively (Figure 2B), compared to the control group. The densitometry analysis indicated a reduction expression of target proteins (Figure 2C), which was accorded with the RT-QPCR experiment.
The expression of dual shRNA plasmid in MDA-MB-231 cells was significantly reduced the cell growth following 72 h post-transfection (P<0.05). The proliferation of transfected cells decreased time-dependently (Figure 3). Simultaneously, the cell proliferation inhibitory effect of this construct was not detected at 24 h after transfection (P>0.05). Also, it was not statistically significant 48 h post-transfection.
The inhibitory effect of the construct on cell proliferation was 31.94% and 94.82% in 48 and 72 h post-transfection, respectively. These results indicate that the reduction of G1 cyclins levels is closely related to the proliferation of MDA-MB-231 breast cancer cells.
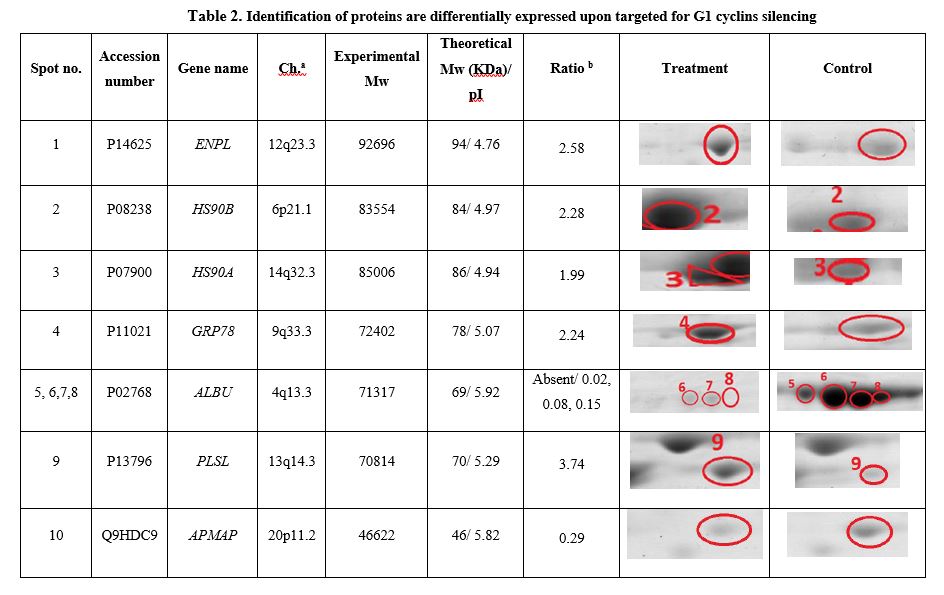
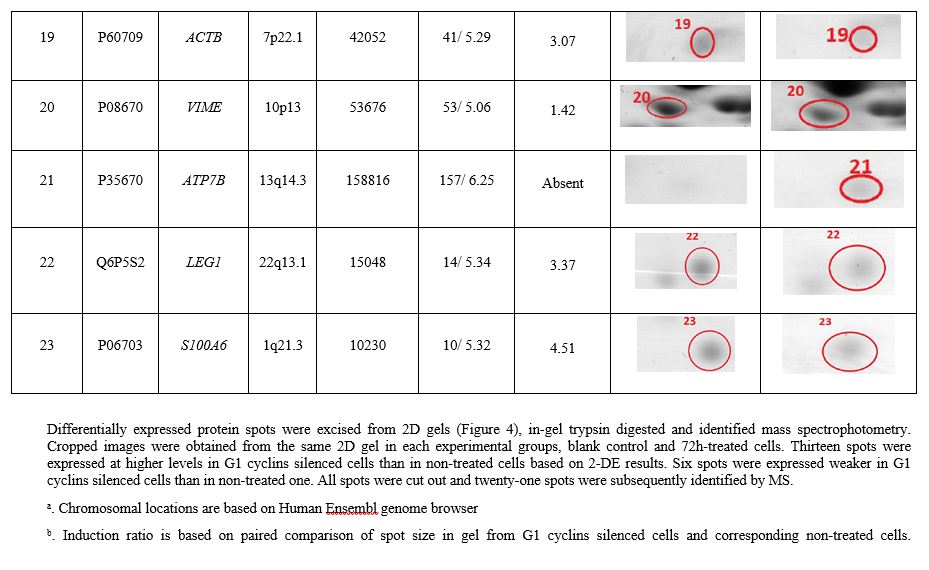
Identification of G1 cyclins silencing-regulated proteins
The expression pattern of downstream responsive proteins associated with RNAi-induced G1 cyclins was identified by comparing 2D gel electrophoresis in treated and non-treated cells (Figure 4). In total, 23 proteins consistently appeared to be differentially expressed, of which 13 up-regulated and six down-regulated (Table 2). It should be noted that among down-regulated proteins, two samples were not detected. The regulated proteins in response to the silencing of G1 cyclins are S100A6 (+ 4.51), LCP1 (+ 3.74), LDHA (+3.37), C6orf58 (LEG1, +3.37), and ACTB (+3.07) which that found they were greatly up-regulated. Also, the expression of other proteins such as PGK1 (+2.88), HSP90B1 (+2.58), HSP90AB1 (+2.28), HSPA5 (+2.24), ALDOA (+2.24), EIF4A1 (+2.01), HSP90AA1 (+1.99), and VIM (+1.42) were moderately increased. Whilst, ATP7B (absent), ALBU (-2.02), APMAP (-0.29), HIST1H2AA (-0.36), and EIF3G (-0.35) were significantly down-regulated. As shown in the table (Table 2), the theoretical masses and the isoelectric points of these proteins were almost the same, suggesting that they could be closely located on 2D-PAGE.
In silico expression profile of G1 cyclins-regulated proteins
According to the GEPIA database, the expression profile of regulated proteins in response to the silencing of G1 cyclins in breast carcinoma was presented in the box plot diagram. The results revealed that four out of 18 regulated proteins-G1 cyclins (LCP1, HSP90AA1, VIM, and ALB) were significantly associated with breast carcinoma (Figure 5A). It can be seen from this diagram that ALB and VIM are lower expressed, while LCP1 and HSP90AA1 are highly expressed in tumor than paired healthy breast tissues. Meanwhile, results of the GEPIA and the UALCAN databases revealed that the expression of S100A6, LEG1, VIM, were significantly reduced in primary breast invasive tumors, while APMAP and ATP7B were highly expressed (Figure 5B). However, their expression was altered by dual shRNA vector treatment in MDA-MB-231 cells.
Gene enrichment analysis
Gene ontology (GO) and KEGG pathway surveys were conducted to achieve the primary understanding of these DEPs. According to the PANTHER molecular function analysis, the up-regulated proteins were mostly enriched in binding (GO:0005488; 64.3%), catalytic activity (GO:0003824; 21.4%), translation regulator activity (GO:0045182; 7.1%), and structural molecule activity (GO:0005198; 7.1%). As for the down-regulated proteins, they were enriched in binding (GO:0005488; 33.3%), catalytic activity (GO:0003824; 33.3%), and transporter activity (GO:0005215; 33.3%) (Figure 6A). We also found that the most up-regulated proteins by G1 cyclins were involved in the cellular process (GO:0009987; 30%), metabolic process (GO:0008152; 16.7%), biological regulation (GO:0065007; 13.3%), and response to a stimulus (GO:0050896; 13.3%) (Figure 6B).
Meanwhile, the KEGG pathway analysis suggested that the DEPs were enriched in 55 pathways (Table 3). The top 10 pathways illustrate in the above table. HSP90AA1, HSP90AB1, and HSP9B1 correspond to the prostate cancer, PI3K-Akt signaling pathway, and pathways in cancer. Moreover, the HIF-1 signaling pathway (LDHA; ALDOA; PGK1), microRNAs in cancer (VIM), and apoptosis along with the proteoglycans in cancer (ACTB) were attributed to cancer.
Protein interaction analysis
For the functional classification of DEPs in MDA-MB-231 cells exposed to RNAi-induced silencing of G1 cyclins, the PPI network was constructed with at least an average score (0.40) by STRING resource (Figure 7A). It should be noted that no interaction has been found for S100A6, LEG1, and APMAP among DEPs. As can be seen from this network, CCNE did not straightly interact with the identified DEPs in MDA-MB-231 cells. Although, further analysis revealed that it interacted with ACTB through CDK2. This gene, CDK2, also binds to HSP90AA1. Meanwhile, CCNE can interact with HSP90B1 and HSP90AB1 using CDK6 along with CDC37. Additionally, the function of regulated proteins-G1 cyclins was assessed by reconstructing the molecular action network (Figure 7B). Catalysis and binding activity were found among CCND1 and CCNE1. The molecular mechanism analysis showed that ALDOA activates the CCND1.
Furthermore, to assess the functionally linked proteins, the protein associated with the proliferation of tumor cells (MAPK1; MYC; TP53; PTEN; BCL2), hypoxia condition (HIF1A) along with angiogenesis (VEGFA) were attached to the list of DEPs and analyzed by STRING network (Figure 7C). We found that CCND1 interacts with MAPK1, VEGFA, and TP53 based on the experimental criteria, while interacts with MYC, BCL2, PTEN, and HIF1A, according to the text mining criteria with minimum confidence. However, no interaction of CCNE1 with HIF1A, MAPK1, and BCL2 was found. Although, according to the experimental criteria, CCNE1 interacts with TP53, MYC, and PTEN. These results depicted a core network of G1 cyclins with cancer-related genes that suggested a noteworthy task of G1 cyclins in carcinogenesis.
PPI network analysis
The CytoHubba application identified the central nodes in the PPI network. A network of regulated proteins by G1 cyclins was illustrated based on betweenness centrality, degree, and co-expression parameters (Figure 8A). It can be seen from this data that ACTB, HSP90AA1, ALB, HSPA5, and CCND1 are critical nodes in degree parameters. Moreover, the top 10 genes interaction analysis showed that CCND1 activated by ACTB, HSP90AA1, and ALB (Figure 8B).
Meanwhile, HSP90AA1, TP53, and ACTB are identified as critical nodes based on the degree criteria in the constructed network with the DEPs along with cancer-related genes (Figure 8C). Additionally, Figure 8D shows an overview of interaction among the top 10 genes in the above network. It is apparent that all cancer-related genes (VEGFA; HIF1A; TP53; PTEN; MYC) with HSP90AA1, ACTB, ALB, and HSPA5 activated cyclin D1. Additionally, HSP90AA1 and ACTB activated the TP53 gene, suggesting their contribution to tumor cell survival.
Table 3
The KEGG pathway associated to the differentially expressed proteins in response to G1 cyclins silencing in breast cancer
| Term | P-value | Adjusted P-value | Combined Score | Genes |
| Glycolysis / Gluconeogenesis | 1.05E-05 | 0.001077 | 778.1623 | LDHA; PGK1; ALDOA |
| Antigen processing and presentation | 1.53E-05 | 0.001175 | 664.7429 | HSP90AA1; HSP90AB1; HSPA5 |
| Fluid shear stress and atherosclerosis | 1.52E-6 | 4.69E-04 | 593.0624 | HSP90AA1; HSP90AB1; ACTB; HSP90B1 |
| IL-17 signaling pathway | 2.69E-05 | 0.001658 | 522.2288 | HSP90AA1; HSP90AB1; HSP90B1 |
| Prostate cancer | 3.05E-05 | 0.001567 | 494.6895 | HSP90AA1; HSP90AB1; HSP90B1 |
| HIF-1 signaling pathway | 3.34E-05 | 0.001472 | 475.6398 | LDHA; PGK1; ALDOA |
| Protein processing in endoplasmic reticulum | 3.01E-06 | 4.64E-04 | 474.1219 | HSP90AA1; HSP90AB1; HSPA5; HSP90B1 |
| Estrogen signaling pathway | 8.55E-05 | 0.003292 | 315.5565 | HSP90AA1; HSP90AB1; HSP90B1 |
| Thyroid hormone synthesis | 0.001026 | 0.035111 | 286.1586 | HSPA5;HSP90B1 |
| Protein export | 0.014852 | 0.285893 | 281.5819 | HSPA5 |