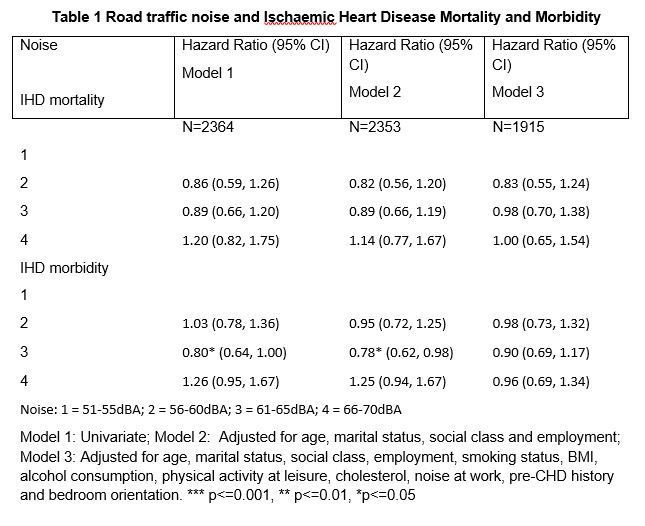
IHD morbidity or mortality was not associated with road traffic noise exposure in these analyses (Table 1). In the initial model there was a suggestion of lower IHD morbidity in the 61-65 dBA noise category but this was not observed in the model with full adjustment. There was no statistically significant interaction between road traffic noise exposure and noise sensitivity and either IHD morbidity or mortality.
In order to test the full impact of noise sensitivity on physical health, associations with IHD mortality were examined. IHD mortality rather than all-cause mortality was selected because of previous analyses showing associations between environmental noise and IHD mortality. High noise sensitivity, somewhat unexpectedly, was found to be associated with a lower risk of IHD mortality than medium and low noise sensitivity (HR=0.71, 95%CI 0.54-0.94) (Figure 1, TW3= high noise sensitivity). Noise sensitivity was associated with a lower risk of IHD mortality even after full adjustment (Table 2). Noise annoyance was not associated with IHD mortality (Table 2). Noise sensitivity was replaced in the model by trait anxiety to test whether trait anxiety had a similar association with mortality as noise sensitivity. There was a similar lower risk of mortality associated with high trait anxiety (HR=0.68, 95%CI 0.49, 0.94).
Table 2 Ischaemic Heart Disease Mortality and Morbidity by Noise Annoyance and Noise Sensitivity Ischaemic Heart Disease Mortality
|
Noise Annoyance
|
Hazard Ratio (95% CI)
Model 1
|
Hazard Ratio (95% CI)
Model 2
|
Hazard Ratio (95% CI)
Model 3
|
Hazard Ratio (95% CI)
Model 4
|
|
|
N=2346
|
N=2336
|
N=1983
|
N=1900
|
|
Never/Seldom/
Sometimes
|
|
|
|
|
|
Often/Always
|
1.20 (0.73, 1.97)
|
0.93 (0.56, 1.54)
|
0.95 (0.56, 1.61)
|
0.86 (0.49, 1.50)
|
|
Noise Sensitivity (Tertiles)
|
|
|
|
|
|
|
N=2334
|
N=2328
|
N=1987
|
N=1883
|
|
1st Tertile
|
|
|
|
|
|
2nd Tertile
|
0.87 (0.69, 1.09)
|
0.91 (0.72, 1.15)
|
0.91 (0.71, 1.17)
|
0.85 (0.66, 1.10)
|
|
3rd Tertile
|
0.74* (0.58, 0.94)
|
0.74* (0.58, 0.95)
|
0.74* (0.56, 0.97)
|
0.71* (0.54, 0.94)
|
|
Ischaemic Heart Disease Morbidity
|
|
|
|
|
|
Noise Annoyance
|
|
|
|
|
|
|
N=2346
|
N=2336
|
N=1983
|
N=1900
|
|
Never/Seldom/
Sometimes
|
|
|
|
|
|
Often/Always
|
1.46* (1.03, 2.06)
|
1.11 (0.78, 1.59)
|
1.19 (0.82, 1.74)
|
1.12 (0.75, 1.68)
|
|
Noise Sensitivity (Tertiles)
|
|
|
|
|
|
|
N=2334
|
N=2328
|
N=1987
|
N=1883
|
|
1st Tertile
|
|
|
|
|
|
2nd Tertile
|
0.97 (0.82, 1.17)
|
1.03 (0.86, 1.23)
|
1.02 (0.84, 1.25)
|
0.96 (0.78, 1.17)
|
|
3rd Tertile
|
0.96 (0.80, 1.15)
|
0.94 (0.78, 1.13)
|
1.02 (0.84, 1.25)
|
0.95 (0.77, 1.16)
|
Model 1: Univariate
Model2: Adjusted for Age, Marital status, Social class and Employment
Model 3: Adjusted for Age, Marital status, Social class, Employment, Smoking status, BMI, Alcohol consumption, Physical activity at leisure and Cholesterol
Model 3: Adjusted for Age, Marital status, Social class, Employment, Smoking status, BMI, Alcohol consumption, Physical activity at leisure, Cholesterol, Noise at work, Pre CHD history, Bedroom orientation and Noise
*** p<=0.001, ** p<=0.01, *p<=0.05
There was no interaction between noise and annoyance and either IHD mortality or morbidity
Table 3 Ischaemic Heart Disease Mortality and Morbidity testing for interactions with noise annoyance
|
IHD Mortality
|
|
Hazard Ratio (95% CI)
|
Hazard Ratio (95% CI)
(With Interaction)
|
|
|
|
N=1900
|
N=1900
|
|
Noise
|
1
|
|
|
|
|
2
|
0.84 (0.56, 1.25)
|
0.76 (0.50, 1.17)
|
|
|
3
|
1.01 (0.71, 1.42)
|
1.00 (0.70, 1.43)
|
|
|
4
|
1.02 (0.66, 1.58)
|
1.18 (0.76, 1.83)
|
|
|
|
|
|
|
Noise Annoyance (NA)
|
Never/Seldom/Sometimes
|
|
|
|
|
Often/Always
|
0.86 (0.49, 1.50)
|
0.92 (0.42, 2.04)
|
|
|
|
|
|
|
Noise, NA Interaction
|
2, Often/Always
|
|
3.41 (0.80, 14.59)
|
|
|
3, Often/Always
|
|
0.99 (0.27, 3.66)
|
|
|
4, Often/Always
|
|
0.19 (0.02, 1.66)
|
|
IHD Morbidity
|
|
|
|
|
|
|
N=1900
|
N=1900
|
|
Noise
|
1
|
|
|
|
|
2
|
0.98 (0.73, 1.32)
|
0.93 (0.68, 1.27)
|
|
|
3
|
0.90 (0.69, 1.18)
|
0.86 (0.65, 1.14)
|
|
|
4
|
0.96 (0.68, 1.34)
|
1.00 (0.70, 1.42)
|
|
|
|
|
|
|
Noise Annoyance (NA)
|
Never/Seldom/Sometimes
|
|
|
|
|
Often/Always
|
1.12 (0.75, 1.68)
|
0.90 (0.47, 1.70)
|
|
|
|
|
|
|
Noise, NA Interaction
|
2, Often/Always
|
|
2.54 (0.75, 8.59)
|
|
|
3, Often/Always
|
|
1.74 (0.67, 4.52)
|
|
|
4, Often/Always
|
|
0.86 (0.28, 2.61)
|
Model: Adjusted for Age, Marital status, Social class, Employment, Smoking status, BMI, Alcohol consumption, Physical activity at leisure, Cholesterol, Noise at work and Bedroom orientation.
*** p<=0.001, ** p<=0.01, *p<=0.05
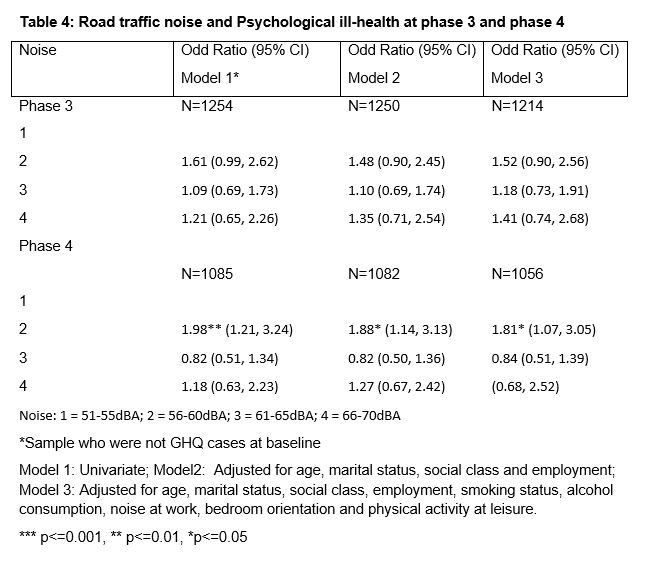
When examining incident cases of psychological ill-health a sample was selected from which GHQ cases were removed at baseline. A small significant association between road traffic noise at baseline and Phase 4 psychological ill-health was found even after initial adjustment in model 1 for sociodemographic factors but only among those exposed to 56-60dBA (OR= 1.98 95%CI 1.21, 3.24) (Table 4). This association was maintained in the final model after adjustment for health behaviours, noise at work, and bedroom orientation (OR= 1.81 95%CI1.07, 3.05). This was not statistically significant at phase 3.
At baseline there was an interaction between road traffic noise and noise sensitivity with phase 3 psychological ill-health. The men who were highly noise sensitive in the 66-70dBA (highest) noise exposure group had a high risk of psychological distress (OR= 7.57 95%CI 1.35, 42.49) (Table 5). This interaction was still present after adjustment for the Spielberger trait anxiety scale (OR= 7.36 95%CI 1.30, 41.64). There was high variability around this estimate. This interaction was not statistically significant using phase 4 data.
High and moderate levels of noise sensitivity at baseline were associated longitudinally with psychological ill-health at phase 3, (High noise sensitivity OR=1.82 95%CI1.30, 2.56; Moderate noise sensitivity OR= 1.58 95%CI 1.13, 2.21) (Table 5). Similarly, noise sensitivity predicted psychological ill-health at Phase 4 (High noise sensitivity OR= 1.78 95%CI 1.26, 2.52); Moderate noise sensitivity OR=1.67 95% CI 1.19, 2.35). This association remained statistically significant after further adjustment for trait anxiety (High noise sensitivity at Phase 3 adjusted for trait anxiety OR=1.53 95%CI 1.08, 2.18; High noise sensitivity at Phase 4 adjusted for trait anxiety OR=1.44 95%CI 1.00, 2.07).
High annoyance did not predict psychological ill-health in the sample with cases of psychological ill-health at baseline excluded although there was an association between annoyance and psychological ill-health at Phase 4 which was not statistically significant; this association was not found with Phase 3 psychological ill-health (Table 6). In the sample which included GHQ cases at baseline noise annoyance did predict psychological ill-health at Phase 4 (OR= 2.08 95%CI 1.00, 4.31). There was no interaction between noise and noise exposure and annoyance with psychological ill-health at either Phase 3 or Phase 4 (Table 6).
Table 6 Road traffic noise, noise annoyance and psychological ill-health GHQ: Phase 3- Noise Annoyance (No GHQ at Baseline)
|
|
|
Odds Ratio (95% CI)
|
Odds Ratio (95% CI)
(With Interaction)
|
|
GHQ Phase 3
|
|
N=1207
|
N=1201
|
|
Noise
|
1
|
|
|
|
|
2
|
1.56 (0.92, 2.62)
|
1.51 (0.89, 2.56)
|
|
|
3
|
1.20 (0.74, 1.95)
|
1.25 (0.77, 2.03)
|
|
|
4
|
1.46 (0.76, 2.80)
|
1.47 (0.75, 2.87)
|
|
|
|
|
|
|
Noise Annoyance (NA)
|
Never/Seldom/Sometimes
|
|
|
|
|
Often/Always
|
0.68 (0.19, 2.40)
|
0.85 (0.10, 7.37)
|
|
|
|
|
|
|
Noise, NA Interaction
|
2, Often/Always
|
|
2.50 (0.09, 70.92)
|
|
|
3, Often/Always
|
|
Empty
|
|
|
4, Often/Always
|
|
0.77 (0.03, 17.29)
|
|
|
|
|
|
|
GHQ: Phase 4
|
|
N=1051
|
N=1051
|
|
Noise
|
1
|
|
|
|
|
2
|
1.78* (1.05, 3.02)
|
1.85* (1.08, 3.15)
|
|
|
3
|
0.82 (0.49, 1.37)
|
0.81 (0.48, 1.37)
|
|
|
4
|
1.22 (0.63, 2.38)
|
1.36 (0.69, 2.69)
|
|
|
|
|
|
|
Noise Annoyance (NA)
|
Never/Seldom/Sometimes
|
|
|
|
|
Often/Always
|
2.43 (0.96, 6.13)
|
4.07 (0.99, 16.68)
|
|
|
|
|
|
|
Noise, NA Interaction
|
2, Often/Always
|
|
0.30 (0.02, 5.41)
|
|
|
3, Often/Always
|
|
0.80 (0.08, 7.90)
|
|
|
4, Often/Always
|
|
0.22 (0.01, 3.41)
|
Model: Adjusted for Age, Marital status, Social class, Employment, Smoking status, Alcohol consumption, Noise at work, Bedroom orientation and Physical activity at leisure.
Noise: 1 = 51-55dBA; 2 = 56-60dBA; 3 = 61-65dBA; 4 = 66-70dBA
*** p<=0.001, ** p<=0.01, *p<=0.05