Samples
Clinically normal corneas were collected from two adult female sheep immediately after slaughter at an abattoir (NZ) and from an adult male and female cat necropsied at Massy University Veterinary School for reasons unrelated to the current study. The central areas of the corneas, having the most uniform collagen fibril arrangement(2, 22), were divided to provide duplicate samples for the following treatments. As freezing has no effect on X-ray scattering patterns(15), normal control samples consisted of two cat and two sheep samples immediately frozen in cling wrap at -80°C. Remaining samples were immersed in 2mL of: 5% glutaraldehyde (40mL(25% glutaraldehyde), 50mL(0.2M cacodylate buffer), 80mL(distilled water)), 10% formalin (100mL(37-40% formaldehyde), 900mL(distilled water), 4.0g(monosodium phosphate) and (6.5g)anhydrous disodium phosphate), Triton X (20mM(tris-aminomethane), 1mM(ethylenediaminetetraacetic acid), 1.25mL(10% Triton X) and 1.25mL(sodium deoxycholate)) or 0.9% saline (4.5g(sodium chloride) in 500mL(deionized water with heat sterilization)). After four days of preservation the samples were tested for transparency by subjectively observing a 4mm by 4mm cross (1-point black line) through the sample (see Supplementary Material) and analysed by SAXS (below). Immediately thereafter, samples were fixed in Karnovsy’s fixative (2.0g(paraformaldehyde), 5.0mL(50% glutaraldehyde) and 20.0mL(0.2M cacodylate buffer); pH adjusted to 7.4 with 1M(sodium hydroxide)) for evaluation by TEM.
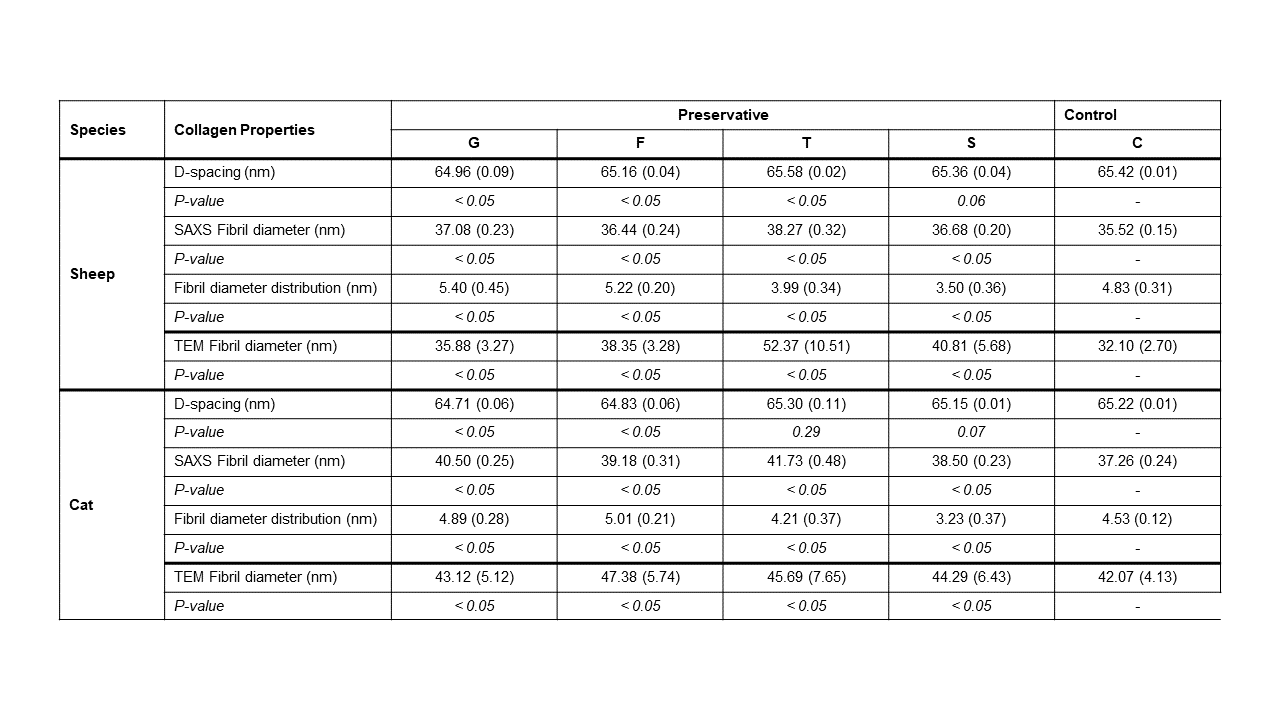
SAXS
At the SAXS/WAXS beamline of the Australian Synchrotron the samples were mounted flat-on to the X-ray beam (optical axis from anterior to posterior) and surface diffraction measurements performed using a 3x3 grid with 0.25mm spacing between points. A high-intensity undulator source from a cryo-cooled Si (111) double-crystal monochrometer was utilized with an energy resolution of 10-4. Beam size was 250 x 80µm and total photon flux approximately 2x10¹²photons.s-1. All diffraction patterns were calibrated with silver behenate and recorded at 12keV using a Pilatus 1M detector at 3337mm. Data was processed with ScatterBrain software. D-spacing was calculated by comparing diffraction peak positions of the 5th order peak with the calibrant to determine q-values, after background subtraction, using Gaussian approximations (Fig.1). Fibril diameters were determined over the full q-range (0.01Å-1 - 0.1Å-1) (Fig.1) by applying the ‘cylinder AR’ model using “Irena”, a macro developed for analysing particle size distributions in SAXS data(23) running in a data analysis tool (Igor Pro, Wavemetrics).The fibril diameter spread within a sample was determined from the scatter intensity patterns. The fibril diameter distribution was determined as the full width half maximum of the peak from the frequency vs fibril diameter histograms.
TEM
Corneas in Karnovsky’s fixative were trimmed, post-fixed in osmium tetroxide (0.1M), dehydrated with ethanol washes, and embedded in epoxy resin (TAAB812, UK). Ultra-thin sections (70-90nm) were cut (LeicaEMUC7, DE), mounted on copper-grids, stained with uranyl acetate and lead citrate, and viewed in a CM10 TEM(Philips, NL) at 80kV.
Image Processing
A Graphical User Interface (GUI), written in C++, was used to measure the collagen fibrils in end-on TEM images. A pixel-to-nanometre scale factor was computed with the GUI and used to detect contours which, with Delaunay triangulation and Voronoi diagrams, enabled measurements of fibril diameters and distances to nearest neighbours.