In this study, TiO2 nanorod arrays (TiO2) was fabricated and modified with the AgVO3 quantum dots (QDs) decorate on interfacing few-layer V2O5 to form a heterojunction material for removal pollutants and photoelectrochemical (PCE) water splitting. The AgVO3/V2O5-TiO2 nanorod arrays (AgVO3/V2O5-TiO2) synthesized by the secondary hydrothermal method were loaded with conductive glass, which facilitated the formation of one-dimensional (1D) nanorod and p-n junction structures. Through instrumentations, to investigate the structural, morphological, optical, photocatalytic and PCE characteristics of the materials. The TiO2 modified by AgVO3 and V2O5 can significantly improve the visible light optical absorption, the reduce the electron-hole pair binding rate and shorten the band gap (3.07-1.41eV) of TiO2. The resulting photocurrent density (116uA/cm2 ) and photodegradation efficiency (rate constant, k = 0.025min− 1) of AgVO3/V2O5-TiO2 are approximately 20 (6uA/cm2) and 5 times (0.005min− 1) higher than those of bare TiO2, respectively. The AgVO3/V2O5-TiO2 achieved a current density of 10mA at an overpotential of 246.2mV and exhibited excellent oxygen evolution reaction (OER) performance. The systematic PEC experiments concluded that the optimized of the TiO2 interface by AgVO3 and V2O5 could promote the separation and transport of charge carriers.
Research Article
Fabrication of a stable light-activated and p/n type AgVO3/V2O5-TiO2 heterojunction for pollutants removal and photoelectrochemical water splitting
https://doi.org/10.21203/rs.3.rs-736841/v1
This work is licensed under a CC BY 4.0 License
Journal Publication
published 01 Oct, 2021
Read the published version in Journal of Alloys and Compounds →
Version 1
posted
You are reading this latest preprint version
Double type-II band gap
Fermi level alignment
P-n junction heterojunction
Donor density
Photoelectrochemical activity
With the massive extraction of fossil fuels and their limited storage, solar energy has become the dominant option for future energy. Photoelectrochemical (PEC) water splitting technology uses two of the most abundant resources on earth - sunlight and water to produce sustainable and clean fuels. One of the main options for artificially achieving solar to chemical energy conversion is to integrate semiconductor materials with electrocatalysts in photovoltaic electrodes. Photovoltaic conversion converting solar energy to chemical energy is a prominent form of energy conversion. Photoconversion for solar-driven reactions shows wide promise in addressing energy and environmental challenges. However, a typical challenge in this field is that highly efficient photoabsorbers are not durable, while durable materials show poor efficiency. Therefore, the development of efficient and durable photovoltaic poles is crucial for solar energy production fuel applications. The performance of PEC and photocatalysis is largely dependent on the design of the photocatalyst. Properly tailored photocatalysts can achieve efficient light harvesting, excellent stability, facilitate charge separation and transport, and accelerate surface reactions [1]. In recent years, one-dimensional (1D) nanorod, nanotube and nanowire arrays have received increasing attention as photoelectrodes in PEC cell. The advantages of 1D nanostructured arrays are large surface area, fast electron transport paths, and low complexation rates [2, 3]. For instance, 1D undoped TiO2 nanorod arrays with a length of 2.1um were synthesized by our group [4, 5]. It can absorb light at wavelengths below about 400nm in the simulated sunlight spectrum. In principle, a well-separated and aligned TiO2 nanorod arrays is considered as an ideal light-harvesting device. This is due to the photogenerated holes (h+) and electrons (e−) inside the nanorods, which easily diffuse along the nanorod radius toward the side surface and the nanorod length toward the conductive glass substrate, thus effectively inhibiting the recombination process of charge carriers. Since the realization of photocatalytic water splitting on TiO2 electrode, semiconductor-based photocatalysis and photoelectrochemical water splitting has attracted tremendous attention. Specially, the bandgap of the TiO2 rutile phase (~ 3.0eV) is lower than that of the TiO2 anatase phase (~ 3.2eV), and the rutile phase is easy to prepare [4]. Therefore, the 1D TiO2 nanorod arrays has great potential for applications in photodegradation, PEC cells and dye-sensitised solar cells.
The wide absorption spectrum, efficient charge transfer and good stability of the semiconductors are decisive factors for the degradation of water pollution and water splitting. In order to the absorption limit under the sunlight irradiation, various strategies have been proposed to improve the photocatalysis and PCE performance of TiO2 materials, including nanostructures, passivated surfaces, co-catalysts, and doping with exotic elements. In general, most researchers develop composite materials using p-type materials and n-type photocatalysts, inspired by the basic p-n junction principle used in silicon solar cells [6, 7]. This structure is an excellent way to improve the light conversion efficiency of hybrid photocatalysts. TiO2 photocatalyst is a common n-type semiconductor structure. For example, Kin. et al. reported that a TiO2-MoS2[8, 9], TiO2-CuO and TiO2-CuO/Cu2O [10], composite photocatalyst exhibited better photocatalytic activity than bare TiO2. On the other hand, a good conductive 1D in a heterostructured array system should have a synergistic result between the internal array and the external shell. The internal array is mainly responsible for the high conductivity and the outer shell acts as a light collector to increase the absorption of visible light. However, studies on 1D TiO2 as an array of such composite structures are still lacking, which hinders further applications of 1D TiO2 in photocatalysis and photoelectrochemical [11].
Recently, vanadium oxides (V2O5) have been studied because of their low-cost and environmental friendliness compared to metallic oxide. V2O5 is the most commonly used major p-type metal oxide catalyst because it is a rising photocatalyst due to its narrow bandgap(~ 2.2eV), abundance, low cost, and high stability [12–15]. The rutile phase TiO2 nanorods is employed as a support due to their large surface area and high stability. AgVO3 based nanostructures have been demonstrated to be excellent oxygen evolution reaction catalysts [16–20], including compatible semiconductor photocatalysts. AgVO3 is used as an active additive and structure promoter to improve the catalyst activity of TiO2. On the other hand, the Ag particles in AgVO3 are photo-deposited between V2O5 and TiO2 as an intermediate electron-conducting bridge. The surface of TiO2 nanorods array increases the absorption of visible light through surface plasmon resonance. An ideal photocatalytic must be visible-light responsive, efficiently electron-hole separation and interfacial charge transfer, photochemically stable, as well as catalytic redox reaction[21].
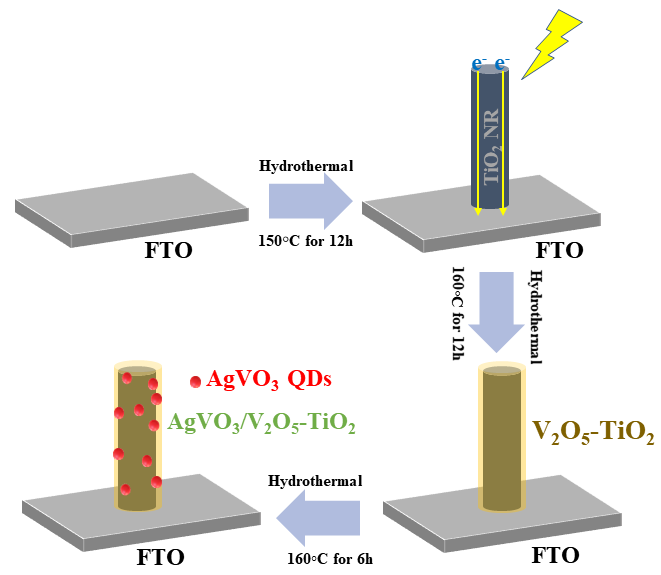
Herein, we used 1D TiO2 nanorods arrays, as the electron acceptor to promote charge delivery V2O5 and AgVO3, as the photo-absorbers, to form p-n junction and Z heterostructure photoelectrode. The preparation process of AgVO3/V2O5-TiO2 is shown in Scheme 1. The inner array and the outer shell of these heterostructured arrays are composed of TiO2 and V2O5, respectively. AgVO3 quantum dots were deposited on V2O5 surface by low temperature hydrothermal method. The contact between the three different energy levels of the semiconductors AgVO3, V2O5 and TiO2 involves charge redistribution, leading to the final formation of the synthesized semiconductor in a z-type heterojunction structure. Here, we present new heterostructure for amplifying the photocatalytic and photoelectrochemical (PEC) properties of AgVO3/V2O5-TiO2.
2.1. Materials
All chemicals used in the this work are of analytical reagent grade, commercially available and were used as received without further purification. Tetrabutyl titanate (C16H36O4Ti), hydrochloric acid (HCl-10mol per liter), silver nitrate (AgNO3), ammonium metavanadate (NH4VO3) and ethyl alcohol (C2H6O) were purchased from Aladdin official online store. All aqueous solutions were prepared using deionized water (DW). The AgVO3/V2O5-TiO2 was prepared using a two-step hydrothermal method.
2.2. Preparation of hydrothermal AgVO3/V2O5-TiO2 photocatalysts
The TiO2 nanorod arrays (TRA) were fabricated by a simple hydrothermal approach. In detail, 15mL of HCl, 15mL of DW and 0.5mL of C16H36O4Ti were mixed in a 50 mL beaker, stirring the mixture for 30 minutes before transferring to a Teflon lined autoclave (50mL). Pre-cleaned conductive glass (FTO) was used as a substratee (1.5\(\times\)3cm2), and the mixture was transferred into a 50mL Teflon-lined autoclave, and the treatment was carried out at 150◦C for 12h [4]. Finally, the obtained TRA was then collected and dried at 70◦C overnight.
The V2O5-TiO2 photocatalysts was also prepared by a similar strategy hydrothermal, as follows: 0.488g NH4VO3 was dissolved in a solution containing ethanol and DW (1:1) under a strong magnetic stirring for 60 min. Then, the pH of the solution was adjusted to 2.0 by adding HCl solution (1.0mol/L), with the solution color changing from milky white to orange [22].
The AgVO3/TiO2 materials were prepared by in hydrothermal method as follows: 0.5mmol NH4VO3 (about 0.12g) and 0.5mmol AgNO3 (about 0.17g) were dissolved in 30mL DL under magnetic stirring (stirred for 2h) to obtain solution. Then, the aqueous solution and TiO2 put into a 50mL Teflon-lined autoclave, and followed by treatment at 160◦C for 6h. The synthesis AgVO3/V2O5-TiO2 process is shown in Scheme 1.
2.3. Characterization
The samples were characterized using various analytical methods. X-ray polycrystalline diffractometer (XRD, 9kW/SmartLab 9KW, Japan) measurement were made with monochromatic CuKa radiation in the range from 25° to 75°. The morphological and structural information of samples was characterized by field emission scanning electron microscopy (SEM, Hitachi-S4800, Dallas, TX, USA), high-resolution transmission electron microscopy (TEM, HITACHI, Tokyo, Japan), Energy dispersive X-ray spectroscopy (EDX), UV–visible spectrophotometry (Neosys-2000, SCINCO), photoluminescence (PL) spectroscopy (Perkin Elmer) and X-ray Photoelectron Spectrometer (XPS ESCALAB 250Xi/ESCALAB 250Xi, America).
2.4. Photocatalytic test
The photocatalytic ability of the as-synthesized samples were estimated by the measurement of the photo-degradation of methylene blue (MB) aqueous solution (20mg/L) under 150W simulated solar irradiation. The experiment was performed as follows: the samples with an area size of 1×1cm2 were dispersed in a colorimetric reactor containing 5mL of MB solution. After in dark for 30min, approximately 3mL of the suspension was extracted at the given time interval and the typical absorption peak at 665nm was tracked with a UV-Vis spectrophotometer to evaluate the concentration of MB [4].
These rely on photo-excited charge carrier separation to achieve photocatalysis without any external photovoltaic or electrical equipment.
2.5. Photoelectrochemical (PCE) measurements
The photochemical measurements (CHI 660D, Chenhua, Shanghai) were performed at room temperature by an electrochemical workstation in a typical three electrode configuration. The reference electrode and counter electrode are a saturated Ag/AgCl electrode and a Pt wire. The working electrode is a sample with an exposed area of 1cm2 and the electrolyte is an aqueous solution of 0.2M Na2SO3 and 0.1M Na2S. The light source is a 150W xenon lamp used as a standard analogue illumination (AM 1.5G, 100mW/cm2). The electrode potentials were converted to values versus a reversible hydrogen electrode (RHE) by using the Nernst equation:
VRHE=EAg/AgCl+0.059pH + V0Ag/AgCl,
where EAg/AgCl is the experimental potential measured at the control Ag/AgCl reference electrode, and V0Ag/AgCl is the standard potential of Ag/AgCl (0.198 V). Linear sweep voltammograms (LSV) were recorded at a scan rate of 10mV s− 1 from negative to positive at pH = 13 in 0.2M Na2SO3 and 0.1M Na2S electrolyte. More kinetics assessment was employed by EIS measurement, the frequency range was from 0.1Hz to 10kHz. Mott–Schottky measurements were performed at frequencies of 1000Hz with an amplitude of 0.01V in 0.2M Na2SO3 and 0.1M Na2S aqueous solution at pH = 13.
3.1. Microstructure characterization and composition analysis
XRD analysis was performed to investigate the crystal structures of the samples. Figure 1 shows the XRD diffraction patterns of the samples, all diffractograms show similar peaks. The signals at 2θ = 36.0°, 41.2°, 54.3° and 62.7° characterize the of TiO2, and two additional peaks at 2θ = 30.5° and 32.1° appear with related V2O5 and AgVO3, respectively. The AgVO3/V2O5-TiO2 composite showed a compound of rutile TiO2 phase (JCPDS 21-1276), V2O5 phase (JCPDS No.41-1426) [14]and AgVO3 phase (JCPDS No.29-1154) [19], revealing that the mixture was the main composition of TiO2, V2O5, AgVO3 crystal structure. The absence of particularly strong signals from V2O5 indicates the V2O5 highly dispersed. All characteristic peaks of AgVO3, V2O5 and TiO2 are observed in the XRD pattern of AgVO3/V2O5-TiO2.
The photographs of TiO2 and AgVO3/V2O5-TiO2 were exhibited in Fig. 2. During hydrothermal process, TiO2 forms nanorod arrays at FTO, as shown in Fig. 2(a) and (b). For comparison, Fig. 2(c), d display SEM images of the AgVO3/V2O5-TiO2 in preparation.There is no essential change in morphology, but significantly increased surface roughness in comparison with bare TiO2 precursor, which can be seen AgVO3, V2O5 its completely covered on the TiO2 nanorods surface. The diameter of these nanorods is 20-30nm under high magnification SEM observation.
In order to further investigate the microstructure and chemical composition distribution, TEM images and EDS elemental maps were tested in Fig. 3. Figure 3e represents the TEM images of AgVO3/V2O5-TiO2 and the corresponding EDS elemental profiles of Ti, O, V, and Ag, which exhibit the growth of V2O5 around the TiO2 nanorods and the attachment of AgVO3 to the outermost layer of the nanorods in the form of quantum dots (AgVO3 QDs structure presents discrete distribution in V2O5-TiO2 nanorod), confirming the successful formation of AgVO3/V2O5-TiO2 heterostructures. Figure 3a shows the TEM image of AgVO3/V2O5-TiO2 nanorod, an ultrathin coating layer with a thickness of about 10nm can be observed on the surface of TiO2 nanorod and and its surface is roughly covered with a large number of small particles (can be identified as AgVO3 QD), indicating the successful clad on TiO2 rods to form a shell structure as V2O5-TiO2, and AgVO3 QD dispersed separately on the surface of V2O5-TiO2, in good match with the elemental mapping images (Fig. 3e). Three HRTEM images gave further direct evidence for the formation of AgVO3/V2O5-TiO2, Fig. (3b, c and d) show an enlarged view of a partial area the AgVO3/V2O5-TiO2 in Fig. 2a, which can roughly distinguish TiO2 nanorod, V2O5 thin film layers, and AgVO3 QDs. The High-resolution TEM (HRTEM) images show different lattice fringes, lattice spacings of ~ 0.25nm correspond to the (101) crystal plane of rutile TiO2, and the lattice spacing of ~ 0.37nm in the middle V2O5 layer corresponds to their (001) crystal plane, and the (501) lattice spacing of the outermost AgVO3 QDs is 0.306 nm. It can be concluded that AgVO3 QDs has been successfully attached to the surface of V2O5-TiO2 nanoarray. All these findings well indicate that the AgVO3/V2O5-TiO2 nanoarrays were successfully synthesized on FTO substrates.
To further clarify the successful deposition of AgVO3 and V2O5, X-ray photoelec-tron spectroscopy (XPS) was performed to characterize the surface chemical states of AgVO3/V2O5-TiO2. Figure 4a shows the survey XPS spectra results in line with the constituents. The distinct peaks of Ti, O, V, C, and Ag elements for AgVO3/V2O5-TiO2 and the peaks of Ti, C and O elements for TiO2 can be found. Altogether, these observations indicate that TiO2 nanorods are modified by V2O5 and AgVO3 sequentially. To further clarify the interfacial interaction between AgVO3/V2O5 and TiO2, high-resolution XPS spectra of C 1s, Ti 2p, O 1s, V 2p, and Ag 3d in TiO2 and AgVO3/V2O5-TiO2 hybrid were compared. For the C 1s spectrum of in TiO2 and AgVO3/V2O5-TiO2, the peak at 284.8eV is assigned C = C, indicating that adding AgVO3 and V2O5 does not introduce and change the C structure. The XPS data for TiO2 and AgVO3/V2O5-TiO2 showed characteristic Ti 2p3/2 (458.48eV) and Ti2p1/2 (464.57eV) peaks for Ti4+, the binding energy at AgVO3/V2O5-TiO2 is reduced by about 0.22eV compared to the same peak of TiO2 (Fig. 4(c)). This small shift may be due to the presence of additional V5+ and Ti3+ in AgVO3/V2O5-TiO2. The O 1s XPS spectra of both TiO2 and AgVO3/V2O5-TiO2 in Fig. 4(d) show two typical peaks at ~ 530.2 and ~ 532.0 eV, which are attributed to lattice oxygen (Ti-O species) and a surface-adsorbed hydroxyl group (OH−), respectively. As compared to TiO2, it is clear that the O1s XPS spectrum of AgVO3/V2O5-TiO2 adds strong peaks (532.7eV) corresponding to the lattice oxygen (V-O or Ag-O). To gain insight into the oxidation state of V, we performed XPS characterization of all samples, as shown in Fig. 4e. The V 2p peak at 516.8(V4+) ~ 517.6(V5+) eV and 524.4eV are ascribed to the V 2p3/2 and V 2p1/2 levels, and the bare TiO2 does not show any peaks of V, respectively [23–25]. As can be seen from Fig. 4(f), bare TiO2 and V2O5-TiO2 samples have no Ag peak position and Ag 3d peaks appear in AgVO3-TiO2 and AgVO3/V2O5-TiO2 samples, which is completely consistent with the experiment. From Fig. 4(f), it can be seen that the binding energies of 368.2eV and 374.2eV correspond to two distinct peaks of 3d5/2 and 3d3/2 for Ag 3d, respectively[21, 26]. Combining with the above XRD, SEM, TEM, and XPS maps, the above results prove.
3.2. UV-vis diffuse reflectance and bandgag mechanism
Efficient solar light absorption is vital factor for photoelectrocatalytic activity. Figure 5a displays bare TiO2 absorbed light with an absorption onset at about 400nm, complying well with the theoretical bandgap (be calculated to 3.07eV) of rutile TiO2[4, 27]. Figure 5(a) compares the UV–vis diffuse absorption spectra of the bare TiO2, AgVO3-TiO2 V2O5-TiO2 and AgVO3/V2O5-TiO2. Figure 5(a) and (b) show the composite photocatalysts can adjust the absorption cut-off wavelength. The visible light absorption intensity (VA) was estimated with VA (I×nm) of 7, 61, 144, 189 corresponds to the bare TiO2, AgVO3-TiO2, V2O5-TiO2 and AgVO3/V2O5-TiO2[4], respectively, as shown in Fig. 5(a). The prepared AgVO3/V2O5-TiO2 heterostructure has high light absorption properties in visible light (400nm ~ 700nm). Figure 5(b) shows the Tauc plot of UV-vis spectra, which reveals that the Eg of the bare TiO2, AgVO3-TiO2, V2O5-TiO2 and AgVO3/V2O5-TiO2 are about 3.07, 2.92, 2.12 and 1.41eV, respectively.
The reason for the high visible light absorption performance of the 1D AgVO3/V2O5-TiO2 heterostructures is described as follows. The conduction band, valence band and Fermi level of TiO2, AgVO3 and V2O5 are shown in Fig. 5(c), it is shows the wide band gap of TiO2 (~ 3.07eV) with coupling two band gaps small semiconductor materials V2O5 (~ 2.40eV) and AgVO3 (~ 2.55eV) [4, 28, 29], but these three semiconductor materials are not premium heterojunctions if they cannot be synthesized into one material [6]. Fermi-level alignment refers to the fact that when semiconductor materials of different energy levels come into contact generally involves a redistribution of charge, which causes the shift in band edge positions [29, 30]. This indicates that when the heterostructure is formed, the Fermi energy of the AgVO3/V2O5-TiO2 semiconductor has to be the same. This leads to the CB and VB of both AgVO3 and V2O5 to lie above TiO2 as shown in Fig. 5(c). Specifically, when the sunlight shines on the surface of the AgVO3/V2O5-TiO2, since the CB of AgVO3 and V2O5 are higher than bare TiO2, a double type-II band alignment exists [6], and the photo-generated carriers are transferred from the CB of AgVO3 and V2O5 to TiO2. This double electron transfer paths can greatly enhance the separation of photogenerated electrons and holes. Similarly, the holes in the VB of TiO2 transfer to the VB of AgVO3 and V2O5 and facilitates the degradation of pollutants. Therefore, although the current configuration is not ideal for double type-II band gap heterojunctions, Efficient charge separation can still be achieved by Fermi-level alignment. This process can efficiently accelerate the separation of photo-induced e−/h+ pairs and prolong the e−/h+ pairs lifetime. The the double type-II band gap information is confirmed by the photocatalytic and the photoelectrochemical test results. This in turn can be used to elucidate the photocatalytic mechanism.
3.3 Photocatalytic property
Using the photocatalytic test evaluation described in Sect. 2.3, the photocatalytic degradation efficiency against Methylene blue under 150W simulated solar (AM 1.5G, 100mW/cm2) irradiation. The absorption spectra decolorization curves of the MB solution after different photo-degradation time treatments with bare TiO2 and AgVO3/V2O5-TiO2 are displayed in Fig. 6(a). After 120 min of simulated sunlight, the cannot be excited by visible light, so the MB degradation efficiency can only reach 49.9%, while the MB degradation rate of AgVO3/V2O5-TiO2 reached 95.8%. In Fig. 6(b) and (c), the photocatalytic performance of AgVO3/V2O5-TiO2 was outstanding, the photocatalytic degradation rates were 49.9%, 85.4%, 80.2%, 81.6%, and 95.8% for TiO2, AgVO3-TiO2, V2O5-TiO2, respectively.
According to kinetic principles, the recombination of photogenerated e−/h+ pairs can occur within 10− 9s to 10− 12s. When electron acceptors (pollutants) can be pre-sorbed on the catalyst surface, this is more favorable for photocatalytic performance. and the kinetics of the studied catalysts are shown in Fig. 6(d). The reaction rate constant of AgVO3/V2O5-TiO2 is 0.025min− 1, which is approximately five times that of TiO2 (k = 0.005min− 1). The photocatalytic mechanism is shown in Fig. 5(c).The reaction rate constant order of the samples is as follows: TiO2 < AgVO3-TiO2 < V2O5-TiO2 < AgVO3/V2O5-TiO2. As mentioned above, the AgVO3/ V2O5-TiO2 sample demonstrated superior photocatalytic MB reduction activity compared to their sampls, with the main source of this superior activity is related to the reasonable heterojunction structure and the resultant photo-induced charge transfer properties.
3.4 Photoelectrochemical performance and water splitting
The photoelectrochemical (PEC) performances of the TiO2, V2O5-TiO2, AgVO3-TiO2 and AgVO3/V2O5-TiO2 nanorod arrays grown on FTO substrates were characterized. All the samples had been tested for 3h to investigate the stability. The separation, capture and migration of the photo-generated carriers on the surface of catalysts were investigated by Photocurrent, Electrochemical impedance spectroscopy (EIS) and Photoluminescence spectra (PL). Figure 7(a) shows a comparison of the current density responses of samples. For the bare TiO2 (6μA), there was less photocurrent response due to its the intrinsic limitation of the quantum yield. The loads of AgVO3-TiO2 and V2O5-TiO2 could further enhance the photocurrent response of TiO2, while AgVO3/V2O5-TiO2 (115μA) presented higher response compared with AgVO3-TiO2 (15μA) and V2O5-TiO2 (88μA). Importantly, AgVO3/V2O5-TiO2 exhibits the highest photocurrent, indicating a more efficient separation and longer lifetime of the charge carriers, which is in good accordance with the order of their photocatalytic measurements. The charge transfer characteristics of the photoelectrodes were further obtained by EIS analysis of different samples, and the results are presented in the form of Nyquist plots as shown in Fig. 7(b). The EIS response demonstrated the AgVO3/V2O5-TiO2 possessed a smaller impedance radius compared with TiO2, AgVO3-TiO2 and V2O5-TiO2, and creates a more suitable environment for holes transfer across the interface to the electrolyte [31]. The electron transport recombination properties was further confirmed by the results of PL. In Fig. 7(c), compared to TiO2, the PL emission intensity of AgVO3-TiO2 and V2O5-TiO2 and AgVO3/V2O5-TiO2 were dramatically decreased, and the AgVO3/V2O5-TiO2 shows the lowest intensity. The Nyquist plots and quenched PL intensity imply the effective charge transfer by the double type-II scheme heterojunction. Based on the PC, EIS, PL results, it provides strong support for the effective separation of e−/h+ pairs of AgVO3/V2O5-TiO2. It could be concluded that the two-step hydrothermal treatment has been shown to optimize the interface TiO2 nanorod array, the reorganization rate of e−/h+ pairs was slowed down and the photocatalytic performance of PEC was significantly improved.
To evaluate the PEC performance of the TiO2, AgVO3-TiO2, V2O5-TiO2 and AgVO3/V2O5-TiO2, we performed linear sweep voltammogram (LSV) and Mott–Schottky (M-S) in an alkaline electrolyte. Figure 7(d) shows the photocurrent–potential (J–V) curves for the sample photoanodes under one standard simulated sunlight irradiation (100mW/cm2). In Fig. 7(d), LSV curves of TiO2, AgVO3-TiO2 and V2O5-TiO2 and AgVO3/V2O5-TiO2 showed OER activity with initialpotentials of 1.93, 1.71, 1.64 and 1.47V to reach current density of 10mA/cm2, respectively. Using the equation η = ERHE −1.23, the overpotential (η) of is calculated, as shown in Fig. 7(e). Clearly, the AgVO3/V2O5-TiO2 can serve as efficient OER electrocatalyst for practical application at high current density and exhibits the lowest onset overpotential (246.2mV), which is less than 446.9mV for bare TiO2 (693.1mV). This enhancement can be attributed to the double type-II band gap of heterostructure. In addition, Fig. 7(f) shows indicates that the LSV curve of AgVO3/V2O5-TiO2 is lower (145.6mV) in the light source onset potential than in the dark, indicating a photocatalytic effect. Mott–Schottky (M-S) analysis has been proved to be an effective tool in studying the electronic properties, by means of which can be determined flat band potentials (VFD) and donor density (ND) of samples. Here, the flat band potential of electrodes is determined by the Mott–Schottky equation [31–33]:

with ε0 (8.86×10⁻¹²F/m) and ε (90F/m)-the passive oxide and vacuum permittivity, respectively; e-the electron charge (1.6×10⁻¹⁹C); ND-the donor density inside the passive oxide; VFB-the flatband potential; k-the Boltzmann constant; T-the temperature (the value of kT/e0 is 0.026V at 25°C). By extrapolation to  the flat band potential VFB can be determined. From Fig. 7(g), the slopes of Mott-Schottky plots show positive values for all samples, suggesting that the AgVO3 QDs and V2O5 effect will not change the n-type conductivity of TiO2. The VFB of TiO2, V2O5-TiO2, AgVO3-TiO2 and AgVO3/V2O5-TiO2 derived from the extrapolation linear M-S plot to potential bias axis are 0.46V, 0.82, 1.06 and 1.27 versus RHE, respectively. As can be seen in Fig. 7(g), the slope of the Mott–Schottky plot for bare TiO2 is much steeper than for the others amples. More specifically, According to Equ. (2), ND values of the TiO2, V2O5-TiO2, AgVO3-TiO2 and AgVO3/V2O5-TiO2 photoelectrodes were calculated to be 4.3ⅹ1017, 9.4×10¹⁷, 6.4×10¹⁷ and 2.15×1018cm−3, respectively. After AgVO3 and V2O5 modification, the ND could be remarkably increased almost 5 times as compared with pristine TiO2. This result reveals a drastic increase of free charge carriers in the AgVO3 and V2O5 modified TiO2 electrodes. To further confirm our deduction, the black and red lines show the fitting of the linear range of the Mott-Schottky plots for both in the dark and light AgVO3/V2O5-TiO2 based photoanodes. The fits shown in Fig. 7(h) yield VFB=1.27V and ND=2.15×1018cm−3 for in the light AgVO3/V2O5-TiO2 samples and VFB=1.18V and ND= 2.09×1018cm−3 for in the dark AgVO3/V2O5-TiO2 samples, which shows that the increased quantity ∆ND=6×1016cm−3 derives from the effect of light and is consistent with the LSVcurve.
In summary, a high-flux double type-II scheme for interfacial electron transport channels was designed and synthesized using Fermi energy level realignment. In contrast to the bare TiO2, V2O5-TiO2 and AgVO3-TiO2, the AgVO3/V2O5-TiO2 heterojunction exhibited the best performance. The results indicated that a high-quality interfacial heterojunction contact is formed between V2O5 and AgVO3 QDs using TiO2 as a mediator, which can maximize the separation and transfer of photo-generated carriers. AgVO3/V2O5-TiO2 heterojunctions catalyst greatly enhanced the visible light absorption and improved the charge separation of TiO2. It should be noticed that the enhanced light absorption may also play roles in photocurrent. The AgVO3/V2O5-TiO2 was tested in Mott-Schottky and LSV performance with and without a light source, demonstrating that photoelectrochemical outperforms electrocatalysis. Highly ordered semiconductors show great prospects for applications in environmental photocatalysis and clean energy production, mainly due to their unique structures to realize efficient charge transport pathways and long-lived charges. This paper provides an innovative and stable AgVO3/V2O5-TiO2 double type-II band gap and p-n heterojunction for giant-internal electric field induced efficient photocatalysis and PEC overall water splitting.
Conflicts of interest
The authors declare no competing financial interest.
Acknowledgements
This work was financially supported by National Natural Science Foundation of China
(No. 51772003, 51472003, 51701001, 61804039).
- Cao S, Yan X, Kang Z, Liang Q, Liao X, Zhang Y (2016) Band alignment engineering for improved performance and stability of ZnFe2O4 modified CdS/ZnO nanostructured photoanode for PEC water splitting. Nano Energy 24:25–31
- Wei Y, Kong J, Yang L, Ke L, Tan HR, Liu H, Huang Y, Sun XW, Lu X, Du H (2013) Polydopamine-assisted decoration of ZnO nanorods with Ag nanoparticles: an improved photoelectrochemical anode. J Mater Chem A 1(16):5045–5052
- Nie Q, Yang L, Cao C, Zeng Y, Wang G, Wang C, Lin S (2017) Interface optimization of ZnO nanorod/CdS quantum dots heterostructure by a facile two-step low-temperature thermal treatment for improved photoelectrochemical water splitting. Chem Eng J 325:151–159
- Yu H, Zhang M, Wang Y, Yang H, Liu Y, Yang L, He G, Sun Z: A Facile and Controllable Vapor-Phase Hydrothermal Approach to Anionic S2--doped TiO2 Nanorod Arrays with Enhanced Photoelectrochemical and Photocatalytic Activity. Nanomaterials (Basel) 2020, 10(9)
- Wang Y, Zhang M, Li J, Yang H, Gao J, He G, Sun Z (2019) Construction of Ag@AgCl decorated TiO2 nanorod array film with optimized photoelectrochemical and photocatalytic performance. Appl Surf Sci 476:84–93
- Marschall R (2014) Semiconductor Composites: Strategies for Enhancing Charge Carrier Separation to Improve Photocatalytic Activity. Adv Func Mater 24(17):2421–2440
- Huang G, Mao J, Fan R, Yin Z, Wu X, Jie J, Kang Z, Shen M: Integrated MoSe2 with n + p-Si photocathodes for solar water splitting with high efficiency and stability. Applied Physics Letters 2018, 112(1)
- King LA, Zhao W, Chhowalla M, Riley DJ, Eda G: Photoelectrochemical properties of chemically exfoliated MoS2. Journal of Materials Chemistry A 2013, 1(31)
- Liu B, Sun Y, Wu Y, Liu K, Ye H, Li F, Zhang L, Jiang Y, Wang R (2020) Enhanced photoresponse of TiO2/MoS2 heterostructure phototransistors by the coupling of interface charge transfer and photogating. Nano Research 14(4):982–991
- Zhou W, Shen B, Wang F, Zhang X, Zhao Z, Si M, Guo S (2020) Enhanced photocatalytic degradation of xylene by blackening TiO2 nanoparticles with high dispersion of CuO. J Hazard Mater 391:121642
- Shao M, Ning F, Wei M, Evans DG, Duan X (2014) Hierarchical Nanowire Arrays Based on ZnO Core – Layered Double Hydroxide Shell for Largely Enhanced Photoelectrochemical Water Splitting. Adv Func Mater 24(5):580–586
- Chen X, Wang L, Li H, Cheng F, Chen J (2019) Porous V2O5 nanofibers as cathode materials for rechargeable aqueous zinc-ion batteries. Journal of Energy Chemistry 38:20–25
- Hong Y, Jiang Y, Li C, Fan W, Yan X, Yan M, Shi W (2016) In-situ synthesis of direct solid-state Z-scheme V2O5/g-C3N4 heterojunctions with enhanced visible light efficiency in photocatalytic degradation of pollutants. Appl Catal B 180:663–673
- Mondal M, Dutta H, Pradhan SK: Enhanced photocatalysis performance of mechano-synthesized V2O5–TiO2 nanocomposite for wastewater treatment: Correlation of structure with photocatalytic performance. Materials Chemistry and Physics 2020, 248
- Li S, Huang W, Xu H, Chen T, Ke Y, Qu Z, Yan N: Alkali-induced deactivation mechanism of V2O5-WO3/TiO2 catalyst during selective catalytic reduction of NO by NH3 in aluminum hydrate calcining flue gas. Applied Catalysis B: Environmental 2020, 270
- Zhang S, Zheng H, Sun Y, Li F, Li T, Liu X, Zhou Y, Chen W, Ju H (2020) Oxygen vacancies enhanced photoelectrochemical aptasensing of 2, 3', 5, 5'-tetrachlorobiphenyl amplified with Ag3VO4 nanoparticle-TiO2 nanotube array heterostructure. Biosens Bioelectron 167:112477
- Zhao W, Guo Y, Wang S, He H, Sun C, Yang S (2015) A novel ternary plasmonic photocatalyst: ultrathin g-C3N4 nanosheet hybrided by Ag/AgVO3 nanoribbons with enhanced visible-light photocatalytic performance. Appl Catal B 165:335–343
- Liu D, Chen D, Li N, Xu Q, Li H, He J, Lu J (2019) Integration of 3D macroscopic graphene aerogel with 0D-2D AgVO3-g-C3N4 heterojunction for highly efficient photocatalytic oxidation of nitric oxide. Appl Catal B 243:576–584
- Zhang X, Zhang J, Yu J, Zhang Y, Cui Z, Sun Y, Hou B (2018) Fabrication of InVO4/AgVO3 heterojunctions with enhanced photocatalytic antifouling efficiency under visible-light. Appl Catal B 220:57–66
- Lin X, Guo X, Shi W, Guo F, Zhai H, Yan Y, Wang Q (2015) Ag3PO4 quantum dots sensitized AgVO3 nanowires: A novel Ag3PO4/AgVO3 nanojunction with enhanced visible-light photocatalytic activity. Catal Commun 66:67–72
- Bavani T, Madhavan J, Prasad S, AlSalhi MS, AlJaafreh MJ (2021) A straightforward synthesis of visible light driven BiFeO3/AgVO3 nanocomposites with improved photocatalytic activity. Environ Pollut 269:116067
- Liu Y, Guo W, Guo H, Ren X, Xu Q: Cu (II)-doped V2O5 mediated persulfate activation for heterogeneous catalytic degradation of benzotriazole in aqueous solution. Separation and Purification Technology 2020, 230
- Silversmit G, Depla D, Poelman H, Marin GB, De Gryse R (2004) Determination of the V2p XPS binding energies for different vanadium oxidation states (V5 + to V0+). Journal of Electron Spectroscopy Related Phenomena 135(2–3):167–175
- Zhang C, Wang J, Li Y, Li X, Koughia C, Wen S-J, Wong R, Yang Q, Kasap S (2019) VO2 microrods synthesized from V2O5 thin films. Appl Surf Sci 476:259–264
- Yan C, Liu L: Sn-doped V2O5 nanoparticles as catalyst for fast removal of ammonia in air via PEC and PEC-MFC. Chemical Engineering Journal 2020, 392
- Liu B, Han X, Mu L, Zhang J, Shi H (2019) TiO2 nanospheres/AgVO3 quantum dots composite with enhanced visible light photocatalytic antibacterial activity. Mater Lett 253:148–151
- Liu X, Wu X, Xu T, Weng D, Si Z, Ran R (2016) Effects of silica additive on the NH3 -SCR activity and thermal stability of a V2O5/WO3 -TiO2 catalyst. Chin J Catal 37(8):1340–1346
- Wang Y, Su YR, Qiao L, Liu LX, Su Q, Zhu CQ, Liu XQ (2011) Synthesis of one-dimensional TiO2/V2O5 branched heterostructures and their visible light photocatalytic activity towards Rhodamine B. Nanotechnology 22(22):225702
- Gurulakshmi M, Selvaraj M, Selvamani A, Vijayan P, Sasi Rekha NR, Shanthi K (2012) Enhanced visible-light photocatalytic activity of V2O5/S-TiO2 nanocomposites. Appl Catal A 449:31–46
- Martha S, Das DP, Biswal N, Parida KM: Facile synthesis of visible light responsive V2O5/N,S–TiO2 composite photocatalyst: enhanced hydrogen production and phenol degradation. Journal of Materials Chemistry 2012, 22(21)
- Hong SJ, Lee S, Jang JS, Lee JS: Heterojunction BiVO4/WO3 electrodes for enhanced photoactivity of water oxidation. Energy & Environmental Science 2011, 4(5)
- Hu W, Zheng M, Xu B, Wei Y, Zhu W, Li Q, Pang H (2021) Design of hollow carbon-based materials derived from metal–organic frameworks for electrocatalysis and electrochemical energy storage. Journal of Materials Chemistry A 9(7):3880–3917
- Li D, Jia J, Zheng T, Cheng X, Yu X (2016) Construction and characterization of visible light active Pd nano-crystallite decorated and C-N-S-co-doped TiO2 nanosheet array photoelectrode for enhanced photocatalytic degradation of acetylsalicylic acid. Appl Catal B 188:259–271
- Scheme1.png
Schematic diagram of the fabrication of AgVO3/V2O5-TiO2 nanorod arrays photoanodes.