Establishment of left-lung PF animal model
Eight-week-old Sprague-Dawley (SD) rats weighed around 250 g were provided by the Laboratory Animal Center (LAC) of National Yang-Ming University. Rats are prone to death after BLM administration if rats were too young or underweight. It will take more time to feed and care if rats are too old or overweight. Moreover, the limitation of MRI scan cabin could not afford rats with heavy body weight. Therefore, rats weighing 250g were selected as the experimental animals. Following confirmation of anesthesia depth, male SD rats received 5 Unit/5 mg BLM/250 g body weight (Nippon Kayaku Co., Ltd.) in 200 μL phosphate buffered saline by intratracheal injection and were then rotated to the left side by 60° for 90 min to establish a severe, reproducible, left-lung PF animal model [9].
Administration of Pirfenidone with oral gavage
The anti-fibrotic agent (brand name: PIRESPA® Tablet 200mg, Shionogi Pharma Co. Ltd., MHW Medicine Import No.: 026734) contains 200 mg Pirfenidone (5-methyl-1-phenyl-2-1H-pyridine-2-one). Dose conversion from a 50-kg adult human to a 400-g adult rat was performed, and each rat was to receive 1.6 mg Pirfenidone. A tablet of Pirfenidone was dissolved in 50 ml of reagent grade water, and each rat was then administered with 1.6 mg/0.4 ml Pirfenidone.
On Day 21 after BLM injection, 1.6 mg/0.4 ml Pirfenidone was administered twice daily for two weeks. From the third week and onwards, 3.2 mg/0.8 ml was given twice daily for another two weeks until Day 49 after BLM injection.
Administration of Nintedanib with oral gavage
The OfevⓇ capsule (Catalent Germany Eberbach GmbH, MHW Medicine Import No.:026568) contains 150 mg Nintedanib. Dose conversion from a 50-kg adult human to a 400-g adult rat was conducted, and each rat was to receive 1.2 mg Nintedanib. A capsule of Nintedanib was dissolved in 50 ml of reagent grade water, and each rat was then administered with 1.2 mg/0.4 ml Nintedanib.
On Day 21 after BLM injection, 1.2 mg/0.4 ml Nintedanib was administered twice daily for four weeks until Day 49 after BLM injection.
Isolation, culture, and transplantation of HUMSCs
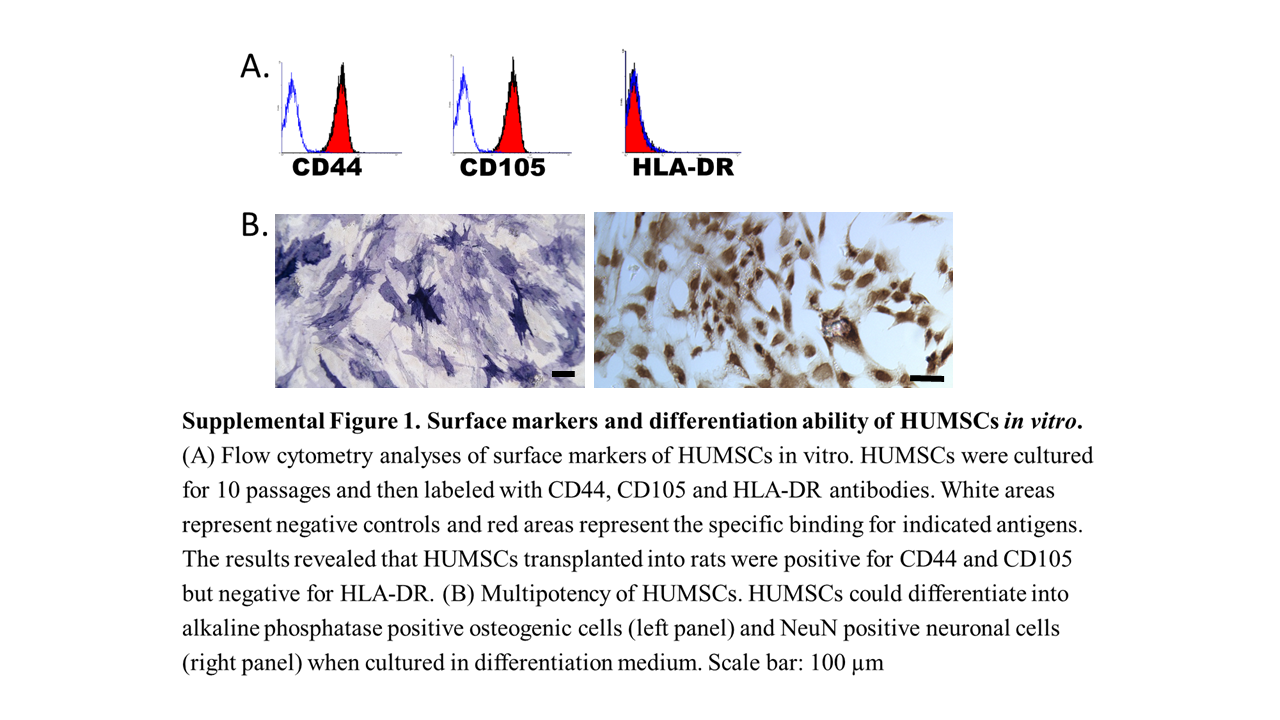
The use of human umbilical cords in this study was approved by the Research Ethics Committee of Taipei Veterans General Hospital (2018-01-020AC). Human umbilical cords were collected and kept at 4℃ Hank’s Balanced Salt Solution (HBSS). In a laminar hood, umbilical cords were disinfected by soaking in 75% ethanol and were then placed in the HBSS solution. Subsequently, the mesenchymal tissue (Wharton’s jelly) was cut into small pieces and centrifuged at 4,000 rpm for 5 minutes. After removal of the supernatant fraction, the umbilical mesenchymal tissue was treated with collagenase and trypsin, followed by the addition of fetal bovine serum (FBS; Gibco 10437-028) to stop the reaction; at that point, the umbilical mesenchymal cells were fully processed into HUMSCs. Finally, HUMSCs were then used directly for cultures in 10% FBS Dulbecco’s modified Eagle’s medium (DMEM) or stored in liquid nitrogen for later use. HUMSCs were collected between the tenth and fifteenth passages for transplantation into rats in this study. HUMSCs were found to express high levels of matrix receptors (CD44 and CD105) but did not express HLA-DR. Meanwhile, osteogenic and neuronal differentiation of HUMSCs at the tenth generation all succeeded (Supplemental Figure 1A and 1B).
HUMSCs were treated with 0.05% Trypsin-EDTA (Gibco 15400-054) for 2.5 minutes. Cells were then collected, washed twice with 10% FBS DMEM, centrifuged at 1,500 rpm for 5 minutes, and the supernatant was removed. The pelleted cells were then suspended in a concentration of 2.5×10⁷ in 200 μl of sterile saline solution. On Day 21 after intratracheal BLM, rats were treated with 2.5×10⁷ HUMSCs by intratracheal transplantation.
Animal groups
The animals were randomized to the following five treatment groups:
- Normal group: Rats received saline injection. On Day 21 after injection, only 200 μl of saline was intratracheally administered (Figure 1A).
- BLM group: Rats received 5 mg BLM injection. On Day 21 after BLM injection, no treatment but saline was intratracheally administered (Figure 1A).
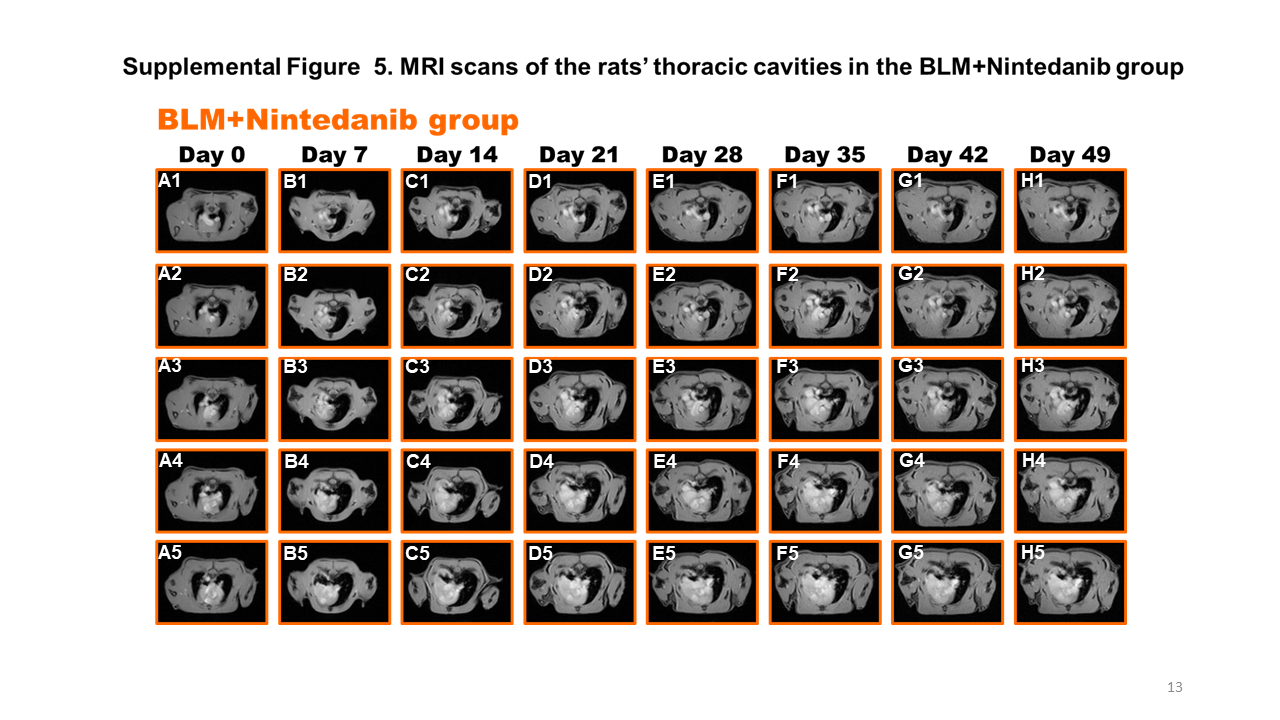
- BLM+Nintedanib group: Rats received BLM injection. On Day 21 after BLM injection, Nintedanib was orally administered twice per day for four weeks. The rats were sacrificed on Day 49 (Figure 1A).
- BLM+Pirfenidone group: Rats received BLM injection. On Day 21 after BLM injection, Pirfenidone was orally administered twice per day for four weeks. The rats were sacrificed on Day 49 (Figure 1A).
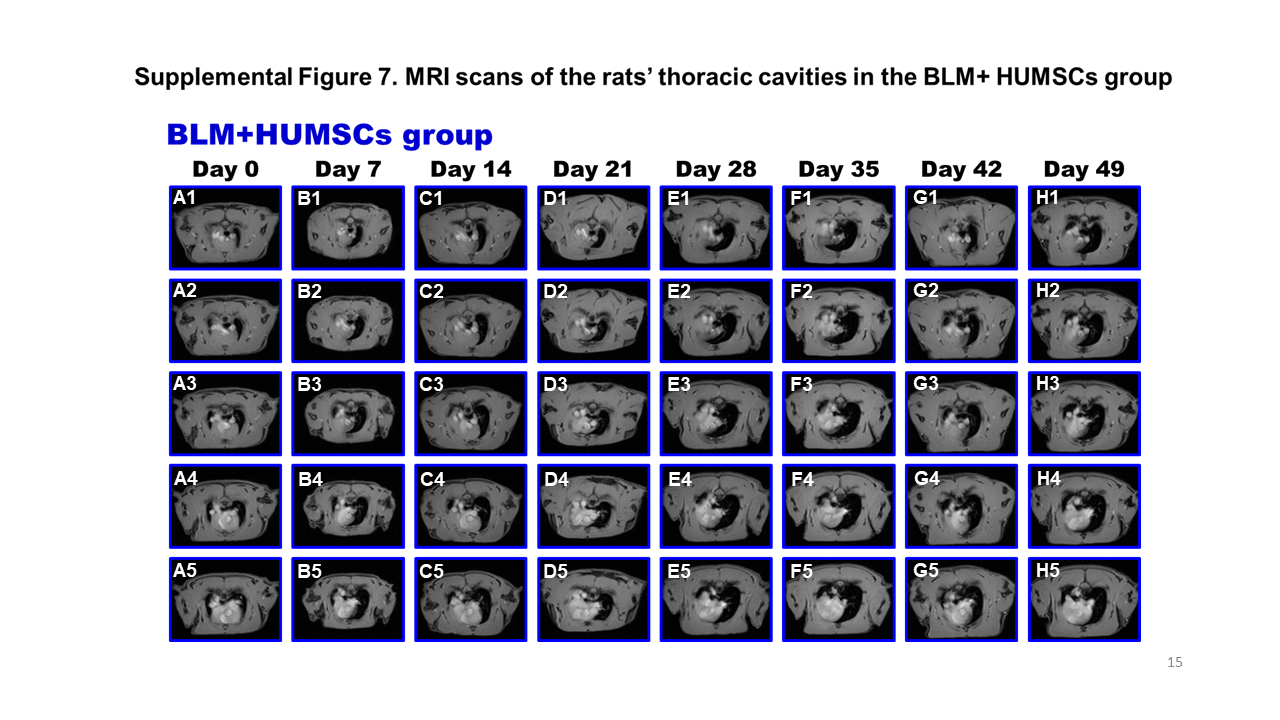
- BLM+HUMSCs group: Rats received BLM injection. Intratracheal transplantation of 2.5×10⁷ HUMSCs was performed on Day 21 after BLM injection. The rats were sacrificed on Day 49 (Figure 1A).
Animals were randomized, blinded for treatments and assays. Weight, blood oxygen saturation, respiratory rate, and MRI were assessed weekly. During the measurement, rats were put on heating pad (36±2℃) and the room temperature is maintained at a constant temperature (22±2℃). Rats were sacrificed on Day 49 after BLM administration for observing the morphology of the lung and for bronchoalveolar lavage cell counts (Figure 1B).
Pulmonary function testing
Arterial blood oxygen saturation
After shaving off the fur on the rats’ front legs, they were anesthetized with isoflurane (Baxter 228-194). The shaved legs were then clipped with a pulse oximeter (Pulseoximeter, Rossmax SB100) for measuring arterial blood oxygen saturation.
Pulmonary respiratory rates
The rats were placed in a closed cylinder-shape detection chamber (emka Technologies, Whole body plethysmograph), and the changes in breath flow during 15 minutes were recorded by the software BIOPAC BSL 4.0 MP45. The resting respiratory rate of rats was then quantified.
Magnetic resonance imaging (MRI)
Rat lung images were obtained using the MRI (BRUKER BIOSPEC 70/30) at the Instrumentation Center, National Taiwan University. The thoracic cavity of rats was scanned and photographed horizontally from rostral to caudal every 1.5 mm until the whole cavity was completely scanned. Because the first image obtained in each rat varied in position, the total number of images in the horizontal plane was between 20 to 25.
In order to reduce the bias due to the different number of total images when quantifying the volume of the left lung, the carina of trachea was used as a landmark for image positioning. In addition to the slice containing the carina, two slices before and after the carina were collected. These five images were summed for quantification of the black alveolar space to represent the left-lung alveolar volume of each rat (Supplemental Figures 3- 7).
Sacrifice and perfusion fixation of experimental animals
Animals were anesthetized and then perfused with 0.01 M PBS. Both lungs were removed and immersed in a fixation solution with 4% paraformaldehyde (Sigma 10060) and 7.5% picric acid (Sigma 925-40). The lungs were postfixed in the fixative solution and then subjected to paraffin embedding. Lung tissue blocks were sectioned into 5 μm slices. A serial sagittal section was performed from the outermost lateral side. Ten slices were numbered consecutively and placed on slides for various immunohistochemistry (IHC) examinations (Supplemental Figure 2).
Hematoxylin and eosin (H&E) staining
Lung tissue sections were immersed in hematoxylin solution (Muto Pure Chemicals Co., Ltd.; No. 3008-1) and eosin solution (Muto Pure Chemicals Co., Ltd.; No. 3200-2). The left lung volume, percentage of cell infiltration area and air space (Supplemental Figure 2, Column A), stained using H&E, was quantified by the average red signals in every left lung section (infiltration and air space). The total left-lobe volume was the summation of all H&E signals in the collected images. The quantification method for alveoli circumference was based on the inner space peripheral lengths of each empty alveoli in unit area (N=8 or 9, 30 images each), analyzed with Image-Pro software.
Sirius red stain
Lung tissue sections were stained in 0.1% Sirius red (Sigma 2610-10-8) in picric acid and then photographed using optical microscopy. The percentage of collagen deposition (Supplemental Figure 2, Column B), stained by Sirius red, was quantified by the average number of red signals in every left lung section. Image signals (N=8 or 9, 30 images each) were analyzed with Image-Pro software.
Immunohistostaining
Lung slices (with recovered antigens) were reacted with primary antibodies (mouse anti-α-smooth muscle actin antibody for myofibroblast [SMA, Sigma A2547]; mouse anti- ED1 antibody for total macrophage [Millipore MAB1435]; rabbit anti- CD86 antibody for M1 macrophage [Proteintech, 13395-1-AP]; mouse anti- CD163 antibody for M2 macrophage [BioRad MCA342R]; rabbit anti-NADPH oxidase antibody [Abcam, ab133303]; mouse anti-catalase antibody [Abnova, H00000847-A01]) at 4°C for 12- 18 h and then reacted with secondary antibodies. Samples were then reacted with avidin-biotinylated-horseradish peroxidase complex (ABC Kit, Vector Laboratories) and finally developed with DAB. Finally, the numbers of M1 macrophage or M2 macrophage were counted from ten optic fields in three left lung sections of each group.
Quantitative real-time PCR
Extraction of total RNA from lung were performed with RNAiso Plus reagent and further reverse-transcribed using a PrimeScript RT reagent kit (BIONOVAS HiScript I First Strand cDNA Synthesis Kit, AM0675-0050). SYBR-Green mix (Luna Universal qPCR Master Mix, M3003) was used to carry out quantitative PCR according to the manufacturer’s instructions. Target gene expression was normalized to β-actin levels in respective samples as an internal control and calculated using the 2−ΔΔCq method, and the relative mRNA expression was further calculated through normalizing to the Normal group.
Rat GAPDH
F: 5’-CTCTACCCACGGCAAGTTCAAC-3’
R: 5’-GGTGAAGACGCCAGTAGACTCCA-3 Product length: 160 bps
Rat collagen type1 alpha 1 chain (Col1a1)
F: 5’-TCCTGCCGATGTCGCTATC-3’
R: 5’-CAAGTTCCGGTGTGACTCGTG-3’ Product length: 234 bps
Western blotting
Lung tissue samples from each group were loaded separately into individual wells. The polyvinylidene fluoride (PVDF) paper was reacted with primary antibodies (mouse anti-α-SMA antibody, rabbit anti- MMP-9 antibody [Abcam ab76003], mouse anti-toll-like receptor-4 antibody [TLR-4, Abcam ab30667], and mouse anti-β-actin antibody [Sigma A5411] for internal control) at 4 °C for 12- 18 h. Subsequently, the membrane was reacted with the corresponding secondary antibodies at room temperature for 1 h. The protein bands were quantified using Image J software and normalized using individual internal controls for comparison.
Bronchoalveolar lavage
Rats were anesthetized and their airways were lavaged two times with 2 ml saline/each, and 1 ml bronchoalveolar lavage fluid (BALF) was recovered. Total cell counts were determined using a hemocytometer.
Statistical analysis
All data are presented as the mean ± standard error of the mean (SEM). One-way analysis of variance (ANOVA) was used to compare the means, and Fisher’s least significant difference test was applied for multiple comparisons. A value of p < 0.05 was considered statistically significant.