Parasite sampling
ITS-2 rDNA nemabiome analyses were performed on 149 samples (n = 36 and 113 samples in Trois Fontaines and Chizé, respectively; Table 1, Fig. 1). A few roe deer were recaptured during the second year of sampling (n = 2 and 17 in Trois Fontaines and Chizé, respectively). The limited number of recaptures prevents us from considering individuals as a random factor in the analyses, and because the nemabiome of recaptured deer did not present particular patterns (see Appendix A4), information regarding recapture status was not considered in the following analyses. The year of sampling had no influence on the nemabiome (Adonis test and Kruskal-Wallis rank sum test; see Appendix A6), and this factor was therefore not considered in the following analyses.
Table 1
Summary of samples collected in the sites of Chizé and Trois Fontaines in 2018 and 2019.
| | | 2018 | 2019 | Total (N = 149) |
| | | Chizé (N = 57) | Trois-Fontaines (N = 22) | Chizé (N = 56) | Trois-Fontaines (N = 14) | |
| Sex | F:Female; M:Male | 32F 25M | 10F 12M | 26F 30M | 5F 9M | 73F 76M |
| Age class | Y:Young; A:Adult | 11Y 46A | 13Y 9A | 17Y 39A | 5Y 9A | 46Y 103A |
| Eggs per gram | median [min-max] | 15 [0-270] | 7.5 [0–60] | 7.5 [0–90] | 11.25 [7.5–180] | 7.5 [0-270] |
| Number of L3 | median [min-max] | 156 [10.75–1250] | 69.3 [18-8650] | 69.5 [10–819] | 51 [10–519] | 80 [10-8650] |
| Reads | Total | 630926 | 320112 | 555517 | 156868 | 1663423 |
| median [min-max] | 11315 [1638–22744] | 14308 [1595–33527] | 9855.5 [2749–19837] | 10288 [2436–24330] | 10631 [1595–33527] |
| ASV | Total | 53 | 47 | 55 | 33 | 100 |
| median [min-max] | 9 [3–16] | 12 [6–17] | 9 [4–17] | 9 [2–19] | 9 [2–19] |
| Taxa | Total | 8 | 10 | 10 | 11 | 14 |
| median [min-max] | 4 [2–5] | 5 [3–7] | 4 [2–7] | 4 [1–7] | 4 [1–7] |
The median number eggs per gram of feces was low and heterogeneous (7.5 eggs/g [0; 114]95%IQR), as well as the number of L3 used for DNA extraction (80 [12; 993]95%IQR; Table 1, Fig. 2). Both had no significant effects on alpha and beta diversity (Pearson correlation test and Adonis test; see appendix A6).
Taxonomic and Community diversity
Considering the whole dataset, we detetected 100 ASVs resolved across14 taxa of gastrointestinal nematodes (Table 1 and AppendixA2). ASVs were identified either at genus (38%), or species (62%) levels (Appendix A2). A total of 10 genera, including 11 species were identified and their phylogeny was consistent with previous knowledge on nematode taxonomy (Appendix A5). Sampling captured most of the taxa as the taxa- accumulation curves reach rapidly a plateau (Appendix A3). Procrustes analyses performed on ASV with taxa have tight correlations (p = 0.001). Thus, we only show results at ASV taxonomic level, but results from taxa are available in Appendix A7-A9.
According to the best models (Table 2; appendix A8), the taxonomic richness was higher in Trois Fontaines than in Chizé (estimate ± standard error, β = 0.20 ± 0.06, p = 0.002).The Shannon index, which is more sensitive to rare species, included significant interactions between age and site, indicating a higher diversity in young than in adult roe deer in Trois Fontaines (β = 0.26 ± 0.13, p = 0.038) (Fig. 3; Table 2). At the local scale of Chizé, no differences between the 3 sectors were detected for all alpha diversity indexes (Fig. 2).
Table 2
Best generalized linear models selected for ASVs and each diversity index (Richness, Simpson, Shannon).
| Diversity index | Best generalized models selected | Variables | Parameter estimate ± SE | z-val. or t-val. | p |
| Richness | \(\alpha \tildesite\) | intercept | 2.13 ± 0.03 | 65.89 | *** |
| siteTF | 0.20 ± 0.06 | 3.16 | ** |
| Simpson | \(\alpha \tildeage+site+age\times site\) | intercept | 0.98 ± 0.06 | 17.37 | *** |
| siteTF | 0.07 ± 0.14 | 0.52 | - |
| ageY | 0.06 ± 0.12 | 0.54 | - |
| ageY:siteTF | 0.37 ± 0.24 | 1.57 | - |
| Shannon | \(\alpha \tildeage+site+age\times site\) | intercept | 1.59 ± 0.03 | 46.23 | *** |
| siteTF | 0.11 ± 0.08 | 1.36 | - |
| ageY | 0.01 ± 0.07 | 0.14 | - |
| ageY:siteTF | 0.26 ± 0.13 | 2.09 | * |
| Gaussian families were used for Simpson and Shannon regression and Poisson family for Richness. The effect of site (Chizé as reference), age (adult as reference), sex (females as reference) and the interaction between them are reported when including in the selected models. Parameter estimates with SD are reported with the corresponding z-value (Poisson family) or t-value (Gaussian family) and p-value. Statistical significance is represented by * for p < 0.05, **for p < 0.01 and *** for p < 0.001. |
According to the most parsimonious model selected for the Bray-Curtis dissimilarity the differences of nemabiome between samples were mostly explained by the site (F1,145=37.41, R²=0.19, p = 0.001) and age (F1,145=14.35, R²=0.07, p = 0.001) variables, and the differences between adult and young roe deer were slightly more pronounced in Trois Fontaines (F1,145=4.04, R²=0.02, p = 0.004) (Table 3). Similarly, we observed distinct groups in the NMDS, with partially separated clouds of points for Chizé and for Trois Fontaines, and a marked separation for young and adult roe deer in Trois Fontaines (Fig. 4). Locally in Chizé, the selected model for Bray-Curtis dissimilarity depended only on age (F1,111=6.62, R²=0.06, p = 0.003).
Table 3
PerMANOVA model selected for ASVs and Bray-Curtis dissimilarities matrix.
| Diversity index | Best generalized models selected | Variables | R² | F-value | p |
| Bray-Curtis | \(\beta \tildesite+age+age\times site\) | residuals | 0.72 | - | - |
| site | 0.19 | 37.41 | *** |
| age | 0.07 | 14.35 | *** |
| age:site | 0.02 | 4.04 | ** |
| The effect of site, age, sex and the interaction between them are reported when including in the selected model. Statistical significance is represented by * for p < 0.05, **for p < 0.01 and *** for p < 0.001. |
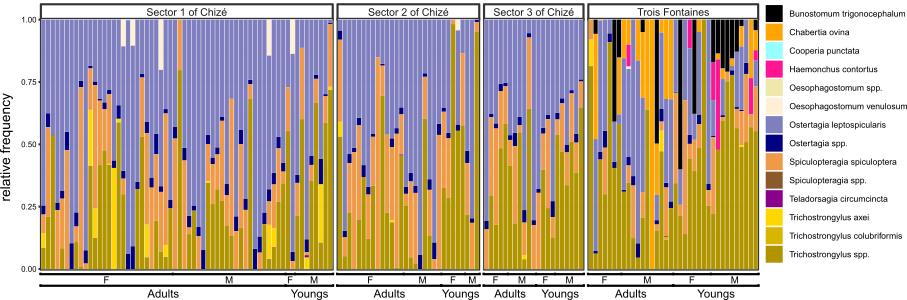
The most common species/genus in the entire dataset were Ostertagia leptospicularis, Trichostrongylus spp. and Spiculopteragia spiculoptera present in 139, 121, 120 samples of roe deer (93%, 81% and 81%, respectively) with a mean relative abundance among those samples of 44%, 29% and 17%, respectively (Fig. 2). In Chizé, Ostertagia leptospicularis, Trichostrongylus spp. and Spiculopteragia spiculoptera were present in 98%, 71%, 79% of samples in the sector 1; 93%, 80%, 90% in the sector 2; and 100%, 86%, 100% in the sector 3. The mean relative abundance of species among those samples were 53%, 22%, 17% (sector 1), 46%, 28%, 23% (sector 2) and 45%, 33%, 19% (sector 3). In Trois Fontaines, Ostertagia leptospicularis, Trichostrongylus spp. and Spiculopteragia spiculoptera were present in 81%, 97% and 64% of samples with a mean relative abundance among those samples of 24%, 42% and 9%. Chabertia ovina, Haemonchus contortus and Bunostomum trigonocephalum were only detected in Trois Fontaines (Fig. 5 and Fig. 2), explaining the significantly higher richness in Trois Fontaines (Table 2) and the significative difference of nemabiome between the two site (Table 3). We also observed variations in the prevalence and relative abundance of 5 ASV of Trichostrongylus spp. between the two sites, between the age of the host, but with an higher differences of abduncance between age in Trois Fontaines in comparison with Chizé (Fig. 5), as indicated by the significant interaction between site and age on Shannon, and Bray-Curtis diversity indices.