NanoFTIR and sSNOM operating principle
Near-field nanoscopy was performed by focusing IR radiation on a metallic AFM tip, generating a confined near field at the tip’s apex [17] (Figure 1a). When the sample is brought close to the tip, light is scattered from the tip and carries information on the optical properties of the surface beneath the tip, where the scattered amplitude relates to the reflectivity and the phase to the absorption of the surface [18]. Essentially, the AFM tip acts as point source of light. As a consequence, optical resolution is defined by the diameter of the tip apex but not by the wavelength. The weak intensity of the scattered photons and the low performance of IR detectors as compared to highly sensitive UV/Vis detectors, is effectively compensated by lock-in detection where the oscillating AFM cantilever provides the carrier frequency for detection. In sSNOM imaging mode, the surface is raster scanned at a single frequency of the QCL in pseudoheterodyne detection scheme [19], thus simultaneously obtaining AFM topography, near-field amplitude and phase images (Figure 1b). For nanoFTIR spectroscopy, a difference frequency generation-based fs laser [20] is used to illuminate the tip with broadband IR radiation. The scattered light is fed into a Michelson interferometer and a near-field IR absorption spectrum is recorded at each tip position [21] (Figure 1c).
Subcellular nanoFTIR spectroscopy
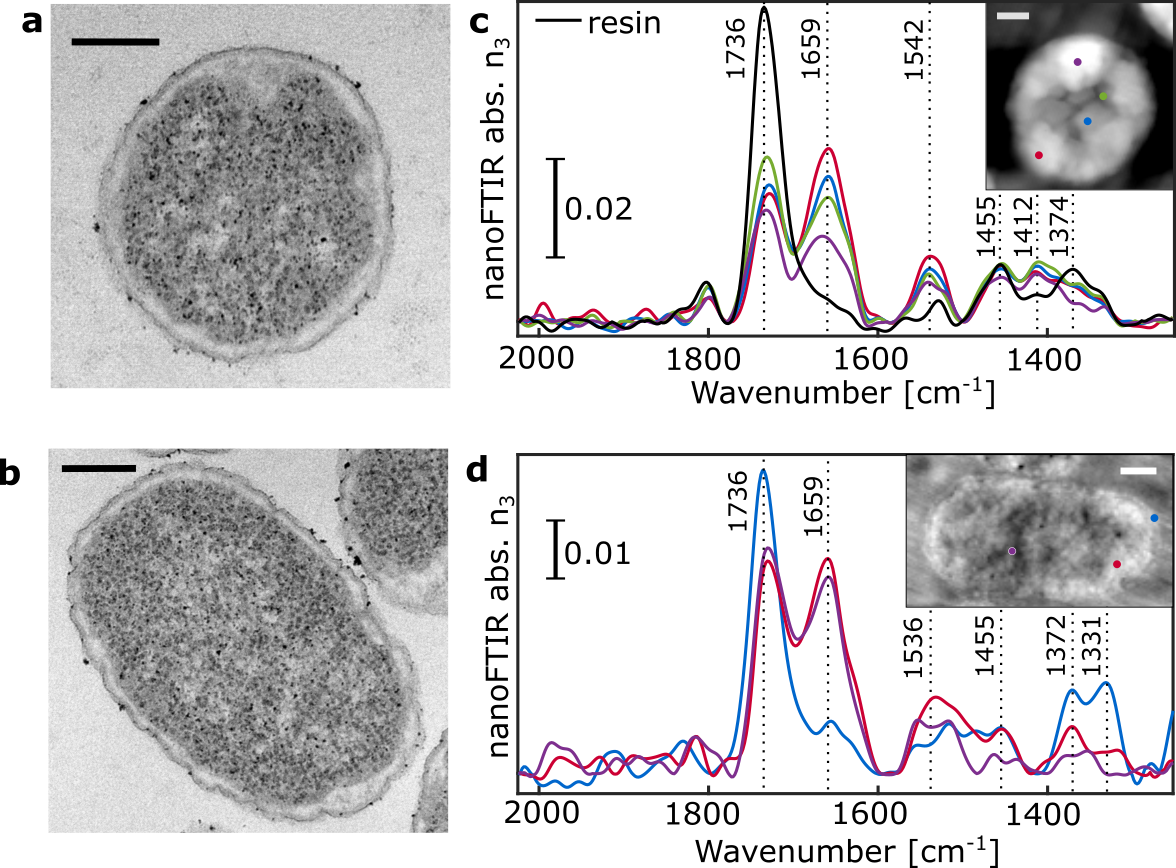
The morphology of Chlamydomonas reinhardtii (Figure 2) and Escherichia coli (Figure S1) thin sections were investigated using TEM as a reference to compare against AFM images. Several distinct subcellular features and organelles were identifiable [22] with both TEM (Figure 2a) and AFM (Figure 2b), including the nucleus and nucleolus, the photosystem-containing thylakoid membranes, the pyrenoid with its distinctive starch inclusions, and the exterior plasma membrane.
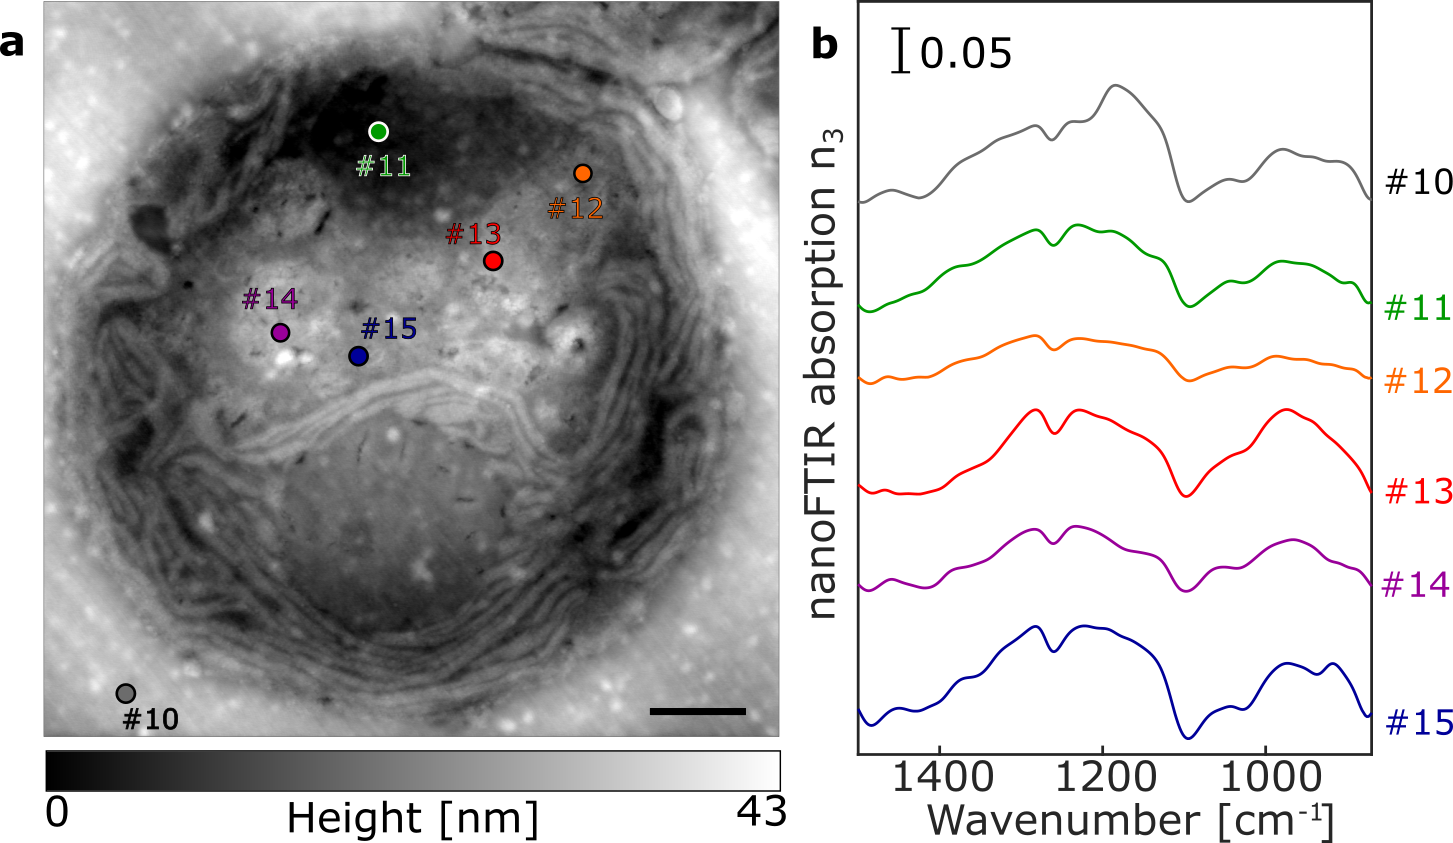
Using nanoFTIR, locally resolved spectra were recorded on several intracellular locations as well as on the cell-free region containing only the embedding resin (Figure 2c). Each spectrum was measured on a single spot with size given by the AFM tip radius at lateral resolution of 20 nm (Figure S3d), marked on the AFM micrograph and referenced against a spectrum recorded on bare Au surface. The spectral region between 1800 and 1500 cm-1 demonstrates multiple characteristic absorption features that vary with different measuring positions (Figure 2c). Spectrum #1 (black) was measured on a cell-free region and the dominant peak at 1738 cm-1 corresponds to the C=O stretching vibration of succinic anhydride present in the epon-like embedding resin. Spectrum #2 (blue) was recorded on the central part of the pyrenoid. It shows distinct absorption peaks at 1655 cm-1, assigned to the C=O stretch of amide, and 1540 cm-1 stemming from combined N-H bending and C-N stretching modes, known as amide I and amide II, respectively [11] . These peaks indicate high protein content and, as previously reported, the pyrenoid is largely composed of polypeptides such as RuBisCO [23], [24], the key enzyme involved in CO2 fixation. Spectrum #3 (purple) recorded in the nuclear region is dominated by similar absorption of bands at 1655 cm-1 and 1540 cm-1 suggesting protein content in this region. Yet, the IR bands of DNA (characterized by ring modes of purine and pyrimidine [25], [26]) are likely to contribute to this absorption spectrum as well. Spectrum #4 (pink) corresponds to the local IR absorption of the thylakoid with prominent amide I and amide II absorption bands due to the high protein content of the large photosynthetic complexes Photosystem I (PSI) and Photosystem II (PSII) contained within. Additional contributions in the 1560 cm-1 and 1520 cm-1 regions may be due to the C=O and C=N vibrations of chlorin rings, typical of chlorophyll [27] in PSI and PSII. The low intensity peak at around 1740 cm-1 could be related to either chlorophyll or the resin. The cytoplasmic inner region was probed at several locations, each producing similar spectra as observed in the resin (Figure 2c, spectra #5, #6 and #7), thus indicating resin penetration inside of the cell. In contrast, spectrum #8 (green) has almost no resin absorption but shows distinct amide I and amide II peaks. This suggests that although measured on a visually similar cellular location to spectra #5 – 7, this spectrum was recorded from a protein-rich organelle. Finally, spectrum #9 (cyan) was taken from the very edge of the cell in order to observe the plasma membrane. However, as the dominant absorption peak at 1738 cm-1 may originate from C=O stretching vibrations of either the membrane lipids or the resin, the assignment remains ambiguous. To gain insight into the near-field absorption at lower wavenumbers, additional measurements were performed covering spectral region down to ~1000 cm-1 (Figure S2) to probe molecular vibrations of phosphate and ribose groups of DNA originating from the nucleus.
Single-wavelength sSNOM imaging
Based on our nanoFTIR analysis, we recorded sSNOM images at specific marker wavenumbers. The AFM topography of the selected cell (Figure 3a) is visually similar to the previously examined sections (Figure 2a and b), with several distinct morphological features present. Phase-contrast imaging at 1738 cm-1 (Figure 3b) shows strong absorption in the area surrounding the cell and in several, well-defined intracellular vacuoles, reinforcing the previous identification of the 1738 cm-1 absorption band being primarily due to the embedding resin.
In contrast, Figures 3c and d show a near complete visual inversion with a uniform lack of absorption across all areas that the resin is present. Similar to nanoFTIR observations (Figure 2c), visualization at the wavenumbers corresponding to amide I (1655 cm-1, Figure 3c) and amide II (1540 cm-1, Figure 3d) both show strong absorption across several cellular features, including the pyrenoid, the chloroplast and the nuclear region. Interestingly, absorption at 1540 cm-1 is relatively homogenous across the nucleus (Figure 3d), whereas absorption at 1655 cm-1 provides a higher-contrast image, allowing for the nucleolus to be clearly distinguished from the surrounding nuclear area (Figure 3c). This increase in intensity is likely the result of the high density of proteins, nucleobases and other genetic material in this region.
Imaging at 1238 cm-1 showed low overall absorption (Figure 3e) with the exception of several small but clearly resolved regions within the cytoplasm. However, imaging at this wavenumber allowed for clear visualization of the thylakoid stacks within the chloroplast. Also, the nucleolus is distinguishable from the nucleus with a slight increase in absorption likely due to the asymmetric P-O stretching vibration of phosphate. Cellular imaging at 1155 cm-1 (Figure 3f) resembles the absorption pattern seen at 1738 cm-1 (Figure 3b), showing strong absorption on the resin area outside the cell and within cellular vacuoles. Visualization at 1155 cm-1 provides additional contrast, particularly of the thylakoid membranes and the protrusions in and around the pyrenoid. This adds further evidence to the assignment of this absorption feature as C-O-C stretching vibrations, present in a mixture of complex carbohydrates (such as starch) and the embedding resin.
In addition to AFM morphology and sSNOM phase contrast, information on the local reflectivity was gathered via sSNOM scattering amplitude. Several intracellular structures are depicted (Figure 4), demonstrating both the resolving power of sSNOM imaging and the potential of these imaging modes to each reveal different cellular features. While the cell wall was indistinct when imaged with AFM (Figure 4a), it is readily apparent when visualized with either amide I phase contrast (Figure 4b) or scattering amplitude (Figure 4c), appearing as a distinct ~80 nm thick band with moderate 1656 cm-1 absorption and low reflectance, respectively. The stacking of the thylakoids is most apparent in the scattering amplitude image (Figure 4c). In contrast, phase imaging provides exceptional detail in the nuclear region allowing for clear differentiation of the nucleolus as well as a spherical nuclear body. A line profile across the nuclear body demonstrated both its particularly high absorption and its diameter of ~200 nm (Figure 4b insert). As such this nuclear body is likely a Cajal body [28].
The characteristic architecture of a eukaryotic flagellum can be seen in the axoneme. The scattering amplitude (Figure 4f) resolves the nine pairs of outer doublet microtubules and their radial spokes, while the central microtubules and the inner sheath can be seen as a slightly lower region of AFM topography (Figure 4d) in the center of the flagellum. The phase image in contrast, exhibits strong and homogeneous peptide absorption across the flagellum, and moderate absorption of the surrounding cell wall (Figure 4e). These observed flagella structures are highly comparable to previously reported Chlamydomonas flagellum characteristics [29].
The combination of AFM topography and sSNOM spectroscopy was also a valuable tool in the analysis of prokaryotic cells. E. coli cross sections (sectioned along either axis) were visually similar when comparing TEM and AFM imaging (Figure S1). Strong amide I and amide II bands are present throughout the cell with strong intracellular resin penetration (Figure S1c and d). Although an E. coli cell is approximately ten times smaller than a C. reinhardtii cell and does not contain internal membrane-bound vesicles, as evident from the AFM image (Figure S3 a), the resolving power of sSNOM imaging at 1658 cm-1 clearly distinguishes several subcellular features. Overall, the cytoplasmic region shows strong absorption at this wavenumber (Figure S3b), but with an anisotropic distribution. A particularly dense region (suggesting high protein content) can be observed in the upper right of the cell. Conversely, there are several central patches of moderate to low amide I absorption. The sSNOM amplitude image is also anisotropic with similar regions varying in intensity (Figure S2c). The outer membrane has moderate amide I absorption and was used to determine a lateral resolution of ~20 nm of our sSNOM image recordings (Figures S3d).
sSNOM tomography
Utilizing the top-view optics of the sSNOM imaging system, it was possible to identify several consecutive cross sections each from the same individual cell. Combining the sSNOM phase images of these ten consecutive, 100 nm thick cellular cross sections (Figure 5a) resulted in a 1 µm thick 3D tomographic reconstruction (Figure 5b), representing approximately 10% of the entire cell. This tomograph provided a volumetric representation of the local intracellular protein distribution allowing for the 3D visualization of IR signatures of the membrane-bound organelles within a cell. The protein concentration within the pyrenoid is particularly high and as a result, the contrast in this region demonstrates the arrangement of the starch “fingers” within the pyrenoid. Similarly, the nuclear region also shows strong absorption, however, this dispersal in 3D space is more sporadic than in the pyrenoid. Conversely, the white and blue regions of lower absorption volumetrically represent the size, shape and distribution of the various cellular vacuoles across the cytoplasmic region of the cell. Thus, we infer that sSNOM tomography provides a direct chemical volumetric map at nm resolution where the contrast results from IR absorption.