3.1 Particulate matter - Physical
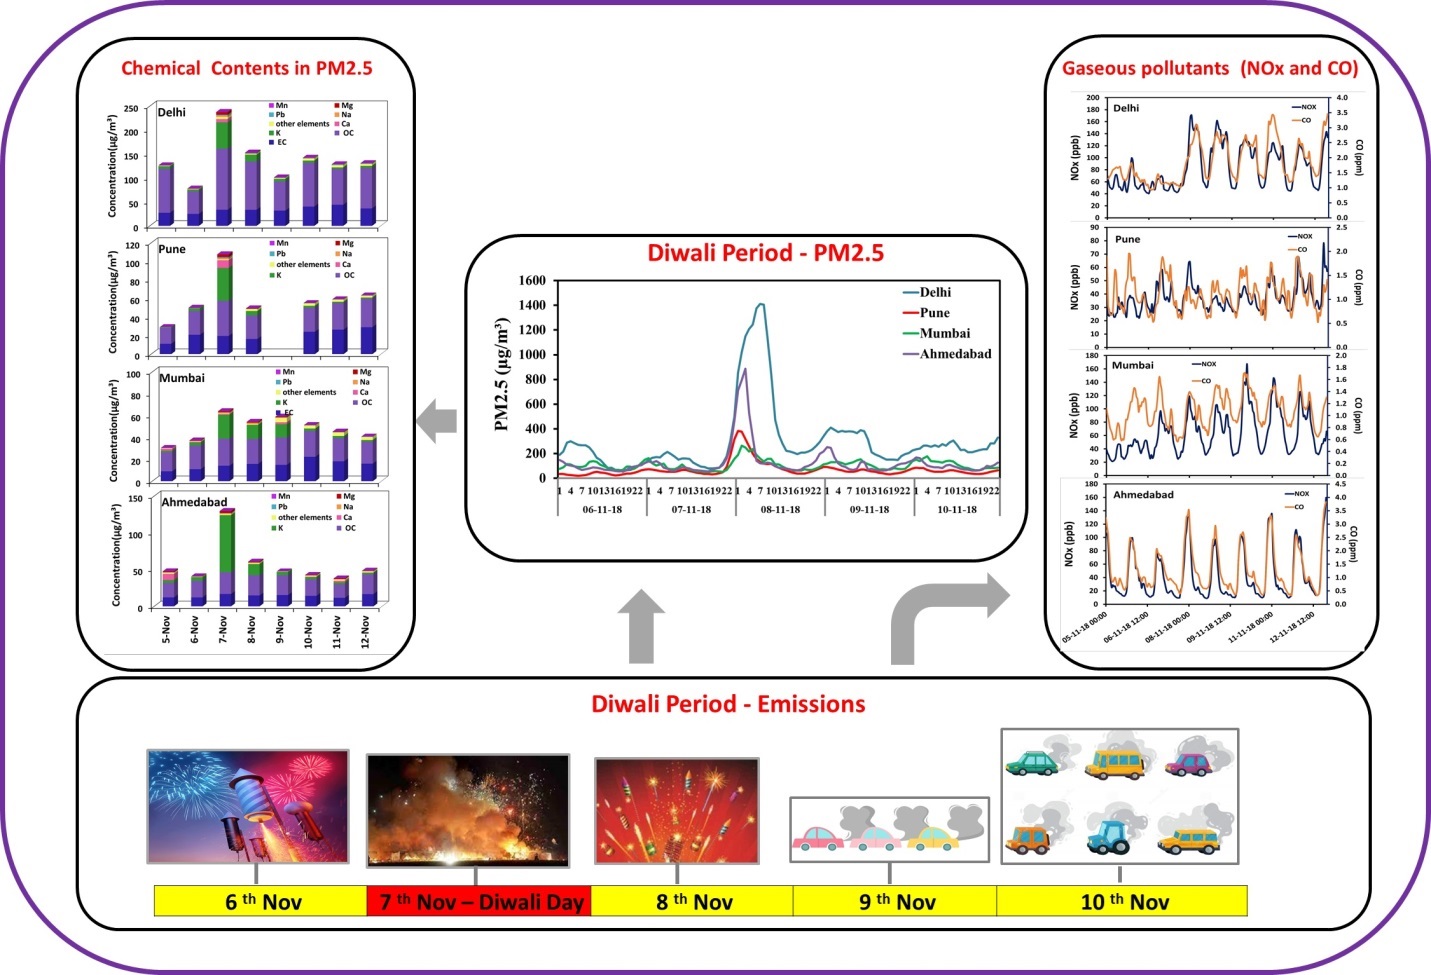
The specific increase on Diwali day is the highest over Delhi and the lowest in Mumbai while Ahmedabad and Pune are in the second and third place after Delhi (Fig. 2). The time and magnitude of peak indicate the trend of activities at each location (Table 1). The difference in daily maxima between pre-Diwali day (PD) and Diwali day (DD) in Delhi for PM10 is 1624 µgm− 3 and for PM2.5, it is 1356 µgm− 3. In Mumbai the daily maxima difference for PM10 and PM2.5 are 114 µgm− 3 and 100 µgm− 3 respectively.
Time of peak for PM2.5 changed from PD to DD in Delhi, from 5 am to 6 am; for Mumbai, 12 to 1 am; the peaks for Ahmedabad at 2 am and for Pune at 12 am remained the same; PM10 peak in Mumbai and Delhi occurred an hour later than PM2.5 which may be due to fireworks continuing late or fireworks types that emit bigger sizes or due to growth of particle size as well. The percentage increase at Delhi was 353% for PM2.5 and 213% for PM10. In the absence of other weather systems, the entire additional particulates emitted may be related to Diwali episode. In this study PM2.5 is elaborated more as its sub-index always decided AQI and also as this portion of PM is particularly detrimental to health. Pune and Ahmedabad experienced about 1.7 times amplification in PM2.5 which was less than half times of Delhi. Diwali effect in Mumbai is just 1/7th of that in Pune. The inset figures in Fig. 2 indicate the daily averages (10am to 10am) of PM10 and PM2.5 for the study period at the four locations. It is observed that the concentration shows a significant peak on the DD at all locations except Mumbai. The concentration is highest at Delhi, followed by Ahmedabad, Pune and the least at Mumbai.
An anomaly area-averaged map is prepared as explained in Sect. 2.2.4 using ARC-GIS software to have a total picture of PM2.5 surge of each city caused by DD activities and to note probable hotspots under the assumption that all other sources remain unchanged from PD to DD. As illustrated in Fig. 1, central Delhi looks the most polluted. In the case of inter-city comparison, Delhi's south-south-west area exhibited the lowest increase but this is comparable with the most polluted areas of Mumbai in magnitude. Ahmedabad-Gandhinagar stations stands second in particulate density with cleaner Gandhinagar and most polluted south-south-east area. Pune comes third with its south to east quadrant most polluted as it constitutes interstate transport hub and fast developing residential and industrial zone. The only coastal station, Mumbai is least polluted in terms of enhanced PM2.5 during DD. A cohort study was conducted by CPCB in collaboration with medical professionals(CPCB 2019) over the residential areas which coincides with the intensely polluted areas depicted in our anomaly figure (Fig. 1). CPCB had found in their study that cough has increased from 6.7–28.9% ( Daga et al., 2019) and post-Diwali hospital admissions surged by 50% due to cardiac, stroke, respiratory and burns.
Figure 3 depicts the variations of PM2.5 of individual AQMS stations in each SAFAR networked cities. A distinct peak on Diwali day is observed in all three cities except in Mumbai where distributed or multiple peaks are observed. In Delhi the peaks range from about 200 µgm− 3 at Ayanagar (IMDA), which is more of rural area, to 1100 µgm− 3 at Delhi University (DU) which is a major residential location.
Only the station NISE-G shows an increase on the next day of Diwali, as it is a remote location the increase is apparently related to the transport of pollutants from other areas. At Ahmedabad which is second highest in the averaged PM2.5 concentration on DD, Rakhial station tops with 353 µgm− 3 and Gift city the least, 89 µgm− 3. Unlike other cities, in Ahmedabad most of the stations show peak values in close range. Pune comes third with station Pashan having PM2.5 at 67µgm− 3 and Hadapsar at 257µgm− 3 as Diwali day peaks which are minimum and maximum respectively in the range. 50% of the stations in the lower end are overlapping and other 50% with higher values are with significant spread. Mumbai is anomalous with different pattern for Diwali episode; some stations show a peak on 6 November coinciding with southern Indian Deepavali, while another 4 stations show significant peak on 7th itself. However, a secondary smaller peak on 9th is more common among all stations. This seems to be more correlated with people going out of station after Diwali or returning altogether after Diwali and thus the emissions related to the transport activity contribute to the peak in concentrations. Customarily some groups of business people celebrate with firework after Diwali not on the "Laxmi Pooja" day as they expect some business on that auspicious occasion, thus Diwali related firework emissions are not really single day event as further emissions are added post the main day as well. The lower increment in the concentration of PM2.5 at Mumbai as compared to other cities is can be mainly attributed to the action of the cleansing land-sea breeze Moreover, many Mumbaites prefer to leave the city on holidays to celebrate festivals elsewhere, thereby not adding up to the anthropogenic load during the festival time.
Previous Diwali related studies over Delhi denotes a lot of variability in PM concentrations, from 400 to more than 2500 µg m− 3(Tiwari et al., 2012, Yerramsetti et al., 2013, Mandal et al., 2012). Tiwari et al., 2014, attributes the inter-annual variability of about 100% merely in terms of mixing height and fractional change in wind speed. Parkhi et al. (2016) attributes the sharp differences in particulates during Diwali period of consecutive years to the difference in mixing layer heights prevailed in the consecutive years of 2010 and 2011 while in 2011 'Diwali' effect seems to be absent. The current study, average of PM10 over ten SAFAR stations in NCR matches with PM10 values of 2010 detailed in (Beig et al. 2013) in Delhi. Mixing layer height (MLH) measurement at Delhi indicates that the rise in PM during 4th and 5th is apparently due to very shallow MLH. Dispersion effects on PM2.5 are detailed later.
3.2 Particulate Matter - Chemical Analysis
As detailed in Sect. 2.2.2 low volume samplers (LVS) are used for collecting PM2.5 particulates in pre-baked and weighed quartz filters for gravimetric determination as the difference between pre-weight and post-weight. Flow rate is fixed at 1 m3 hr− 1 while the concentration in µg m− 3 is obtained. In all four cities, LVS was placed at one of the SAFAR stations that represent the residential area for comparison by gravimetric analysis. Figure 4a shows the association between filter and AQMS (online) based PM2.5 quantification for the station where filter sampling is done. Technically, the LVS sampler considers the aerodynamic diameter for deciphering PM2.5. It is susceptible to errors due to increased humidity for the continuous measurements (optical detection) and to avoid that sucked air volume is heated at the inlet stage to control humidity. Though there could be a mismatch both the observations compared well except in Mumbai where increased humidity post-Diwali might have played a role. PM2.5 observations reveal that DD value of the station where filter sampling is done exceeded the monthly averaged value of the city by about 150% which implies that choice of station is proper for the study of Diwali impact. On specific comparison among cities, gravimetric and continuous observations are in tandem in Mumbai on DD, at Delhi gravimetric value is slightly less whereas in Pune and Ahmedabad it exceeds the continuous data.
Vecchi et al., (2008) monitored hourly EC, OC during fireworks at Milan, Italy and found that during peak hours both EC and OC rise noticeably. The filter samples of the present campaign are processed to derive organic and elemental carbon content. Our observations show that OC is elevated on DD for all stations though such a pattern is absent for EC. Liu et al., (2004) reports a clear change in OC-EC ratio in connection with spring festival fireworks in China but in this study OC-EC ratio that is in the 1–3 range with no systematic variation (Fig. 4b). This may be indicating a non-generalized nature of firecrackers and their use, emitting particulates differently (Betha and Balasubramanian, 2013).
Particulates emitted due to firework are rich in elemental fraction since many a times heavy metals are used as colorants. The metal content from the filter samples are derived as detailed in Sect. 2.2.4. We analyzed Ca, K, Mg, Fe, Zn through flame technique and Cu, Cr, Cd, Ni, Mn, Pb by graphite technique; the number of metals is restricted by the present availability of standards present. Figure 5 represents the time series of the total concentration of metals together with individual concentration of each metal in stack format for the Diwali campaign period.
The envelope line of the stack illustrates the temporal variation of total metal contribution in PM2.5. On DD total metals contribution rises and its range is 9–23% while on PD the total metal content is equal to or less than 5% at all stations. These increments are similar to that reported by (Chatterjee et al. 2013)) which is a study of fireworks over Kolkata. Delhi witnesses an anomalous increase in other elements post Diwali though other stations generally indicate a decreasing trend; metal content variation at Delhi requires more detailed analysis. While, for Delhi, Ahmedabad and Mumbai, K remains higher than usual on post-Diwali day, Pune has high content of K on PD as well as post Diwali day probably signature of locality and pattern of cracker usage. There are intermittent increases of Ca in this period, at Ahmedabad, Mumbai and small rise at Pune is seen as a possible effect of transport from North West as seen through back trajectories (not shown) and a local wind speed increase is also noticed. Total percentage of analyzed metals in PM2.5 is the highest in Mumbai and lowest in Delhi.
An increase in 'K', a pointer to biomass burning is also a marker for fireworks (Kumar et al., 2016). A similar variation in Delhi on 5th and 10th are also seen which looks similar to the spurt in vehicular traffic with more increase in Pb and Mn and other crustal elements. Evident from elemental variations, it appears that large amount of firework is absent other than DD though in the entire week some scattered ones may be occurring. Potassium (K) is used as an excellent marker of firework as the gun powder, a popular oxidizer has huge contents of potassium nitrates.
Table 2
Concentration of Elements on Pre-Diwali and Diwali day in PM2.5; first 6 rows show increase in all stations, next 3 except single station and the last three, non-systematic. Below LOD is replaced by a constant value less than LOD for that particular element just to get a factor
|
Elements
|
Pune
|
Delhi
|
Ahmedabad
|
Mumbai
|
|
Pre Diwali
|
Diwali
|
Factor Change
|
Pre Diwali
|
Diwali
|
Factor Change
|
Pre Diwali
|
Diwali
|
Factor Change
|
Pre Diwali
|
Diwali
|
Factor Change
|
|
K
|
2.89
|
35.58
|
12.3
|
4.2
|
55.104
|
13.0
|
5.081
|
77.937
|
15.3
|
2.89
|
21.932
|
7.6
|
|
Mg
|
0.19
|
2.993
|
16.0
|
0.2
|
5.533
|
27.7
|
0.269
|
2.684
|
10.0
|
0.313
|
0.93
|
3.0
|
|
Mn
|
0.03
|
0.094
|
3.2
|
0.02
|
0.23
|
9.6
|
0.01
|
0.064
|
6.4
|
0.03
|
0.037
|
1.2
|
|
Na
|
0.20
|
1.25
|
6.3
|
0.714
|
2.617
|
3.7
|
0.2
|
1.089
|
5.4
|
0.321
|
0.957
|
3.0
|
|
Pb
|
0.17
|
1.087
|
6.5
|
0.175
|
1.767
|
10.1
|
0.076
|
0.338
|
4.4
|
0.02
|
0.042
|
2.1
|
|
Ca
|
0.40
|
8.224
|
20.6
|
0.4
|
6.595
|
16.5
|
0.4
|
0.4
|
1.0
|
0.591
|
0.762
|
1.3
|
|
Cu
|
0.03
|
0.141
|
4.1
|
0.005
|
0.389
|
77.8
|
0.008
|
0.008
|
1.0
|
0.006
|
0.064
|
10.7
|
|
Fe
|
0.08
|
0.352
|
4.4
|
0.376
|
1.875
|
5.0
|
0.471
|
0.833
|
1.8
|
0.04
|
0.04
|
1.0
|
|
Zn
|
0.40
|
0.434
|
1.1
|
0.331
|
2.214
|
6.7
|
0.271
|
0.452
|
1.7
|
0.459
|
0.42
|
0.9
|
|
Cd
|
0.004
|
0.004
|
1.0
|
0.005
|
0.014
|
2.8
|
0.004
|
0.005
|
1.3
|
0.013
|
0.042
|
3.2
|
|
Cr
|
0.02
|
0.013
|
0.8
|
0.009
|
0.03
|
3.3
|
0.004
|
0.01
|
2.5
|
0.019
|
0.022
|
1.2
|
|
Ni
|
0.03
|
0.012
|
0.4
|
0.008
|
0.038
|
4.8
|
0.008
|
0.008
|
1.0
|
0.048
|
0.034
|
0.7
|
Vecchi et al., (2008) reported an increase of Sr, Mg, Ba, K and Cu by 121, 22, 12,11 and 6 times respectively over an hour’s period during a firework episode over Italy. 90% of PM2.5, 98% of Pb, 43% of total carbon, 28% of Zn are sole firework contribution as calculated by Wang et al., (2007) over the ‘Lantern Night’ festival. Over Lucknow, Barman et al., 2008 reported an increase of Cu, Ni, Chromium(Cr), Zn and Cadmium(Cd). Kumar et al., (2016) identified S, K, Ba and Mn during firework days which were absent on normal days, over Varanasi.
Table 2 provides the details of all elements analyzed and their variation form PD to DD. Ca, K, Mg, Mn, Na and Pb shows significant increase in all stations from PD to DD. Many studies have reported Lead (Pb), Manganese(Mn), Copper(Cu), Barium(Ba), Strontium(Sr), Iron(Fe), Nickel(Ni), Magnesium(Mg), Zinc (Zn) etc as the metals found in chemical analyses (eg. Vecchi et al., 2008,Moreno et al., 2007, Liu et al., 2016, Li et al., 2017, Liu et al., 2019). The increase in Mg that is used to produce very bright white is most high in Delhi with 27.7 times followed by Pune with 16.6 times while in the case of Ca, used as Calcium Cholride to produce a hue of Orange the increments are in reverse. Rise in Cu content in Delhi that gives the blue color is extraordinary in Delhi with 77.8 times increase while Mumbai is placed behind it with only 10.7 times. Increase in Pb also reached double digit in Delhi with a 10 times enhancement. These variations in elemental composition may be indicating a preference towards certain type of firework of public or a common supplier. In addition, Fe and Zn also increase significantly over Delhi, Pune and Ahmedabad. Cd, Cr, Cu and Ni did not exhibit a common variation.
The metals which reported an increase in all stations; Mn dust and fumes could result in metal fume fever or skin bubbles or gangrene and the poisoning slowly damages the central nervous system (Greenberg and Vearrier 2015). Mg fumes or dust causes toxicity that could result in lung function changes (Jaishankar et al. 2014). The increased heavy metal Pb in the form of fumes emitted during firework can cause mental retardation and semi-permanent brain damage in children of young age (Naranjo et al. 2020) including unexplained infertility in males (Benoff et al. 2000). The other heavy metal Cu fumes irritates respiratory track and repeated exposure to the same initiates "Wilson's disease" through layered deposition on multiple organs (Pujol et al. 2016). Ions though are not analyzed in this study the excesses of them associated with the firework episodes cause various respiratory illness, allergies, vomiting and so on.
Ion analyses are done for a spectrum of ions like NO3 −, NH4+, SO4-, Cl- and so on. The ions NO3-, NH4 + and SO4- showed significant increase on Diwali and post Diwali days. However the plots are not presented here for the non-uniform data gap among stations.
3.3 Effect On Specified Gas Concentrations
Trace gases, CO, NOx (NO + NO2), and O3 are also observed in SAFAR network and an abundance of the same is deterministic of secondary aerosol formation and also as an adverse health effect. Sulfur, Nitrates etc. are the chemicals used in crackers and burning of it generates oxides of sulphur and nitrogen along with carbon. Hence the trace gases are also important in terms of direct pollution or as medium aiding secondary aerosol, fog formation etc. Many studies related to Diwali also detail the trace gas variations and reported significant increments in connection with firework activity, (Attri et al. 2001; Ravindra et al. 2003). Figure 6 illustrates the variations of NOx, CO, O3 and NH3 during the campaign period for all the 4 cities. NOx and CO are precursors of O3, and O3 is formed due to photochemical reactions between them in the presence of sunlight (Yerramsetti et al., 2013,Gunthe et al., 2016). The diurnal pattern for NOx indicates bimodal peaks at all the locations. The NOx concentration at Delhi shows high concentration (~ 117 to 172 ppb) on the post Diwali day between 12 am to 8 am. At Pune a slight increase in concentration is observed on DD as compared to the previous days. In Mumbai the NOx concentration shows an increase from the night of 7th Nov and further peaks on 10th Nov. There is no significant change in NOx concentration at Ahemdabad even after Diwali period. A significant change in CO with about 1ppm is seen only over Delhi which is followed by Mumbai and Pune with no change in Ahmedabad. When we observe the O3, CO and NOx diurnal pattern inverse correlation is observed between them as the latter two are precursors of O3.
The particulate overload at Delhi should have resulted in considerable radiation cut-off that led to lower ozone generation while in Pune the rains cleared air to some extent not to curb radiation and at Mumbai increase in particulate itself was minimal but availability of precursors rose
somewhat helping build up of ozone. Source of NO and CO are oxides produced due to high temperature combustion as in internal combustion engine during an intense firework. In Pune, Mumbai and Delhi a considerable increase in the concentration of O3 is observed after DD, however in Ahmedabad it remains in the same range as before Diwali. NH3 measurements were available only at 3 cities and hence the same is shown in Fig. 6. It is observed that after DD there is a considerable increase in the NH3 concentration at the three locations.
NO2 generated during this event in escalated levels directly penetrate the smaller airways being less soluble and cause damage to the lining thus impairing smooth oxygen transfer process. Similarly higher levels of O3 creates various health issues (Lippmann 1989) affects plants too. Increased amount of CO blocks the oxygen exchange in red blood cells reaching up to the cellular level. (CPCB 2019)
Concentrations of O3, PM2.5 and PM10 of Delhi are comparable to the results of (Song et al., 2017) over Jinan, China in connection with their Spring festival, however CO concentrations are only upto 50% of their reports. It is clear that the trends in gases are not in tandem with particulates, presenting more consistent variations in response to Diwali firework episode but having more complex contributing factors like different activities, easier transport or meteorology.
3.4 Meteorology During Diwali Period
Figure 6 depicts the meteorological parameters during the Diwali period. The daily temperature, Relative Humidity (RH), wind speed (WS) and the Ventilation Coefficient (VC) for the period 3–12 Nov is shown in this figure. The Ventilation coefficient (VC) which is the product of mean wind (in mixing layer) and mixing layer height is considered as a measure of dispersive capacity of atmosphere. VC is consistently higher for Ahmedabad. Over Delhi VC is about 3000 m2 s− 1 prior to Diwali that drops to less than 1000 m2 s− 1 post Diwali which relates to the enormous aerosol loading and resulting insolation cut off. All cities except Pune sees VC reduction on the next day of DD. VC is based on the radiosonde measurements at 1700 h every day and Pune being cloudy on DD and it rained too the VC on 7th is small and it could not be determined on 6th. On 8th it was clear to a good extent and the same reflected as rise in VC.
Mumbai experiences comparatively low VC, below 1500 m2 s− 1. The other parameter that assists dispersion of pollution is surface wind. Generally higher winds prevail over Delhi for this period with a rise after Diwali. Ahmedabad falls in the second place with more wind speed but post Diwali there is a little drop, but remained high enough to aid dispersion. Mumbai and Pune experience very low wind speed and these winds could hardly play a part in dispersion. Hence it is clear that Ahmedabad meteorological conditions are conducive for faster dispersal of pollutants in the absence of extreme high levels of pollution. The temperature at the 4 cities does not vary significantly throughout the study period and thus it does not play a role in modulating the pollutants. Though at Delhi wind speed does not change much, the pollution level has reached extreme level. Moreover while considering the size distribution of PM it was observed that Ahmedabad had the highest difference between PM10 and PM2.5 range which is bound to help easy gravitational settling.
The swell in pollution is steep and that affected Delhi's pollution distribution by bringing down VC in spite of the strong support from higher winds. Limited rise in PM levels arrested worsening of air quality in Mumbai with increase in pollutant gas levels too after DD. In Pune, the rain washout controlled the impairment of air quality with otherwise non-supportive weather.