Mice
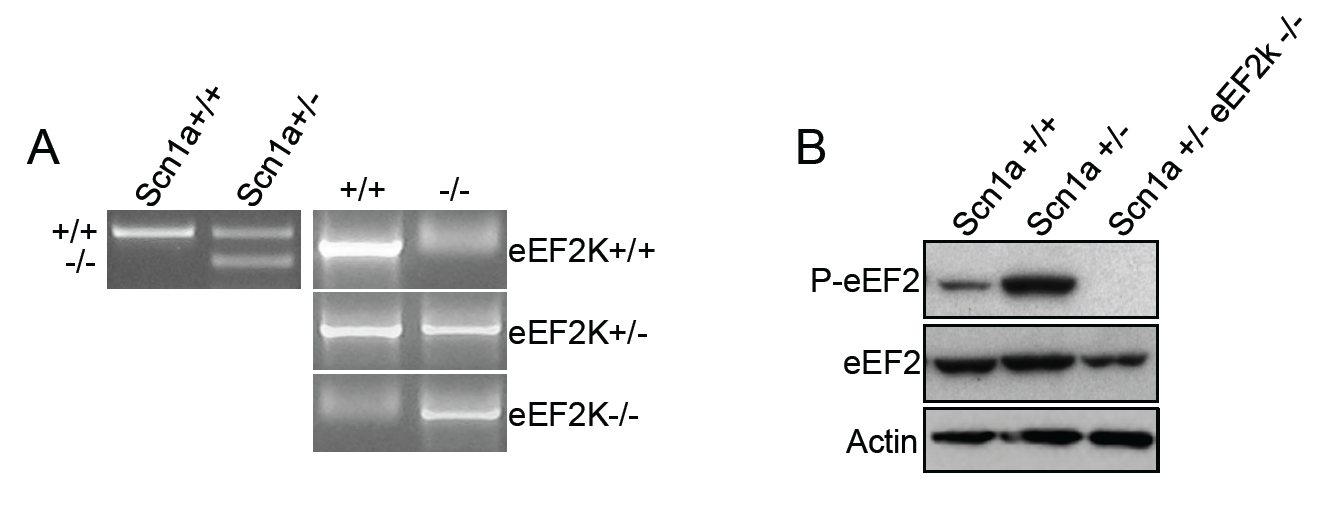
Scn1a+/- eEF2K-/- mice were generated by crossing Scn1a+/- mice (13) with eEF2K-/- mice (47) and backcrossed for about 20 generations before were used for all the experiments. Mice were housed under constant temperature (22 ± 1°C) and humidity (50%) conditions with a 12 h light/dark cycle and were provided with food and water ad libitum. All the experiments were performed on female and male mice. All experiments involving animals followed protocols in accordance with the guidelines established by the European Communitis Council and the Italian Ministry of Health (Rome, Italy) for the correct use of laboratory animals in research. Experimental procedures of EEG and behavioral analysis followed the guidelines established by the Italian Council on Animal Care and were approved by the Italian Government decree No. 17/2013 and 980/2017. All efforts were made to minimize the number of subjects used and their suffering.
Mice genotyping
All primers were provided from Thermo Fisher and the REDExtract-N-Amp PCR Reaction MixTM reagent used for the polymerase reaction was provided from Sigma-Aldrich®. The PCR for eEF2K was performed using two pairs of primers SA8 (5’-GGCCGGCTGCTAGAGAGTGTC-3’) and SA5 (5’-CATCAGCTGATTGTAGTGGACATC-3’) for WT allele and SA8 and Neo1 (5’-TGCGAGGCCAGAGGCCACTTGTGTAGC-3’) for mutated allele. PCR for SCN1A was performed using the following primer: 268 (5’-CGAATCCAGATGGAAGAGCGGTTCATGGCT-3’), 269 (5’-ACAAGCTGCTATGGACATTGTCAGGTCAGT-3’) and 316 (5’-TGGCGCTCGATGTTCAGCCCAAGC-3’).
Protein biochemistry
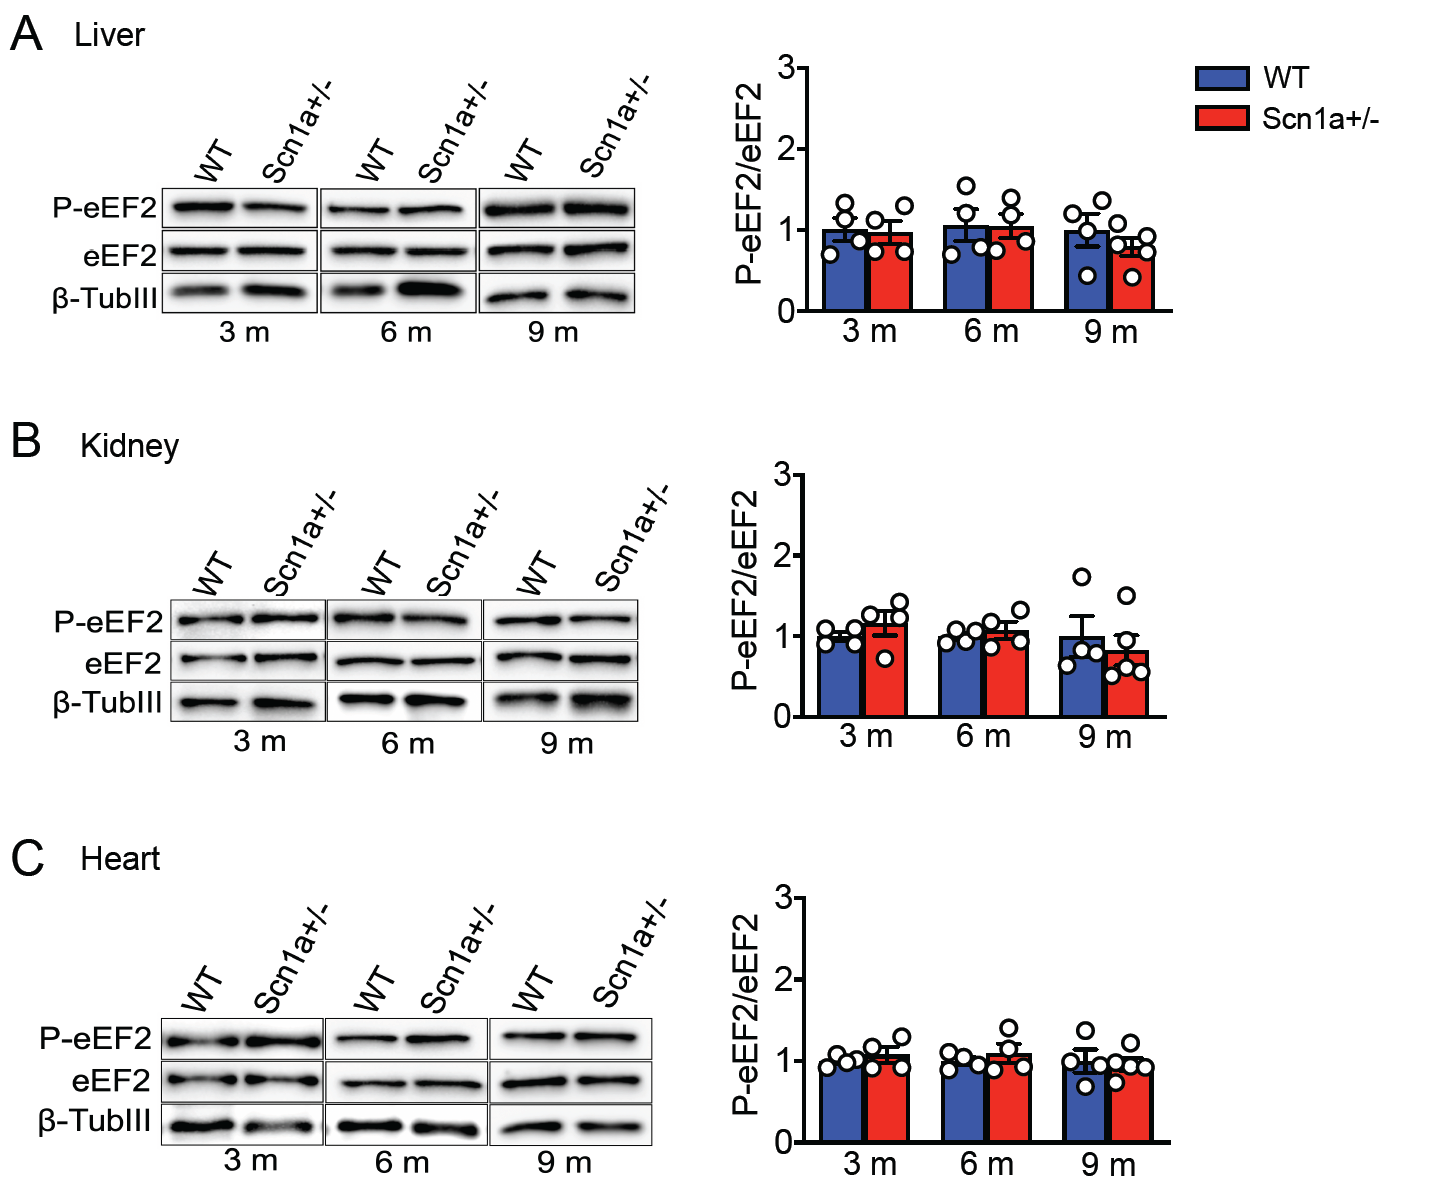
Mice were sacrified and hippocampus, cerebral cortex, liver, kidney and heart were dissected and lysate in buffer containing 10 mM Hepes pH 7.4, 2 mM EDTA, protease inhibitors (Sigma, P8340) and phosphatase inhibitors (Roche). Samples were centrifuged at 800 x g for 5 min at 4°C. Resulting supernatant were collected and quantified by BCA protein assay (EuroClone) to assess protein concentration and then solubilized in 4x loading dye (250 mM Tris-HCl pH 6.8, 40% glycerol, 0.008% bromophenol blue, 8% SDS; all from Sigma-Aldrich). All samples were boiled at 65°C for 10 minutes and then equal amounts of each sample were separated using SDS-PAGE and subsequently blotted on nitrocellulose membranes using the Trans- Blot Turbo System (Bio-Rad). Membranes were washed in Tris-buffered saline-Tween (TBS-T) (20 mM Tris pH 7.4, 150 mM NaCl (both Sigma-Aldrich) and 0.1% Tween 20 (Bio-Rad). After 1 hour blocking at room temperature with 5% Bovine Serum Albumin (BSA) or 5% milk in TBS-T, membranes were incubated overnight at 4°C with primary antibody in blocking buffer (TBS-T containing 3% BSA or 3% milk). The membranes were washed three times in TBS-T and then incubated with HRP-conjugated secondary antibodies in TBS-T and 3% BSA or 3% milk for 1 hour at room temperature. After three washes (10 min each), chemiluminescence was induced using an ECL Western Blotting Substrate kit and further detected using a ChemiDoc XRS+ machine. All signals were quantified using ImageLab softwer and normalized against the values of the respective signal for actin or βIII-tubulin.
Antibodies
The following primary antibody were used (dilution and source): mouse anti-actin (1:5.000 Sigma-Aldrich), mouse anti-βIII-tubulin (1:10.000 Sigma-Aldrich), rabbit anti-eEF2 (1:500 Cell Signaling), rabbit anti-peEF2 (T56) (1:1.000 Cell Signaling), mouse anti-Akt (1:1.000 Cell Signaling), rabbit anti-pAkt (S473) (1:1.000 Cell Signaling), rabbit anti-synapsin1/2 (1:1000 Synaptic Systems), mouse anti-GABAAR 𝜶5 (1:250 NeuroMab). All HRP-conjugated secondary antibodies were purchased from Jackson ImmunoResearch. HRP anti-rabbit (1:3.000) and anti-mouse (1:5.000) were used for western blot.
Electrophysiology
Preparation of brain slices.
Hippocampal slices were prepared from P25–P35 mice using standard procedures (24, 48). Mice were deeply anesthetized with isoflurane and decapitated. The brain was quickly removed, and horizontal hippocampal slices (300 μm) were cut with a Vibratome in chilled (0–4°C) slicing solution containing (mM) 75 sucrose, 87 NaCl, 25 NaHCO3, 25 D-glucose, 2.5 KCl, 1.25 NaH2PO4, 0.5 CaCl2, 7.0 MgCl2. The slices were transferred to a storage chamber andincubated at room temperature for at least 45 min before recording, then transferred to a recording chamber and perfused with ACSF containing (mM) 129 NaCl, 3 KCl, 1.8 MgSO4, 1.6 CaCl2, 1.25 NaH2PO4, 21 NaHCO3, and 10 D-glucose at 28/30 °C. All solutions were saturated with 95% O2 and 5% CO2.
Brain slice recording
Whole-cell voltage-clamp recordings were performed on CA1 hippocampal pyramidal neurons visualized with near infrared differential interference contrast (DIC) optics.For the recordings of inhibitory postsynaptic currents (IPSCs), the intracellular solution contained (mM) 135 CsCl, 10 N-2-hydroxyethylpiperazine-Nʹ-2-ethanesulfonic acid (HEPES), 0.2 ethylene glycol- bis(β-aminoethylether)-N,N,Nʹ,Nʹ-tetraacetic acid (EGTA), 2 Mg-ATP, 4 ATP, 10 phosphocreatine , pH 7.2 with CsOH. Kynurenic acid (KA, 3 mM) was included in the extracellular recording solution to block the excitatory synaptic transmission in IPSC recordings. The holding potential was -70 mV. Patch pipettes were pulled from borosilicate glass and, when filled with the intracellular solution, their resistance ranged from 3 to 5 MΩ. Recordings were obtained by means of a Multiclamp 700B amplifier, Digidata 1440 digitized and pCLAMP 8.0 software (Molecular Devices). Access resistance was continuously monitored for each cell. Only the cells with access resistance less than 20 MΩ were recorded, and recordings were terminated/discarded when a significant (>10%) increase occurred. Data were analyzed using Clampfit 10.5 (Molecular Devices) and Mini Analysis (Synaptosot).
Electroencephalography analysis
For electroencephalography (EEG) analysis P60-P90 mice were used. Mice were anesthetized with isoflurane (2% (v /v) in 1 L/min O2). Four screw electrodes (Bilaney Consultants GMBH, Dusseldorf, Germany) were inserted bilaterally through the skull over the cortex (anteroposterior, +2.0 –3.0 mm; let–right 2.0 mm from bregma), as previously described (49) and in agreement to brain atlas coordinates (50).;Mice were allowed to recover for approximately a week from surgery under antimicrobial cover (cetriaxone, Sigma-Aldrich; 50 mg/kg i.p.) before performing the experiments. EEG activity was recorded in awake freely moving mice placed in a Faraday chamber using a Power-Lab digital acquisition system (AD Instruments, Bella Vista, Australia; sampling rate 100 Hz, resolution 0.2 Hz).
Electroencephalography analysis under baseline conditions
Seven days after surgery basal cerebral activity was recorded continuously for 24 hours. All EEG tracings were analyzed and scored for the presence of spikes. EEG spikes were recognized as having a duration <200 ms with a baseline amplitude set to 4.5 times the standard deviation of the EEG signal (determined during inter-spike activity periods, whereas repetitive spiking activity was defined as 3 or more spikes lasting <5 seconds). Segments with electrical noise or movements artifacts were excluded from statistical analysis (49).
Electroencephalography analysis under thermal stress condition
The day afterEEG basal activity, mice body temperature was monitored and managed by a rectal temperature probe connected to a controller. Average mouse body temperature is 36.9°C and it was controlled by a heat lamp above the chamber. Mice were accustomed to the Plexiglas cage for at least 10 minutes at 37.5°C. Then, the body temperature was increased by 0.5°C every 2 minutes until a tonic-clonic seizure occurred or 42.5°C was reached (23, 51). Immediately after the heat stimulus was removed. Seven days after heat EEG basal activity was measured for 24 h and the number of spikes was evaluated.
Electroencephalography analysis under pharmacological inhibition of eEF2K by A484954
Two days after monitoring basal cerebral activity for 24 hours pellets were implanted in the lateral side of Scn1a+/- mice between ear and shoulder. Animals were treated for ten days with 10 mg of A484954/pellets that release 1 mg of drug every day. Placebo pellets were used in experiment as the proper control. During the 10 days of treatment EEG activity was recorded for 24 hours after 3,6 and 9 days of pellets implantation and analysed as previously described. Animals were sacrificed the last day of the pharmacological treatment.
Behavioral procedure
Mice of P60-P90 were used for behavioral experiments. Animals were housed in groups of four or five individuals of mixed genotypes. All of the tests were conducted during the light portion of the cycle. To minimize the number of animals each mouse was submitted to a maximum of 3 tests with an interval of 1 week between two tests. All the behavioural experiments followed the ARRIVE guidelines. A total of 205 mice was used (64 WT,76 Scn1a+/-,65 Scna1+/-eEF2K-/-. Animals were divided in different groups (Group 1 – EEG 4WT,6 Scn1a+/-,5Scna1+/-eEF2K-/- for heat seizure, 5 Scn1a+/- for vehicle ,5 Scn1a+/- for A484954); Group 2 -behavioural tests, 10 mice per genotype: 2A-elevated plus maze, novel object recognition, tail suspension ; 2B-self-grooming,wire hanging, spatial object recognition),Group 2C (balance beam, marble burying, pole test);Group 2D (locomotor activity, sociability/social novelty, rotarod) Group 2E: Morris water maze, acquisition and reversal; Group 2F (T-maze, acquisition and reversal).
In addition, a further group of 70 animals (34 WT and 36 eEF2K-/-) was used to investigate sensory abilities, motor coordination, sociability, anxiety- and depression-like behaviour and episodic and spatial memory (Group3A (range of 8-12 animals for genotype): olfactory and visual cliff test, balance beam and Novel Object Recognition; Group 3B (a range of 5-10 animals for genotype): Self-grooming, Pole test and Spatial Object Recognition; Group 3C ( range of 5-12 animals for genotype): Rotarod test, Sociability test and Tail Suspension).
All the behavioral scoring was performed on a blind basis by a trained experimenter.
Locomotor activity
The spontaneous motor activity was evaluated in an automated activity cage (43 × 43 × 32 cm) (Ugo Basile, Varese, Italy), located in a sound-attenuating room as previously described (52). Horizontal and vertical activity were detected by infrared photobeam break sensors put from 2.5 cm and 4 cm from the floor of the cage, respectively. Cumulative horizontal and vertical movements were counted for 3 hours.
Wire hanging
The limb force was tested by positioning a mouse on the top of a wire cage lid (19 x 29 cm) that was turned upside down at approximately 25 cm above the surface of the bedding material. The grip of the mouse was ensured by gently waving three times before rotating the lid as described in (53). The latency to fall onto the bedding was registered (cut-off = 300 s).
Balance beam walking test
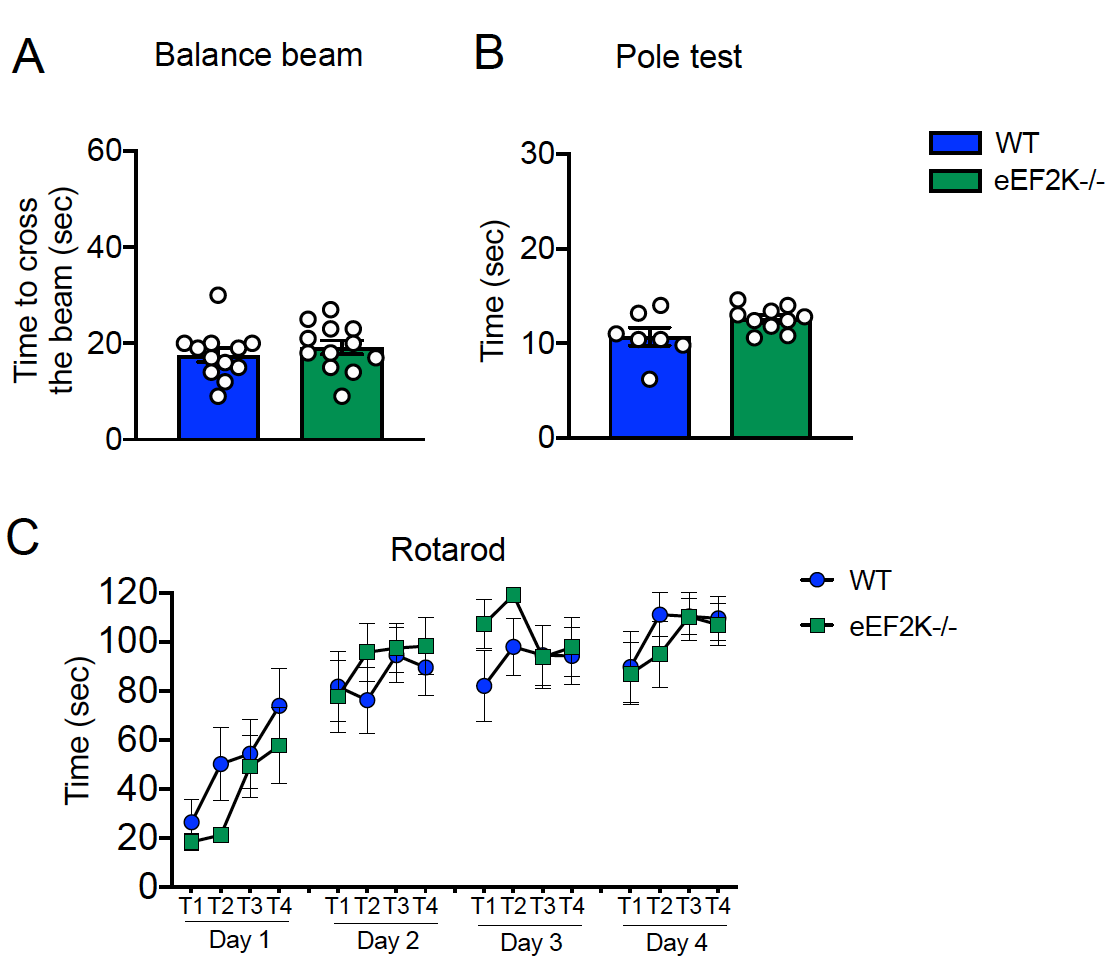
The balance beam walking test is a test for assess motor coordination and balance as previously described (54). The beam apparatus consisted of 1 m beams with a flat surface of 12 mm width resting 50 cm above the table top on two poles. At the end of the beam a black box was placed as the finish point. Nesting material from home cages was placed in the black box to attract the mouse to the finish point. A lamp (with 60-watt light bulb) was used to shine light above the start point and served as an aversive stimulus. A video camera was set on a tripod to record the performance. On training days, each mouse crossed the 12 mm beam 3 times. The time required to cross to the escape box at the other end (80 cm away) was measured with a stopwatch. The stopwatch started when the nose of the mouse began to cross the beam and stopped when the animal reaches the escape box. Once the mice are in the safe box, they are allowed some time (~15 sec) to rest there. Before the next trial the mice rest for 10 min in their home cages between training sessions on the two beams. On the test day, times to cross each beam were recorded. Two successful trials in which the mouse did not stall on the beam are averaged. The beams and box were cleaned of mouse droppings and wiped with towels soaked with 70% ethanol and then water before the next beam was placed on the apparatus.
Pole test
In the pole test, which evaluated motor coordination, mice were trained for 2 days (in the morning and in the afternoon) to descend a vertical pole (90 cm length, 1 cm diameter). Every training consisted of three trials. Mice were accustomed to the room 20 minutes before trials and test day. The test was performed the third day and the time necessary to the mice to descend the pole in five trials was recorded. A cut-off of 60 seconds was given (55), with minor modifications). Data were shown as mean of 5 trials evaluated during the test day.
Rotarod
The rotarod was used to measure fore and hindlimb motor coordination and balance. During the training period, each mouse was placed on the rotarod apparatus (Ugo Basile, Biological Research Apparatus, Varese, Italy) at a constant speed 12 rpm for a maximum of 120 seconds, and the latency to fall off the rotarod within this time period was recorded. Mice received four trials per day for 4 straight days.
Repetitive self-grooming
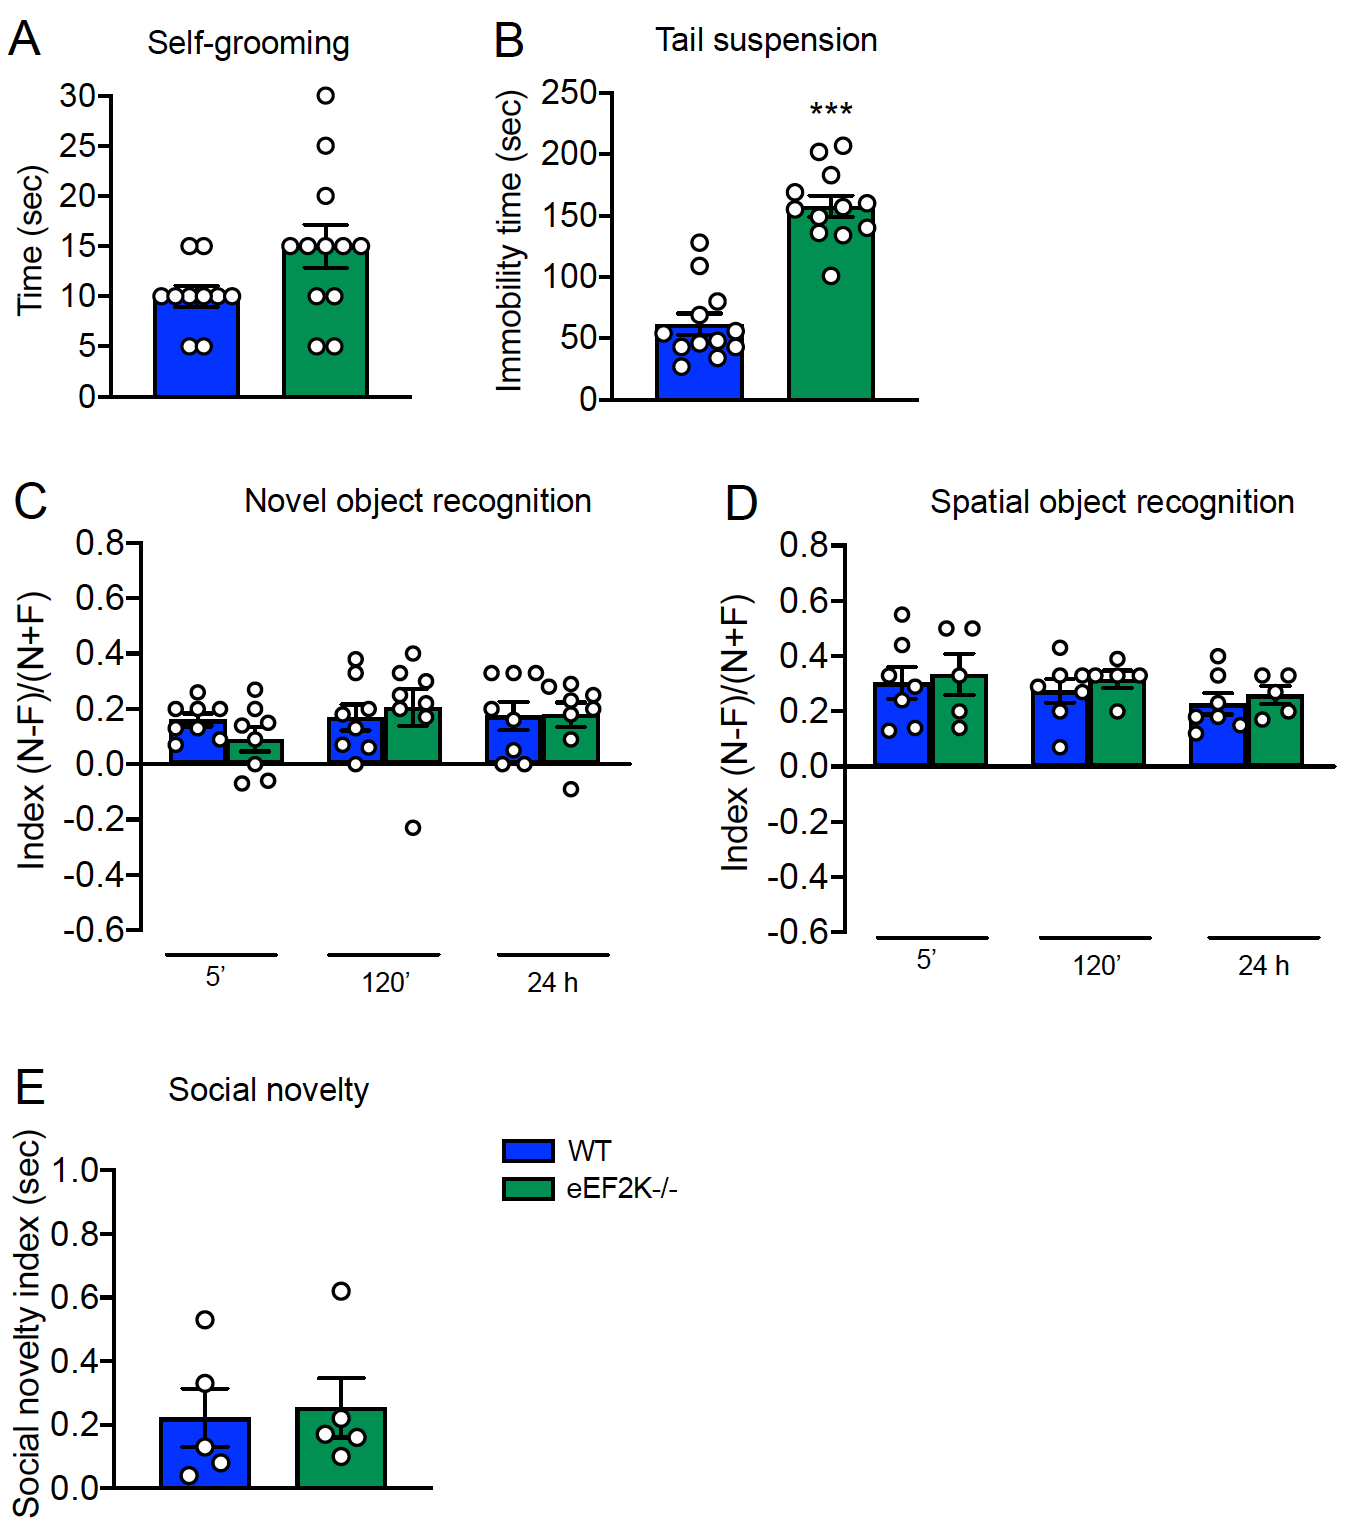
Mice were assessed for spontaneous self-grooming as a measure of repetitive behavior as previously described in (56). Each mouse was placed into a standard plastic cylinder (46 x 23.5 x 20 cm). Cylinder was empty to eliminate digging in the bedding, which is a potentially competing behavior. The room was illuminated at about 40 lux. A front-mounted CC TV camera (Security Cameras Direct) was placed at circa 1 m from the cages to record the sessions. Sessions were video-taped for 20 min. The first 10 min of habituation was not scored. In the next 10 minutes mice were scored with a stopwatch for cumulative time spent grooming all the body regions. The cylinder was cleaned with 70% ethanol between each animal.
Elevated plus maze
The Elevated Plus Maze paradigm was used to study anxiety related behavior. The apparatus had a central platform (10 x 10 cm) from which originated two opposite open arms (30 x 10 cm) and two enclosed arms (30 x 10 x 14 cm) according to (57). The apparatus was made of white wood, placed to a height of 60 cm above floor level in the center of a small quiet room under dim light (about 30 lux). The test was conducted in the morning, during the early light phase of the light cycle. After 20 minutes of familiarization to the novel environment, mice were placed individually onto the center of the apparatus, facing an open arm. Experimenter recorded for 5 minutes the number of open- and closed-arm entries and the time spent in open- and closed-arms.
Marble burying
Mouse marble burying can be associated to both anxiety-like traits, increased by novelty, and obsessive/compulsive-like behaviour as previously described in literature (58). The marble burying assay is applied to evaluate how many novels glass marbles a rodent would bury. This behaviour was assessed using a clean cage (50 × 25 × 30 cm) filled with 3 cm bedding, lightly tamped down to make a flat, even surface. Each mouse was placed individually into the corner of the empty cage where previously food marbles were placed covered by the bedding. The latency to the first marble buried and the number of marbles buried (to 2/3 their depth) with bedding were recorded over a maximum period of 900 sec.
Tail suspension
Tail suspension test assayed depressive-like behaviors of mice as described in (59). Tail suspension test was performed on an apparatus with a support at 35 cm from the basis where was fixed a hook where mouse tail was fasten at about 1 cm from the origin. The test was preceded by a familiarization phase where mice were let in the room test at least 1 hour before. The test day lasted 6 min during which the experimenter measured time of mouse immobility.
Novel Object Recognition test
The novel-object recognition test was performed over 3 straight days in an open plastic arena (60 × 50 × 30 cm) as previously described (60). The test had 3 phases. In the habituation one, the first day, mice were habituated to the empty arena for 10 minutes, the familiarization and novel-object recognition the day after. In the familiarization phase, two identical objects were placed in the middle of the arena equidistant from the walls and from each other. Mice were placed between the two objects until it had completed 30 s of cumulative object exploration (20 minutes cut-off). Object recognition was measured when each animal was within approximately 1 cm of an object with its nose toward the object. Climbing the object or pointing the nose toward ceiling near the object were not considered exploring behaviors. After familiarization, mice were returned to the home cage until they were tested for novel recognition after 5 minutes, 120 minutes or 24 h. In the novel recognition phase, a novel object (never seen before) took the place of one of the two familiars. Scoring of object recognition was performed as during the familiarization phase. For each mouse, the role (familiar or new object) as well as the relative position of the two objects were randomly permuted. The objects used for the test was white plastic cylinders and colored plastic Lego stacks of different shapes. The arena was cleaned with 70% ethanol after each trial. Performance was analyzed by calculating a discrimination index (N-F/N+F), where N = the time spent exploring the novel object, and F = the time spent exploring the familiar object.
Spatial object recognition test
Spatial object recognition test was performed in an arena according to (61), with minor modifications that consisted in an opaque white plexiglass cage (58 × 50 × 43 cm) that was dimly lit from above (27 lux) and two visual cues were placed above two adjacent walls. In the center of the northern wall there was a black and white stripped pattern (21 × 19.5 cm) and in the center of the western wall there was a black and gray checkered pattern (26.5 × 20 cm). The objects were placed across the visual cues. Mice were habituated to the arena for 10 minutes the day before the test. The test day, first mice were allowed to familiarize with two different objects. The experimenter measured the time spent in sniffing both objects until the mouse completed 30 seconds in exploring objects (cut-off 20 minutes). Exploring behavior was defined as mouse having its nose directed toward the object and within approximately 1 cm of the object (62); climbing or sitting were not considered exploration behaviors. After 5 minutes, 120 minutes and 24 hours from familiarization phase mice were allowed to re-explore the cage where one object was moved in a new position. Scoring of object recognition was performed as during the familiarization phase. Between two sessions, mice returned to their home-cage. Cage and object were carefully cleaned with 70% ethanol before and after all behavioral procedures. Performance was analyzed by calculating a discrimination index (N-F/N+F), where N = the time spent exploring the moved object during the test and F = the time spent exploring the unmoved object during the test.
T-maze
Mice were deprived of food until they reached 90% of their free-feeding body weight. Mice were habituated to a black wooden T-maze (with a 41 cm stem section and a 91 cm arms section, and each section was 11 cm wide and had walls that were 19 cm high) and trained to obtain food within the maze for 5 days as previously described (63). During the acquisition phase, one arm was designated to be reinforced with Coco Pops (Kellogg’s) in each of ten daily trials. Each mouse was placed at the start of the maze and allowed to freely move and choose which arm to enter. The number of days required to reach the goal criterion (80% correct for 3 days) was recorded. Each mouse that met the goal for acquisition was then tested using a reversal procedure in which the reinforce was switched to the opposite arm. A cut off of 20 days in both acquisition and reversal phase was established.
Morris water maze
The Morris water maze test was used to analyze changes in the learning and memory abilities of the mice according to the methods described in Morris (64) (adapted for mice). The Morris water maze consisted of a circular water maze (120 cm in diameter x 50 cm in height) filled with water. The pool was divided into 4 quadrants. A circular hidden platform with a diameter of 10 cm was placed inside the maze, and its surface was maintained at 0.5 cm below the surface of the water.
Floating plastic particles were placed on the surface of the water to hide the platform from sight according to the methods of (65). During the habituation trials, mice were placed in a random area inside the maze and allowed to swim for 60 seconds. During the acquisition trials, mice were given 4 daily trials (with 60 minutes inter-trial intervals) for 4 straight days in which each mouse empty wire cage was released into the pool at different starting points and trained to locate a constant platform position. At 24 hours after the last trial, a probe test was performed in which the platform was removed. Two days later, a reversal task was performed to assess cognitive flexibility. The platform was placed in the opposite quadrant of the maze, and 4 daily trials were performed for 4 straight days. On the fifth day, a probe trial was performed that was similar to that in the acquisition phase. The time spent in the target area and the latency to reaching the target zone were evaluated.
Sociability and preference for social novelty test
The sociability tests were performed in a rectangular apparatus in transparent polycarbonate with three-chamber (width = 42.5 cm, height = 22.2 cm, central chamber length = 17.8 cm, and side chamber lengths = 19.1 cm) as previously described in (63). In the 10 minutes habituation phase, each mouse was placed in the middle compartment and free to explore all chambers. Then, one side of the compartment was occupied an unfamiliar male mouse and the other contained an empty wire cage. Immediately after sociability test, without cleaning the apparatus, it was performed the social novelty test putting an unfamiliar mouse in the empty wire cage. Every test lasted 10 minutes in which were measured the time spent exploring each chamber. The data were expressed in sociability index (SI) and social novelty preference index (SNI) as follows: SI = (time exploring novel mouse 1 – time exploring empty cage)/(time exploring novel mouse 1 + time exploring empty cage) and SNI = (time exploring novel mouse 2 – time exploring familiar mouse)/(time exploring novel mouse 2 + time exploring familiar mouse).
Statistical analyses
Based on the number of comparisons and the pattern of data distribution, appropriate statistical tests were used to analyze the data. Data are expressed as the mean ± SEM or percentage, analyzed for statistical significance, and displayed by Prism 8 software (GraphPad Software). Shapiro–Wilk tests was applied to test the normal distribution of experimental data. Normal distributions were compared with one simple t-test, student t-test or ANOVA with appropriate post hoc test. Non-normal distributions were compared with the non-parametric Wilcoxon test, Mann–Whitney test or Kruskal – Wallis test with appropriate post hoc test, as indicated. The accepted level of significance was p<0.05. Statistical analyses for every experiment are described accordingly in the figure legends.