3.1. Antioxidant activity
In order to evaluate the antioxidant potential of B. bifurcata fractions (MF1–MF7; MC18F1-MC18F5; AEF1 – AEF11) different approaches have been outlined, including the determination of total phenolic content (TPC) by the Folin–Ciocalteu method, DPPH radical scavenging activity, oxygen radical absorbance capacity (ORAC), and ferric reducing antioxidant power (FRAP). The results are shown in Table 1.
Table 1. Antioxidant potential of Bifurcaria bifurcata fractions collected off Peniche coast, Portugal.
|
Extraction
|
Fractions
|
Extraction Yield
(%)
|
TPC a
|
DPPH b
|
ORAC c
|
FRAP d
|
|
MeOH
|
F1
|
0.26
|
0.05 ± 0.01
|
>100
|
46.96 ± 6.30
|
447.18 ± 7.35
|
|
F2
|
3.00
|
14.94 ± 0.98
|
>100
|
635.94 ± 9.94
|
547.96 ± 2.75
|
|
F3
|
5.71
|
11.24 ± 1.78
|
>100
|
398.15 ± 21.28
|
603.99 ± 29.82
|
|
F4
|
3.47
|
8.16 ± 2.81
|
>100
|
1747.20 ± 164.13
|
512.60 ± 19.61
|
|
F5
|
1.14
|
12.89 ± 0.28
|
>100
|
6945.81 ± 301.40
|
561.66 ± 8.20
|
|
F6
|
0.47
|
5.56 ± 0.62
|
>100
|
1216.21 ± 139.04
|
682.62 ± 7.21
|
|
F7
|
4.96
|
7.75 ± 0.17
|
>100
|
591.81 ± 29.79
|
115.06 ± 7.83
|
|
MeOH C18
|
F1
|
32.18
|
8.17 ± 0.34
|
>100
|
588.26 ± 39.61
|
299.95 ± 1.67
|
|
F2
|
5.48
|
63.33 ± 2.95
|
>100
|
6631.05 ± 108.96
|
3431.22 ± 23.15
|
|
F3
|
4.94
|
10.17 ± 0.51
|
> 100
|
768.65 ± 45.94
|
400.84 ± 4.86
|
|
F4
|
1.89
|
144.76 ± 5.91
|
>100
|
683.49 ± 30.31
|
412.74 ± 5.49
|
|
F5
|
1.45
|
9.11 ± 0.29
|
>100
|
2532.34 ± 113.47
|
329.29 ± 3.02
|
|
Ethyl acetate
|
F1
|
3.41
|
12.79 ± 5.02
|
> 100
|
2054.83 ± 31.96
|
537.13 ± 3.37
|
|
F2
|
0.54
|
12.03 ± 1.34
|
> 100
|
3245.26 ± 30.75
|
540.50 ± 4.88
|
|
F3
|
0.26
|
10.23 ± 1.87
|
> 100
|
6944.25 ± 126.71
|
498.17 ± 6.78
|
|
F4
|
0.30
|
16.40 ± 1.38
|
> 100
|
1934.54 ± 53.29
|
470.27 ± 10.43
|
|
F5
|
0.44
|
7.08 ± 1.37
|
> 100
|
2405.159 ± 45.68
|
523.18 ± 3.93
|
|
F6
|
11.59
|
17.07 ± 1.54
|
> 100
|
18 951.24 ± 571.14
|
577.29 ± 1.27
|
|
F7
|
15.52
|
24.12 ± 2.54
|
> 100
|
16 896.72 ± 645.48
|
455.36 ± 10.18
|
|
F8
|
0.82
|
74.79 ± 3.25
|
23.58
(11.40 – 48.77)
|
16 901.58 ± 323.58
|
3442.03 ± 40.88
|
|
F9
|
1.88
|
72.02 ± 2.40
|
> 100
|
7419.54 ± 368.96
|
937.56 ± 13.69
|
|
F10
|
0.93
|
76.22 ± 1.59
|
> 100
|
10 942. 03 ± 472.20
|
985.43 ± 1.44
|
|
F11
|
0.54
|
12.79 ± 5.02
|
> 100
|
10 772.03 ± 472.20
|
922.89 ± 23.15
|
|
-
|
Phloroglucinol
|
-
|
-
|
> 100
|
9 567.93 ± 521.86
|
-
|
a mg phloroglucinol equivalents/g extract (mg PE /g extract); b radical scavenging activity (EC50 µg/mL); c µmol Trolox equivalents/ g extract (µmol TE /g extract); d µM FeSO4/g extract. MeOH – Methanol.
As shown in Table 1, the best extraction yields were achieved with water and a mixture of MeOH and DCM (MC18F1 – 32.18%; AEF7 – 15.52%; AEF6 – 11.59% fractions), while lower yields were obtained with less polar solvents (MF1 – 0.26%, AEF3 – 0.26%, and AEF4– 0.30% fractions).
Regarding the TPC, fractions MC18F4 (144.76 ± 5.91 mg PE /g extract), AEF8 (74.79 ± 3.25 mg PE/g extract), AEF9 (72.02 ± 2.40 mg PE/g extract), AEF10 (76.22 ± 1.59 mg PE/g extract), and MC18F2 (63.33 ± 2.95 mg PE/g extract) presented the highest phenolic content, when compared to other fractions. Concerning the DPPH radical scavenging ability, AEF8 fraction demonstrated the highest potential to reduce the DPPH radical (EC50 = 23.58 µg/ mL (11.40 – 48.77)) when compared with other fractions. In the ORAC method, fractions AEF6 (18 951.24 ± 571.14 µmol TE/g extract), AEF7 (16 896.72 ± 645.48 µmol TE/g extract) and AEF8 (16 901.58 ± 323.58 µmol TE/g extract) showed the highest antioxidant activity. Fractions MC18F2 (3431.22 ± 23.15 µM of FeSO4/g of extract) and AEF8 (3442.03 ± 40.88 µM of FeSO4/g of extract) also revealed to be effective in reducing ferric ions when compared with other fractions, for example MF7 (115.06 ± 7.83 µM of FeSO4/g of extract) and MC18F1 (299.95 ± 1.67 µM of FeSO4/g of extract) (Table 1).
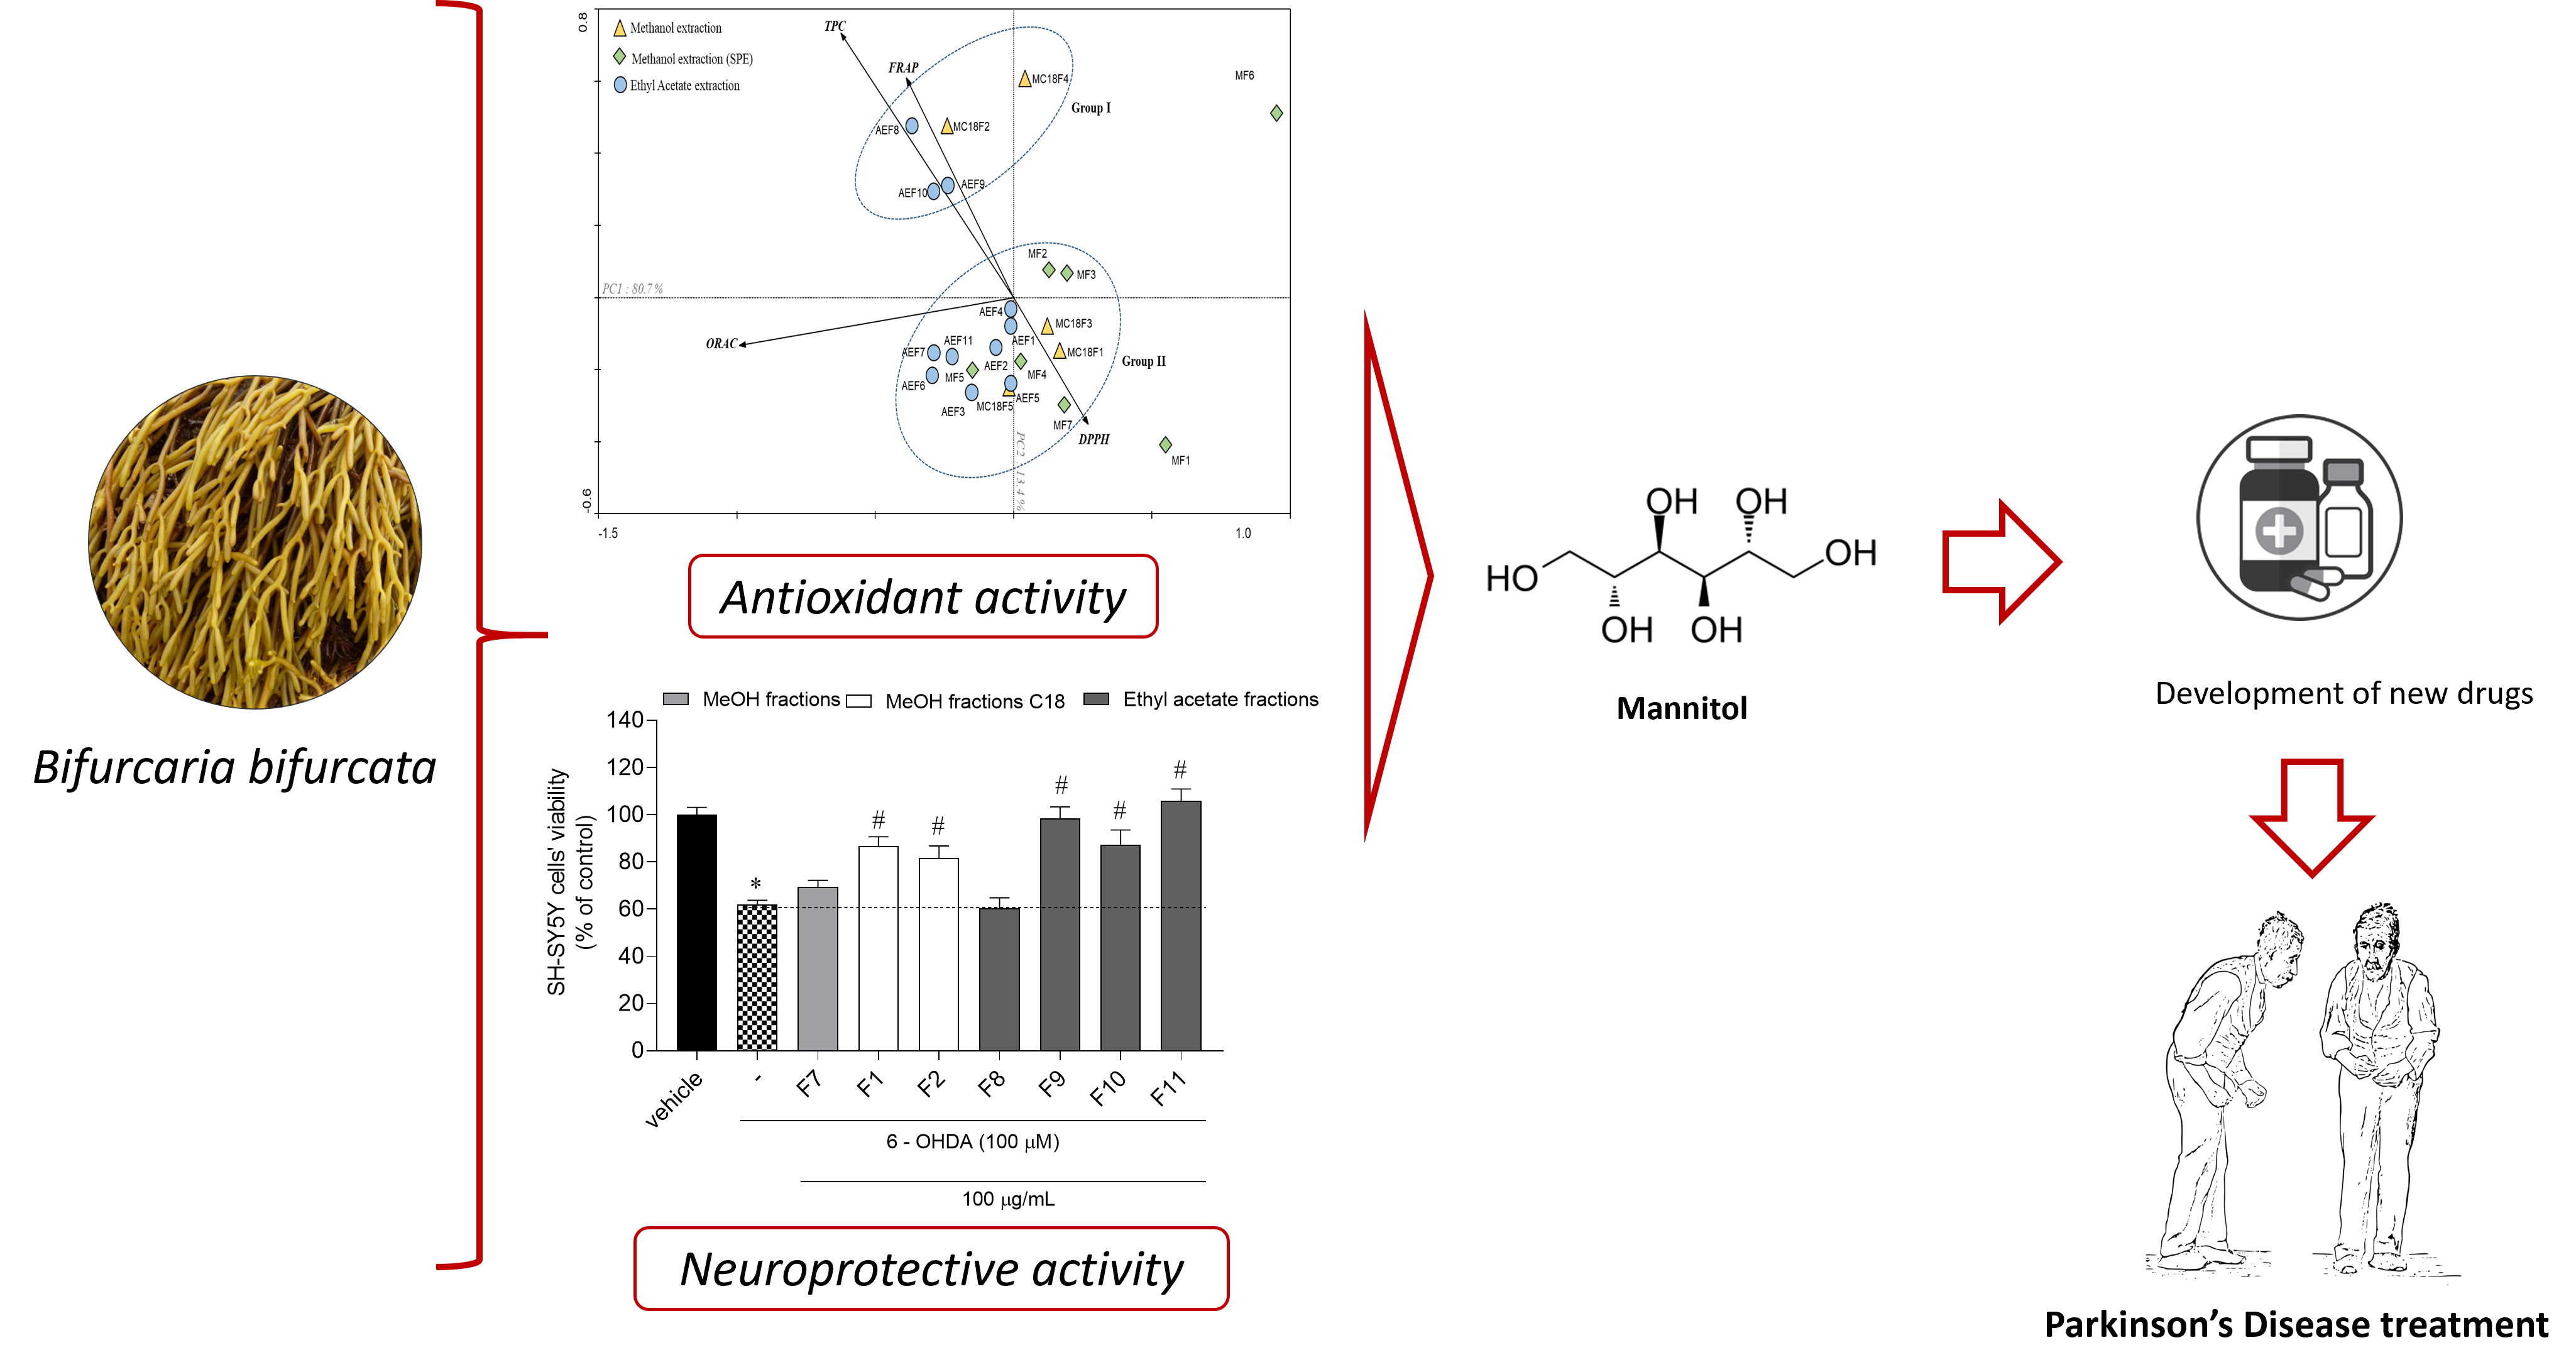
The main components analysis (PCA) carried out in this study allowed us to to correlate the antioxidant capacity with the total phenolic content. It is possible to observe a clear arrangement of two groups that differ according to their antioxidant capacity (Figure 2)
Figure 2 shows the ordination of the different antioxidant methods using PCA analysis of the fractions obtained from B. bifurcata. PC1 accounted for 80.7% and PC2 13.4% of the total variance. In PC1, the horizontal axis expresses an opposition between DPPH (right), and antioxidant methods FRAP and TPC (Left). Moreover, FRAP and TPC present a negative correlation with DPPH (Figure 2). Since DPPH radical scavenging activity is expressed by EC50, it is possible to verify that fractions which presented high phenolic content and potential to reduce iron ions also exhibited high DPPH radical scavenging activity (Group I). On the other hand, the fractions present in group I, mainly MF7 and MF1, showed low levels of TPC, and exhibited low DPPH radical scavenging activity. Moreover, fractions MC18F2, MC18F4, AEF8, AEF9 and AEF10 showed high FRAP and TPC values when compared with the samples present in group II.
3.1 Cytotoxicity and neuroprotective activity of Bifurcaria bifurcata fractions on SH-SY5Y cells
The cytotoxic and neuroprotective effects of B. bifurcata fractions on SH-SY5Y cells were evaluated. Firstly, SH-SY5Y cells were treated with different B. bifurcata fractions (100 µg/mL) for 24 h. Fractions with no cytotoxicity were further tested for their neuroprotective potential. The neuroprotective effects were evaluated on SH-SY5Y cells treated with 6-OHDA in the presence/ absence of B. bifurcata fractions (100 µg/mL) after 24 h. The results are presented in Figures 3A and 3B.
In Figure 3A it is possible to observe that only MF7, MC18F1, MC18F2 and AEF8-AEF11 fractions showed no cytotoxic effects when compared with the vehicle situation. Thus, fractions that did not exhibit cytotoxicity were evaluated for their neuroprotective activity and associated mechanisms on SH-SY5Y cells treated with 6-OHDA (100 µM) in the presence of B. bifurcata fractions (100 µg/mL) for 24 h. Observing Figure 3B, it is possible to verify that the treatment accomplished with 6-OHDA (61.86 ± 1.88%) led to a decrease of mitochondrial function about 38.14 ± 1.88% when compared with vehicle (100.00 ± 3.15%). On the other hand, fractions MC18F1 (86.67 ± 3.95%), MC18F2 (81.68 ± 5.08%), AEF9 (98.53 ± 4.82%), AEF10 (87.38 ± 6.17%) and AEF11 (105.90 ± 5.05%) showed neuroprotective effect recovering the mitochondrial function loss induced by 6-OHDA treatment (24.81 ± 3.95%; 19.82 ± 5.08%; 36.07 ± 4.82%; 25.52 ± 6.16 % and 44.04 ± 5.05%, , respectively).
3.2 Study of the effects on Parkinson’s Disease biomarkers
In order to better understand which cellular mechanisms are associated with the neuroprotective effects mediated by B. bifurcata fractions on SH-SY5Y cells, different hallmarks linked to PD development were studied, namely MMP, ROS production and Caspase–3 activity. The results are presented as percentage of control and depicted in Figure 4.
The treatment with seaweed fractions did not induce effects on the mitochondrial membrane potential, ROS production and Caspase-3 activity when compared with the vehicle (data not shown). SH-SY5Y cells were treated with 6-OHDA (100 µM) in the presence of B. bifurcata fractions for 6 h. Cells exposed to 6-OHDA increase ROS levels about 65.6 ± 4.19% when compared with the vehicle situation (Figure 4A). In the other hand, MC18F2, AEF9 and AEF10 fractions reduced ROS production in 52.90 ± 15.05%, 40.7 ± 1.78%, and 41.7 ± 4.19%, respectively. The effects on mitochondrial membrane potential (Δψm) were evaluated using the JC-1 probe. SH-SY5Y cells exposed to 6-OHDA induced a depolarization of Δψm (192.70 ± 16.86%) when compared to the vehicle. By the other side, fractions AEF9, AEF10 and AEF11 exhibited ability to restore the mitochondrial membrane potential loss promoted by 6-OHDA treatment (156.00 ± 12.53%, 108.80% ± 24.29% and 145.10 ± 18.55 %, respectively) (Figure 4B).Regarding, Caspase-3 activity, the treatment of SH-SY5Y cells with 6-OHDA (239.90 ± 11.30%) led to a significant increased of the Caspase–3 activity when compared with vehicle (100.00 ± 33.69%). On the other hand, fractions MC18F2 (179.1% ± 5.23%) and AEFF9 (22.24% ± 1.54%) exhibited a significant decrease of Caspase-3 activity promoted by 6-OHDA (Figure 4C).
3.3 Anti – inflammatory activity of Bifurcaria bifurcata fractions on RAW 264.7 cells
For the B. bifurcata fractions that displayed neuroprotective activities, their anti-inflammatory effects were studied on LPS - induced RAW264.7 cells. Firstly, the cytotoxicity of seaweed fractions (100 µg/mL; 24 h) was evaluated on RAW264.7 cells and the effects were estimatedby the MTT method. Fractions without cytotoxicity were further tested for their inflammatory and anti-inflammatory potential on RAW264.7 cells. The inflammatory and anti-inflammatory effects of seaweed fractions was estimated through the NO production. The results are presented in Figures 5A-C
Bifurcaria bifurcata fractions at 100 µg/mL did not induce cytotoxicity on RAW 264.7 cells (Figure 5A). After cells´ treatment with LPS and fractions, it was possible to observe that only LPS stimulated the NO production (Figure 5B). On the other hand, fractions MC18F1 (286.80 ± 38.85%), MC18F2 (98.89 ± 7.34%), AEF8 (122.20 ± 6.57%), AEF10 (153.50 ± 15.81%) and AEF11 (122.10 ± 6.57%) decreased the NO levels in the LPS-stimulated RAW 264.7 cells when compared with LPS situation (390.10 ± 17.08%) (Figure 5C).
3.4 Effects of Bifurcaria bifurcata fractions on the pro-inflammatory cytokine’s levels
The effects of of pre-treatment with B. bifurcata polar fractions (100 µg/mL; 1h) on LPS - induced RAW264.7 cells was evaluated in the levels of TNF-α and IL-6 cytokines after 18 h (Figure 6).
LPS-induced RAW 264.7 cells induced a significant increase of TNF-α (703. 40 ± 22.30%), IL-6 (329.20 ± 52.47%) production as compared to vehicle situation (100.00 ± 18.94% and 100.00 ± 2.52%, respectively). On the other hand, all fractions induced a significant decrease of TNF-α and IL-6 levels as compared with LPS situation.
A general overview of the antioxidant, neuroprotective and anti-inflammatory activities of B. bifurcaria fractions is presented in Table 2.
In the Table II is possible to observe that AEF8 fraction showed high antioxidant capacity in all the evaluated methods when compared with other fractions. On the other hand, this fraction did not exhibit neuroprotective potential. However, fractions AEF9, AEF10, AF11, MC18F1 and MC18F2 displayed neuroprotective activity and capacity to decrease ROS production, mitochondrial disfunction and Caspase-3 activity against 6-OHDA damage. Regarding the anti-inflammatory activity, all fractions, excepting fraction AEF9 decrease NO production induced by LPS treatment. Furthermore, seaweed fractions also revealed capacity to decreased IL-6 and TNF-α cytokines release. Accordingly, these five fractions that exhibited the best bioactive potential i were studied regarding their chemical profile.
3.5 Chemical characterization of Bifurcaria bifurcata bioactive fractions
The chemical profile of the five most bioactive fractions (MC18F2, AEF8, AEF9, AEF10, and AEF11) from B. bifurcata were analyzed by NMR spectroscopy. The 1H NMR spectra of MC18F2 fraction revealed signals (3.6-3.9 ppm) attributed to mannitol, the major component, being spectral data in full accordance with the available standard (Figure S1). Spectral data of fraction AE1F11 showed several chemical shifts ranges (7.8-7.6, 7.6-7.4, 4.4-4.1, 2.4-0.8 ppm) compatible with phthalate derivatives, while HPLC-DAD analysis evidenced a major peak (RT= 27.09—min) supported by a UV-Vis spectra characteristic of a phthalate (Figure S2). Additionally, a GC-MS analysis has shown fragmentation peaks (m/z 149, 167, 261, 279) attributed to di-n-octyl phthalate, which is in full accordance with literature data (Yin et al. 2014). The complexity of fractions AEF8, AEF9 and AEF10 evidenced by 1H NMR spectroscopy (Figure S3) was also confirmed by HPLC-DAD, showing that they were mixtures of many compounds (Figure S4). More specifically, NMR spectra of those fractions (Figure S5) evidenced some similarities between them having shown chemical shifts ranges (6.4-5.9, 5.6-4.9, 4.4-3.5, 2.2-0.8 ppm) compatible with the structures of linear diterpenes commonly found in Bifurcaria species (Pais et al. 2019). Indeed, overlapped small intensity signals in the 6.0-6.4 region can also be attributed to phenolic compounds, which may suggest the presence of minor amounts of phlorotannins (Roy 2020).
(Figures S1 – S4 are available at Supporting Information.)
3.6 Evaluation of the neuroprotective activity of mannitol
The neuroprotective activity of mannitol, identified by NMR spectroscopy as the major compound of the bioactive fraction MC18F2, was also evaluated. SH-SY5Y cells were exposed to several concentrations (1 – 100 µM; 24 h) of mannitol to define the non-neurotoxic concentrations, being that 1-100 µM concentrations no revealed cytotoxicity. Thus, neuroprotective activity was tested in SH-SY5Y cells exposed to 6-OHDA (100 µM) in the presence/ absence of mannitol, for 24 h. The effect on cells’ viability and the hallmarks associated to PD, namely ROS production, mitochondrial membrane potential and Caspase-3 were studied. The results are presented in Figure 7.
The exposure of SH-SY5Y cells to 6-OHDA reduced cells’ viability in about 32% (67.64 ± 3.33%) when compared to vehicle (100.00 ± 5.57%) after 24 h treatment. However, when 6-OHDA was incubated in the presence of 50 and 100 µM of mannitol, cells’ viability increased in about 30 - 35% (Figure 7A). At these concentrations, mannitol also showed capacity to reduce ROS levels (50 µM: 109.4 ± 3.00% and 100 µM: 100.7 ± 1.55%) (Figure 8B) and, at 100 µM, mannitol displayed ability to inhibit Caspase-3 activity (177.30 ± 6.67%) (Figure 7D) when compared with 6-OHDA situation (119.60 ± 3.27% and 227.60 ± 4.45%, respectively). Concerning the MMP depolarization, none of the assayed concentrations prevented the effects induced by 6-OHDA treatment (Figure 7C).