Chemicals
Analytical grade solvents (ethanol, isopropanol, hydrochloric acid, phosphoric acid) were supplied by ChemSupply, Australia. LC-MS grade solvents (acetonitrile and formic acid) were acquired from Thermo Fisher Scientific, US. Deionized water was used during plant growth experiments, whereas Milli-Q water (Merck Millipore, Germany) was used for all analytical processes. Formulation of Hoagland solution is supplied in Additional file 1.
Root-TRAPR system fabrication
Materials used for fabricating Root-TRAPR system are listed in Table 1 and the fabrication procedure is described step by step as follows.
Printing PDMS mold, external frames and supplementary parts
PDMS mold (Fig. 2e), top and bottom external structural frame (Fig. 2d), stand (Fig. 2h) and window shutter (Fig. 2i) were manufactured using a FDM 3D printer (MakerBot Replicator plus, US). All components were designed using an open-source computer-aided design (CAD) software (FreeCAD, https://www.freecadweb.org/). The design files are supplied in Additional files 6–11. Infill was set at 80% for external structural frame and 10% for PDMS mold, stand and window shutter. The objects were printed on a raft base layer with a light fill support underneath. Layer height was set at 0.2 mm with 2 shells. After printing, the internal surfaces of the PDMS mold were finished with coarse (P80) and fine (P600) sandpapers. Printing scrap and support were removed from all printed items prior to use.
Casting PDMS gasket
A Sylgard 184 elastomer kit (Dow Corning, US) was used to create the PDMS gasket. Standard 10:1 (w/w) ratio of base to catalyst was used. Eighteen g of silicone base was mixed with 1.8 g of curing agent in a disposable foil baking cup. The mixture was placed in a vacuum chamber for 30 min to remove air bubbles and then gently poured into the 3D-printed PDMS mold. Overfill was removed by scraping a ruler across the top surface of the mold. The filled mold was incubated at 55°C overnight to allow the elastomer to set. The solidified PDMS gasket was slowly cut away from the mold using a single edge razor blade. Completed PDMS gasket is shown in the middle of Fig. 2c.
Preparation of the upper viewing window acrylic sheet
An acrylic sheet was cut into a desired size (128×85 mm) using a Felder BF-5 combination machine (Felder Group, Austria). Then two circular holes were added using a drill press with appropriately diameter sizes of 8- and 9-mm bits. The upper larger hole (9 mm) is left blank for placing the seed, while the lower smaller hole (8 mm) was firmly stoppered with a rubber bung (Fig. 2g) to stop leakage. Completed acrylic sheet is presented on the left of Fig. 2c.
Assembly of Root-TRAPR unit
The completed Root-TRAPR system was assembled by placing the PMDS gasket between a microscope glass slide underneath and an acrylic sheet atop. The three internal components were then positioned inside the pocket of the bottom external frame and enclosed by the top frame. Finally, eight sets of pre-sized nylon bolts and nuts (Fig. 2f) were screwed in to tighten the layers and complete the main assembly. Additionally, during growth experiments the stand (Fig. 2h) and window shutter (Fig. 2i) can be incorporated to tilt the model at a 25° angle from the ground to promote gravitropism and to prevent direct light onto the plant root, respectively.
Sterilizing Root-TRAPR system
Before use, the assembled Root-TRAPR system and supporting parts were placed in a plastic container and submerged in 70% ethanol for 30 min and 100% ethanol for another 10 min. It was shaken occasionally to ensure all parts exposed to the solvent and the oval root growth chamber was filled throughout. After sterilization, the solvent was drained off and the model was dried in a laminar flow cabinet. Once seedlings had germinated, the sterilized Root-TRAPR system was rinsed with autoclaved deionized water and filled with 15 ml of full-strength Hoagland solution.
Colloidal chitosan preparation
Colloidal chitosan was prepared according to previous method [64] with a slight modification. Five g of chitosan powder (medium molecular weight; Sigma, US) was first mixed with 50 ml of 85% phosphoric acid, followed by slowly adding another 50 ml of the acid with continuous stirring. The mixture was left at 4°C overnight to form a colloidal suspension. Pre-cooled 500 ml of 50% ethanol was added to dilute the mixture, then left at 4°C overnight again. The suspension was filtered through Whatman Grade 1 filter paper (Whatman plc, UK) aided by vacuum filtration. Colloidal chitosan was retained in the funnel and then washed with distilled water until pH above 5. The retentate was transferred to 50-ml conical tubes and then lyophilized in an Alpha 1–4 LD plus freeze-drier (Christ, Germany). Before use, dried chitosan was resuspended to 1% w/v in Hoagland solution.
Seed germination
Overview of experimental workflow starting from seed germination until sample collection is illustrated in Fig. 7. Industrial hemp seeds, Ferimon (France) was received from Southern Hemp Australia. Obtaining and processing industrial hemp (low-THC cannabis) at the University of Melbourne is authorized by Agriculture Victoria, the State Government (authority number 2019/12). The seeds were sterilized with 70% ethanol for 1 min and 0.04% sodium hypochlorite for 10 min, followed by rinsing 3 times with autoclaved deionized water. Sterile seeds were imbibed at room temperature overnight and transferred to round petri dishes (90 mm in diameter) containing moistened filter paper. Germination was conducted in the dark at ambient temperature (approximately 20°C) for three days. Day 0 was counted when the seedlings were transferred into Root-TRAPR system.
Plant growth and chitosan treatment
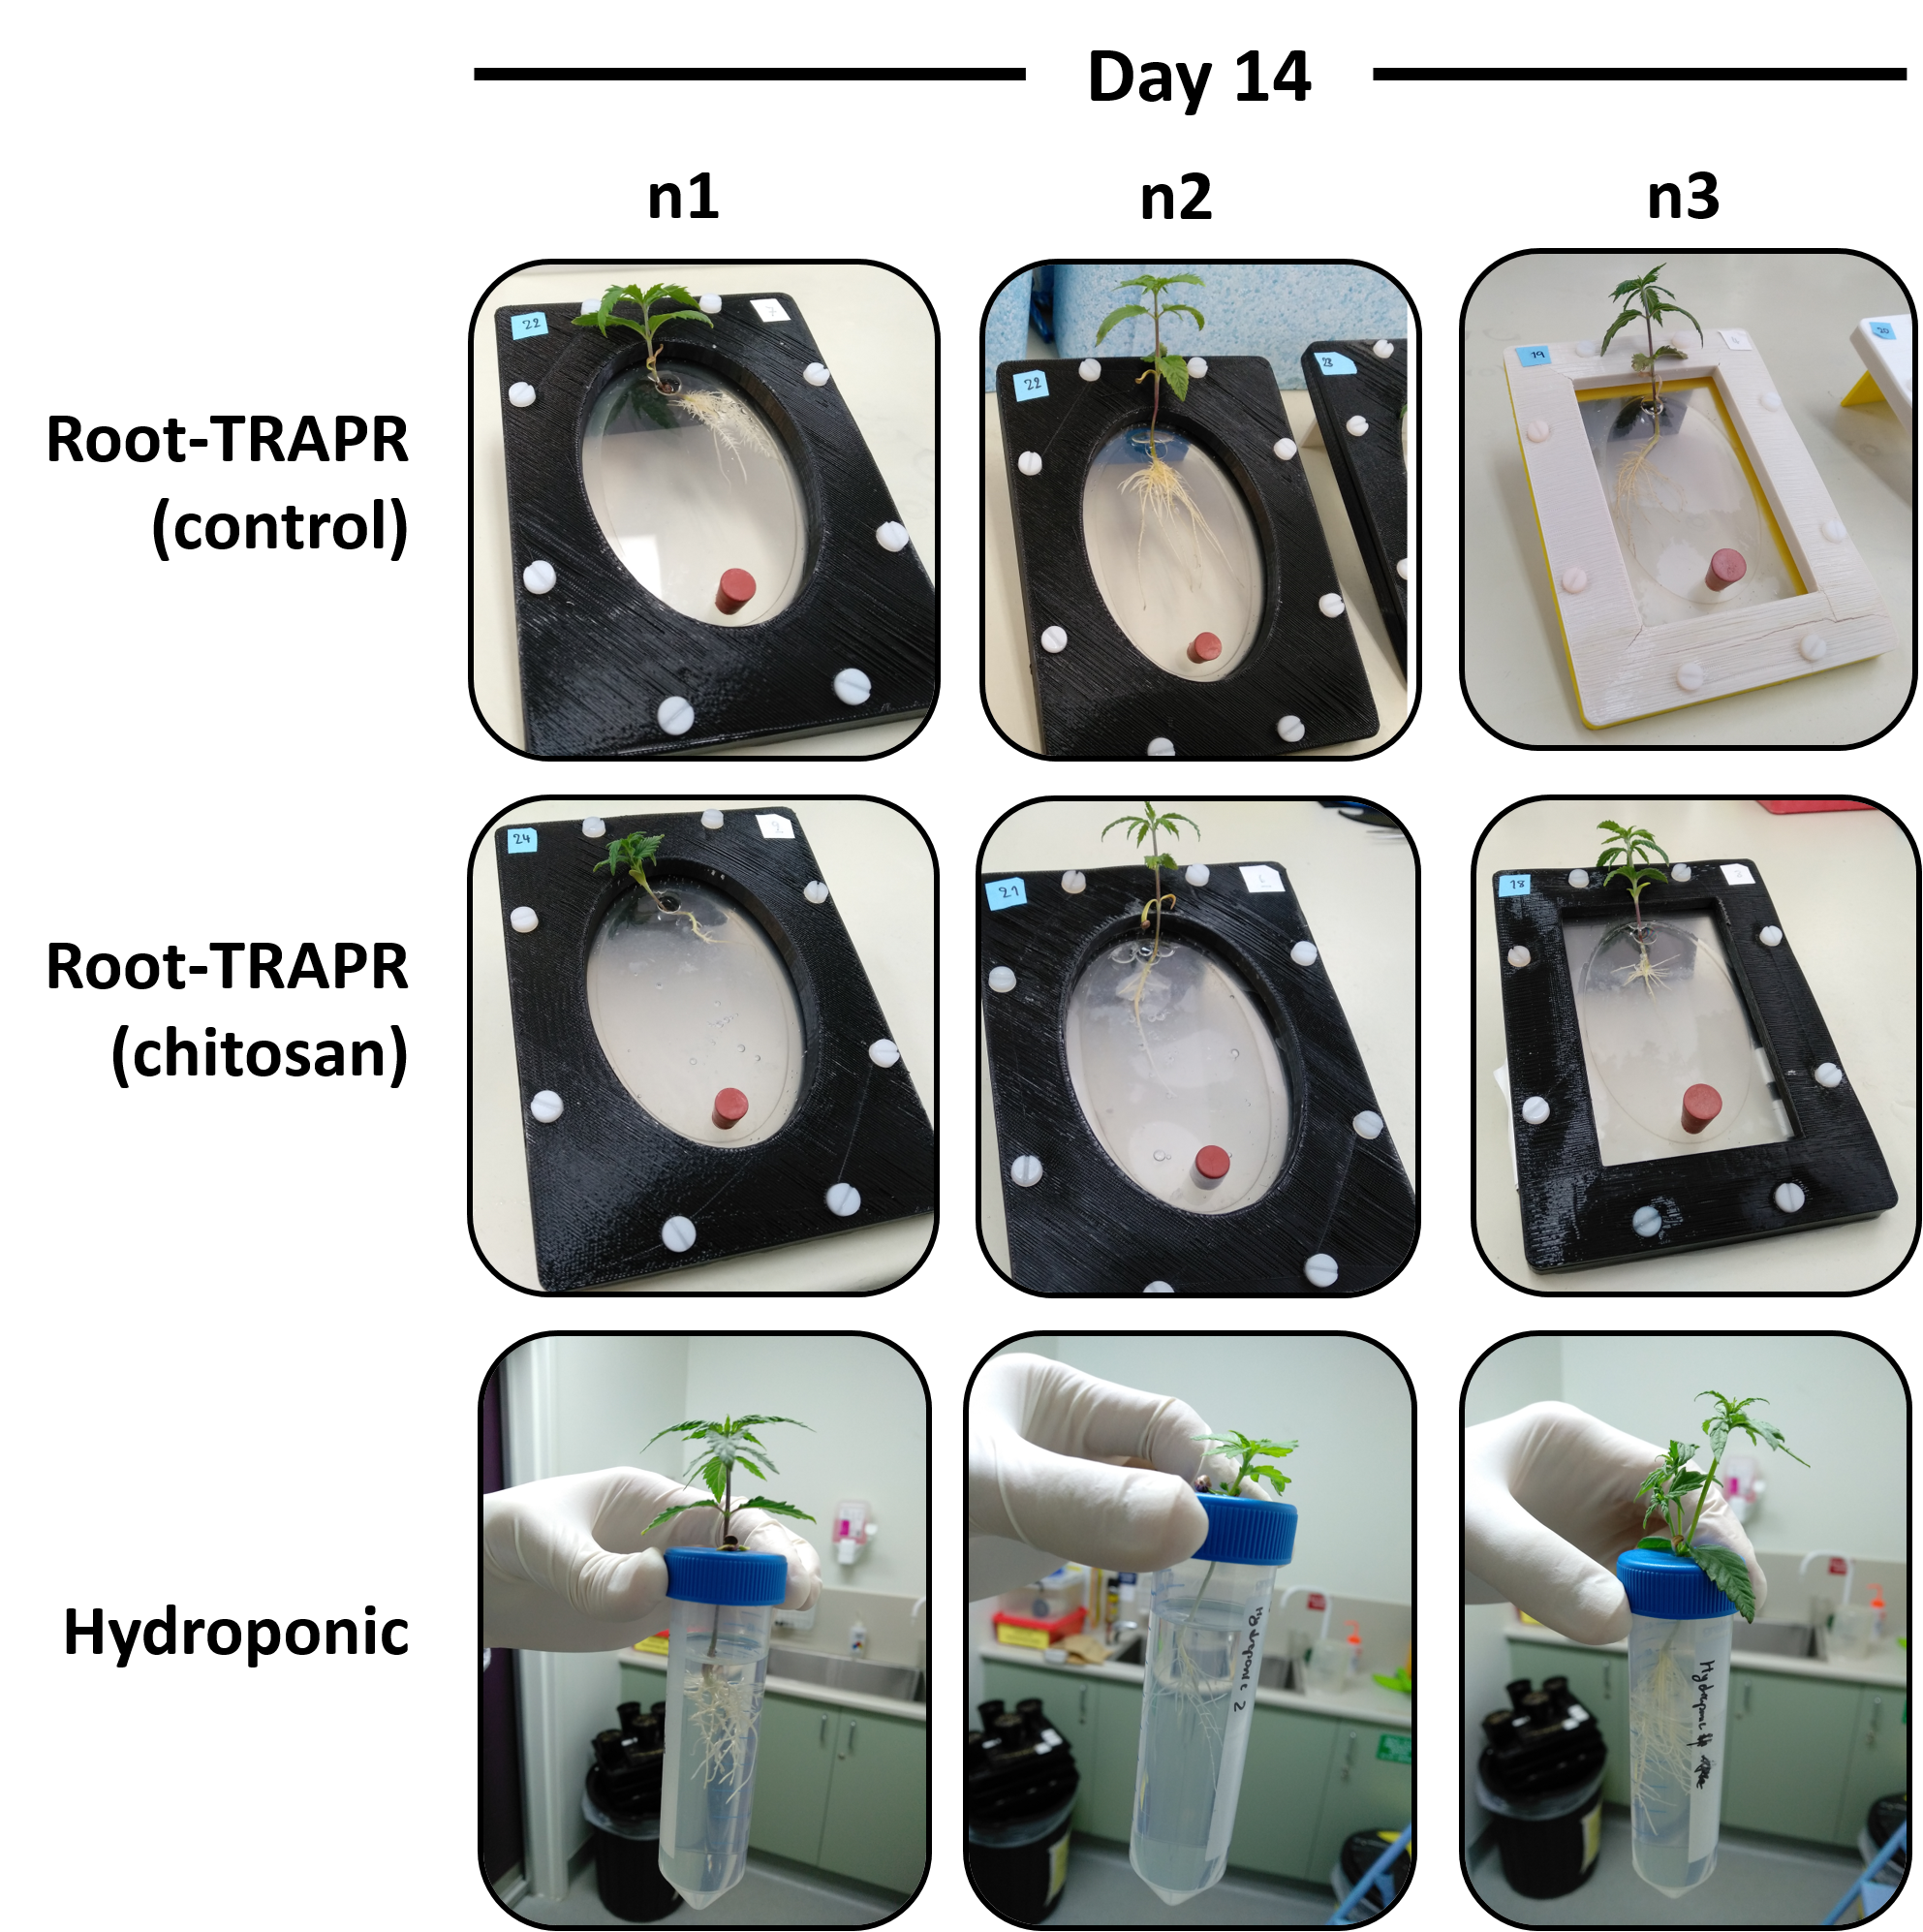
Seedlings with 4–6 cm-long tap root were transferred to Root-TRAPR systems supplied with 15 ml of Hoagland solution using sterilized forceps. Plants were maintained for seven days in a CMP6010 growth chamber (Conviron, Canada) at 25°C for 16 h with light and at 21°C for 8 h of darkness. Light intensity was set at level 2 and relative humidity was maintained at 60%. Nutrient solution was filled up every 2–3 days to compensate liquid consumption and evaporation. On day 7, plants were separated into two groups – control and chitosan conditions. In control group, the entire solution was collected and substituted with a new 15 ml of Hoagland solution. In chitosan group, pre-treated solution was collected and replaced with 1% w/v colloidal chitosan suspension. All plants were maintained under the same condition for another seven days. Hoagland solution (approximately 1–2 ml) was added up every 2–3 days in both groups for liquid compensation.
Root growth measurement
Root growth was monitored and analyzed under a well-calibrated root scanning system which is composed of an optical scanner (Epson Perfection V800, Japan) equipped with WinRHIZO Arabidopsis 2019 software (Regent Instruments, Canada). Plant roots were scanned every 2–3 days by placing the Root-TRAPR device straight on the document table of the scanner and leaving the lid open. Root measurement was determined in three different parameters – root length, root surface area and average root diameter. Root region was automatically detected by the software in a greyscale mode. Root was set brighter than background. Manual adjustment was carried out when root region was misread by the automatic detection. Root analysis was performed under standard precision and normal cross detection. Additionally, plant shoot and overview plant structure were photographed using a smartphone camera (Xiaomi Redmi 5, China).
Plant tissues and root exudate collection
Plant shoot and root tissues were harvested on the last day of observation. Plant shoot included stem and leaves sitting above the node of the cotyledons. Plant root was assigned to all parts developing under Root-TRAPR root growth chamber. They were ground using mortar and pestle under freezing conditions of liquid nitrogen. Fine tissue powder was separately transferred to three micro-centrifuge tubes in an approximate 100 mg by weight (Fig. 7). The tubes were weighed and stored in a -80°C freezer until further use.
Root exudate was collected twice on day 7 (pre-treatment) and day 14 (post-treatment). It was drawn from the Root-TRAPR root growth chamber into a 50-ml conical tube. The solution was spun at 2,500 ×g, 4°C for 20 min to remove debris. Supernatant was transferred to a 10 kDa molecular weight cutoff (MWCO) Amicon Ultra-15 centrifugal filter unit (Merck Millipore, Germany) and then centrifuged at 4,000 ×g, 4°C for 40 min to concentrate root exudate proteins. Approximately 200 µl of protein fraction was captured in the filter unit and stored at -80°C until further use.
Biological assays
For tissue samples (shoot and root), 1 ml of 100 mM phosphate buffer, pH 6.5 was added to extract proteins from tissue powder (approximately 100 mg). The tube was vortexed and centrifuged at 13,000 ×g for 20 min. Supernatant was collected and stored at -20°C until assay. For root exudate, concentrate protein (approximately 200 µl) was straightaway assayed as follows.
H2O2 detection
Working solution of titanium tetrachloride (TiCl4) was pre-made by slowly adding 100 µl of concentrated TiCl4 solution (product code: 208566, Sigma, US) to 100 µl of 6 M hydrochloric acid (HCl) on ice. The mixture was left at 4°C overnight and then diluted in 10 ml of 6 M HCl.
Twenty µl of tissue extract was mixed with 80 µl of 100 mM phosphate buffer, pH 6.5 in 96-well microplate. Immediately before detection, 100 µl of working TiCl4 solution was added into each well. Absorbance was measured at 415 nm using an EnSpire Multilabel plate reader (PerkinElmer, US). H2O2 content was calculated against a calibration curve, created from serial dilutions of 0.001–0.05% v/v standards.
Protein measurement
Bradford reagent (Bio-Rad, US) was diluted 5 times in deionized water. A 20 µl of protein extract was mixed with 180 µl of diluted Bradford reagent in 96-well microplate. The mixture was incubated at room temperature for 10 min. Absorbance was detected at 595 nm using the plate reader. Protein concentration was measured against a bovine serum albumin (BSA) standard curve (0-100 µg/ml).
Peroxidase activity
Twenty µl of protein extract was mixed with 150 µl of 0.025% H2O2, diluted in 100 mM phosphate buffer, pH 6.5 in 96-well microplate. Immediately before assay, 50 µl of 50 mM guaiacol was added into the solution. Absorbance was measured at 470 nm and repeated every 30 s. Rate of absorbance change on the first 3 min was calculated to represent guaiacol peroxidase activity in a unit of ΔOD/min, normalized to protein amount.
Chitinase activity
Dimethylaminobenzaldehyde (DMAB) stock solution was prepared by dissolving 8 g of DMAB pellet in a mixture of 70 ml of glacial acetic acid and 10 ml of 32% HCl. Before the assay, working DMAB solution was prepared by diluting the stock solution 10 times in glacial acetic acid.
Forty µl of protein solution was mixed with 100 µl of 1% w/v of colloidal chitin [65], suspended in 50 mM acetate buffer, pH 5.5 and then incubated at 37°C for 2 h. The reaction was stopped by centrifugation at 8,000 ×g for 10 min. Forty µl of 1 M sodium borate buffer, pH 8.5 was added into a mixture, then incubated at 95°C for 5 min and cooled on ice for 20 min. Five hundred µl of working DMAB reagent was added into a solution, then incubated at 37°C for 20 min. Final solution was aliquoted into a 96-well microplate and detected at 585 nm. Chitinase activity was evaluated against GlcNAc standard curve (0.02-2 mM) and expressed as mmole GlcNAc released per 1 g protein.
Phytohormone measurement
Phytohormones were extracted from tissue powder using 200 µl of 70% methanol supplied with 500 ng/ml of internal standards (d5-zeatin, d2-IAA, d7-CA, d4-SA, d6-ABA and H2JA). Samples were vortexed and centrifuged at 13,000 ×g for 20 min. Supernatant was transferred into a glass LC-MS vial containing an insert and injected to 1200 series LC system equipped with 6410 Triple Quadrupole MS machine (Agilent, US). Metabolites were separated on Eclipse XDB-C18, 1.8 µm, 2.1×100 mm column (Agilent, US). Column temperature was set at 45°C. Mobile phase A and B were 0.1% formic acid in water and acetonitrile, respectively. The elution gradient was set as follows: 80% A (0–2 min), 80 − 50% A (2–3 min), 50 − 5% A (3–12 min), 5% A (12–16 min), 5–80% A (16–17 min) and 80% A (17–23 min). Flow rate was 320 µl/min and injection volume was 5 µl. Analytes were ionized using electrospray ionization (ESI) source with capillary voltage at 5500 V and 4500 V for positive and negative modes, respectively. Nebulizer was set at 55 psi. Nitrogen gas flow was maintained at 13 L/min and 250°C. Phytohormones were detected using multiple reaction monitoring (MRM) program according to the published method [66]. The MRM transitions, collision energies and polarities were applied as follows: zeatin (220.1 ◊ 136.1 m/z, 14 eV, positive), IAA (176.1 ◊ 130.1 m/z, 10 eV, positive), CA (149.1 ◊ 103.1 m/z, 20 eV, positive), BL (481.5 ◊ 315.3 m/z, 10 eV, positive), SA (137.0 ◊ 93.0 m/z, 16 eV, negative), ABA (263.1 to 153.1 m/z, 8 eV, negative), JA (209.1 ◊ 59.0 m/z, 8 eV, negative), JA-Ile (322.1 ◊ 129.9 m/z, 24 eV, negative), OPDA (291.0 ◊ 164.9 m/z, 20 eV, negative), d5-zeatin (225.2 ◊ 137.1 m/z, 20 eV, positive), d2-IAA (178.1 ◊ 132.0 m/z, 12 eV, positive), d7-CA (156.1 ◊ 109.0 m/z, 22 eV, positive), d4-SA (141.0 ◊ 97.1 m/z, 16 eV, negative), d6-ABA (269.1 ◊ 159.1 m/z, 8 eV, negative) and H2JA (211.1 ◊ 59.0 m/z, 12 eV, negative). Phytohormone concentrations were measured by comparing relative peak area against calibration curves, created from serial dilutions of the standards. The curve was plotted from 4–6 data points in a range of 10-1000 ng/ml according to the phytohormone levels found in the samples.
DNA extraction and PCR analysis
Four hundred µl of DNA extraction buffer (160 mM Tris, 56 mM EDTA, 30 mM sodium metabisulfite and 1.6 M sodium chloride) was added into tissue powder (approximately 100 mg) and centrifuged at 13,000 ×g for 5 min. Three hundred µl of supernatant was taken and mixed with 300 µl of 100% isopropanol. The mixture was incubated at room temperature for 10 min with occasionally tube-inverting and then centrifuged at 13,000 ×g for 5 min. The pellet was washed with 300 µl of 70% ethanol and air-dried overnight. Dried DNA pellet was dissolved in 50 µl of nuclease-free water (Qiagen, Germany). DNA concentration was measured using UV5Nano spectrophotometer (Mettler-Toledo, US).
Six C. sativa genes (encoding actin, ubiquitin, EF-1α, chitinase 5, chitinase 2 and chitinase 4-like) were predicted from the C. sativa draft genome [46]. Gene and primer details are described in Additional file 5. A 100 ng of DNA template was added to 25 µl of PCR reaction mixture, consisted of 1× MyTaq Red buffer, 0.5 U MyTaq DNA polymerase (Bioline, US) and 0.4 µM forward and reverse primers each. The PCR amplification was performed using T100 thermal cycler (Bio-Rad, US) with an initial denaturation of 2 min at 95°C, following by 35 cycles of 30 s at 95°C, 30 s at 55°C and 1.15 min at 72°C, and a final extension of 5 min at 72°C. A 10 µl of amplification product was resolved in 1% agarose gel electrophoresis at 85 V for 50 min. The gel was stained with ethidium bromide and analyzed using Gel Doc EZ imager equipped with ImageLab software (Bio-Rad, US).
Statistical analysis
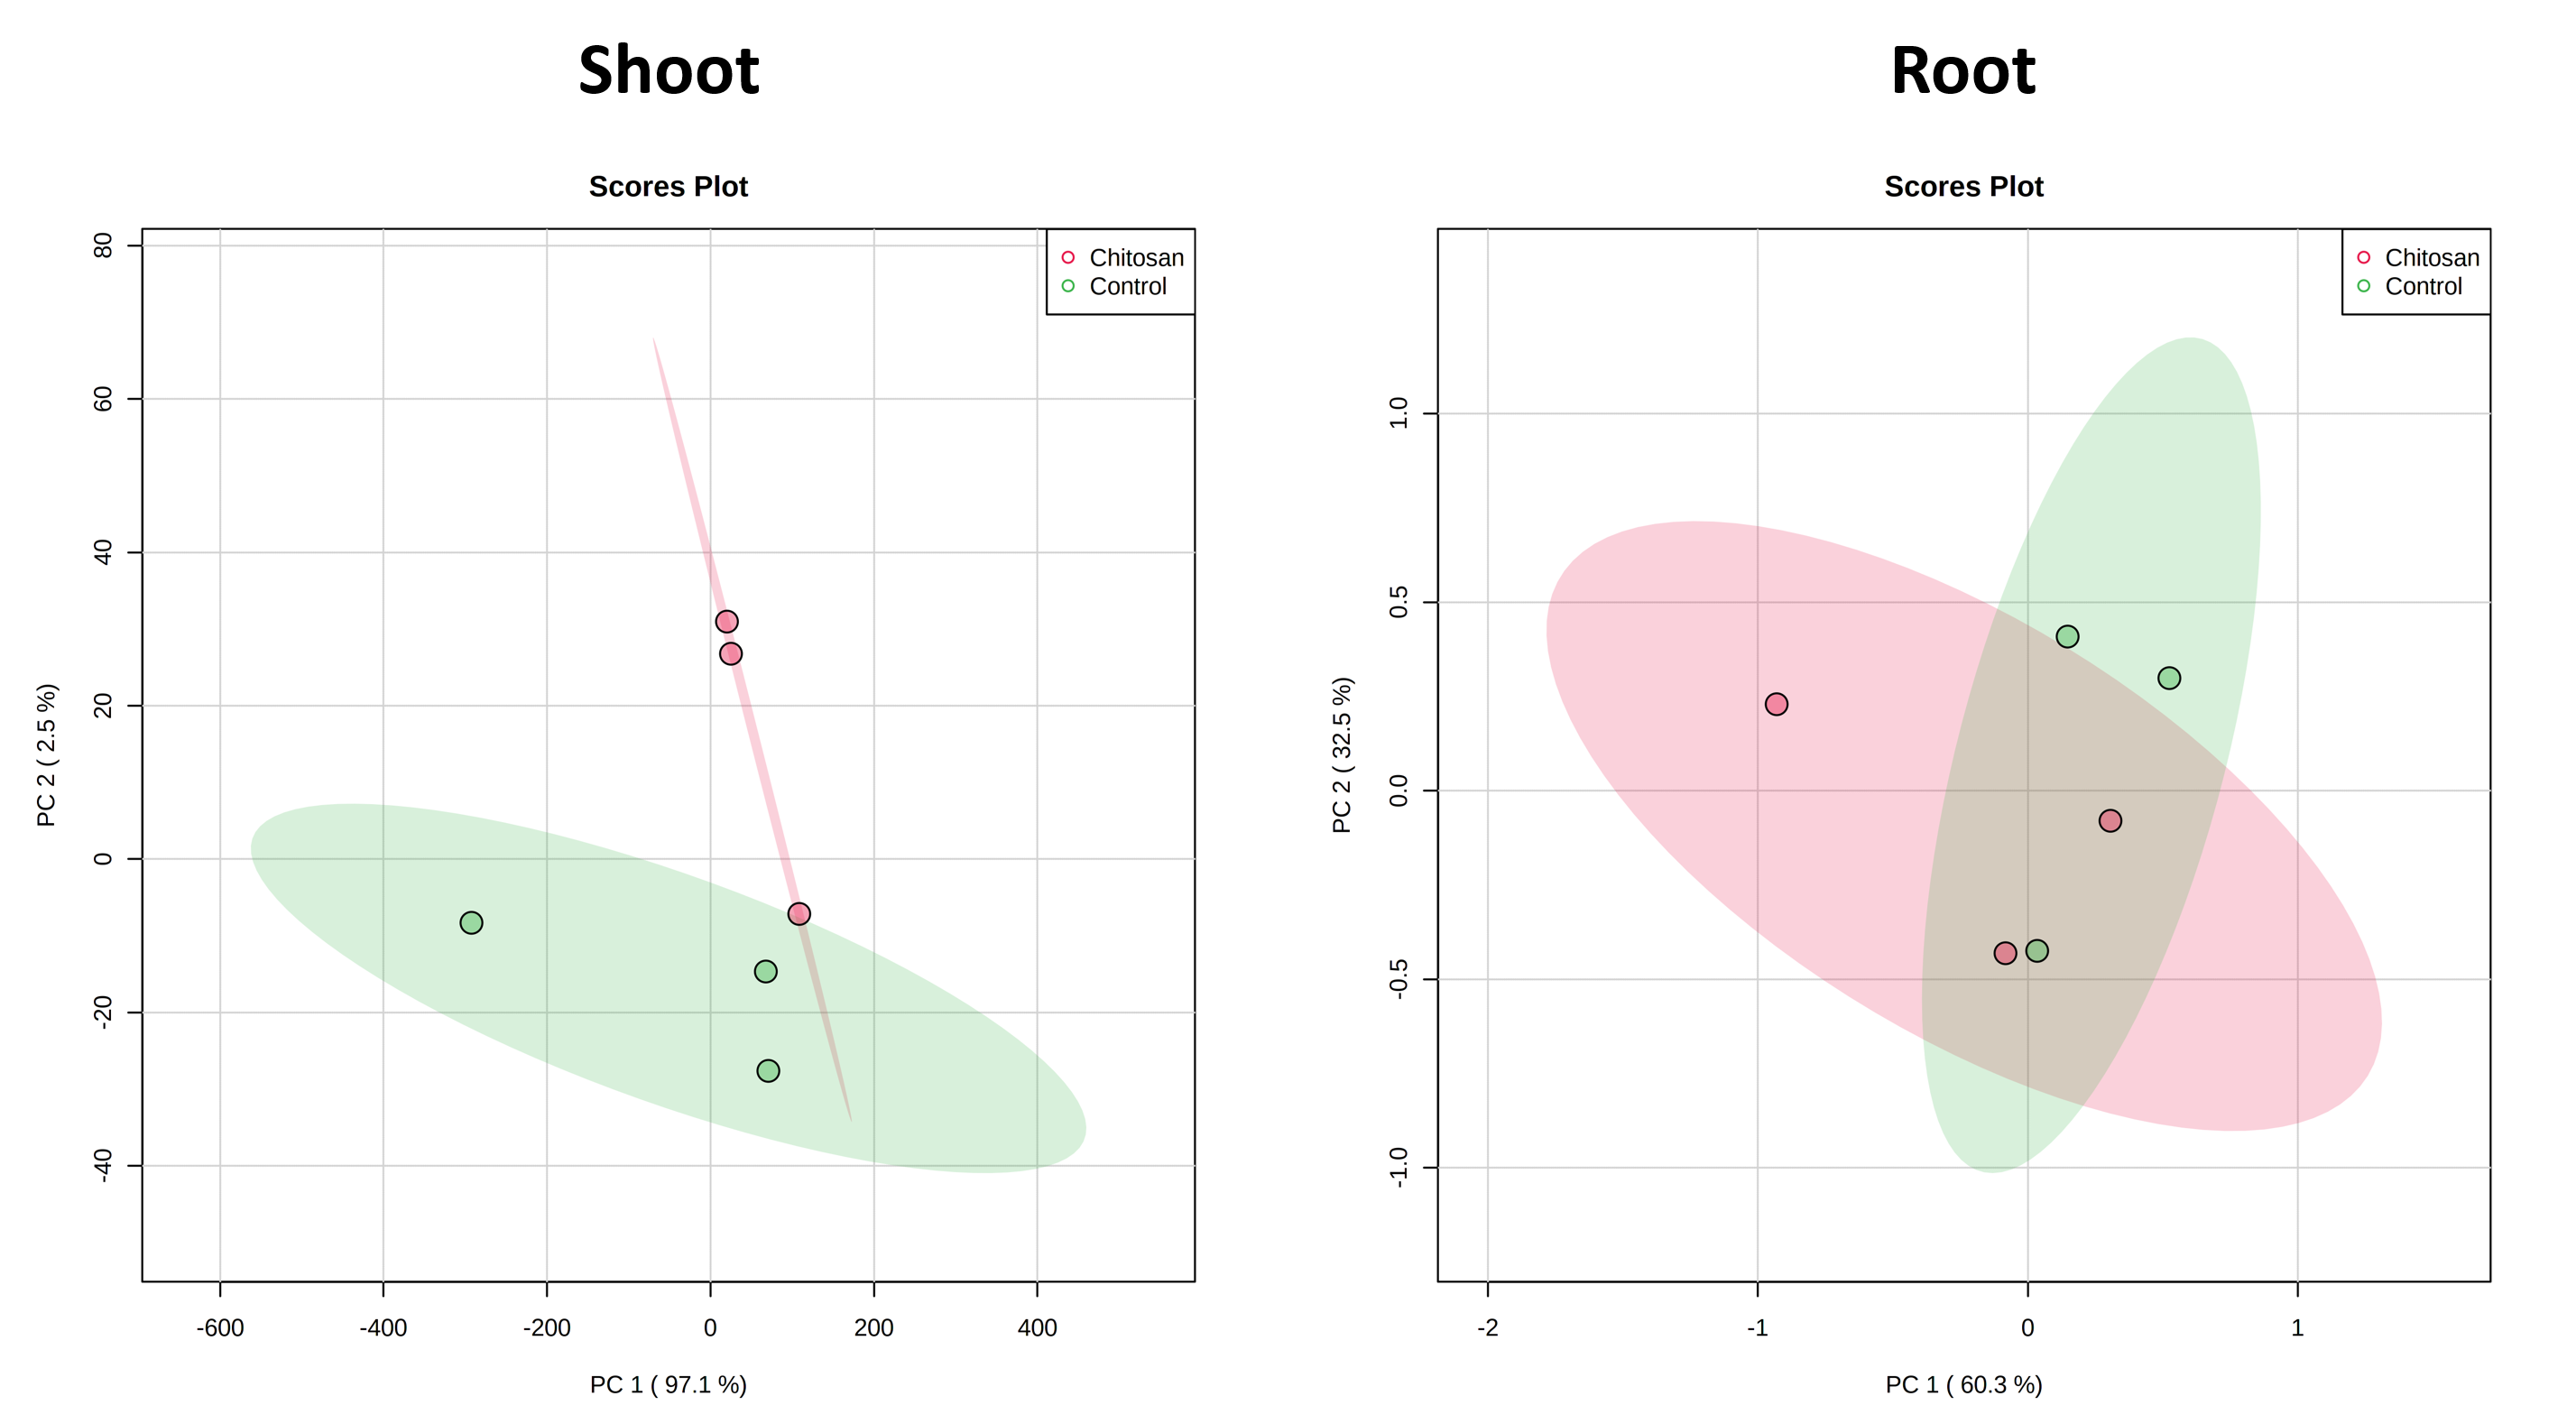
Two-tailed student’s T-test was used for enzymatic activity and phytohormone content with Microsoft Excel 2016 software. One-way ANOVA followed by Tukey’s honestly significant difference (HSD) analysis was used for root growth measurement and hydrogen peroxide content with Minitab 19 software. A p-value below 0.05 was considered as a significant difference between tested conditions. P-value above 0.05 but below 0.10 was marginally significant difference. Online MetaboAnalyst 5.0 software [67] was used to perform principal component analysis (PCA) of overall phytohormone content. Before the analysis, Pareto data scaling was employed to normalize shoot tissue data while the data of root tissue was log-transformed and scaled using mean centering.